Monthly Archives: November 2021

Oregon bans real estate buyer love letters | Waccabuc Real Estate

A real estate firm seeks to block a new Oregon law that bans real estate agents from forwarding “love letters” from homebuyers to sellers.

A lawsuit filed in federal court Friday by the conservative Pacific Legal Foundation on behalf of Total Real Estate Group alleges the state’s ban on these communications violates the First Amendment rights of real estate brokers and their clients.

“This censorship is based on mere speculation that sellers might sometimes rely on information in these letters to discriminate based on a protected class,” according to the lawsuit.

Oregon Attorney General Ellen Rosenblum and Oregon Real Estate Commissioner Steve Strode could not be reached for comment.

Oregon is the first state to ban the practice. Under the law, which is scheduled to take effect in January, real estate agents will not be allowed to pass along personal pitches from buyers that can include details about people’s lives along with photographs and videos. Buyers will still be allowed to communicate directly with home sellers.

In hot markets where multiple bidders jockey for the same house, buyers will do just about anything to get their offer noticed – and that includes writing “love letters” in hopes of making a personal connection with a seller.

Increasingly, the real industry has grown uneasy that “love letters” could violate state and federal fair housing laws by revealing the buyer’s race, color, religion, sex, sexual orientation, national origin, marital status or familial status. Many real estate agents refuse to accept or deliver them.

Democratic Rep. Mark Meek, the state lawmaker who sponsored the legislation, told USA TODAY in August that Oregon is not impeding free speech.

“We are limiting transmission of communications that are not relevant and could potentially be breaking fair housing laws,” he said.

No other state has followed Oregon’s lead.

Daniel Ortner, an attorney with the Pacific Legal Foundation, said the law is “a blatant First Amendment violation.”

“Love letters” can help first-time buyers compete with cash-rich buyers or institutional investors and can help sellers searching for buyers who will care for their homes and be good neighbors, Ortner said. The letters signal genuine interest in a property, he said.

Ortner said the law’s proponents have not produced any examples of fair housing complaints or lawsuits as a result of love letters.

“This is a solution in search of a problem. There is no evidence that it is a real problem that’s really resulting in discrimination,” he said. “And you can’t just go and ban whole types of communication in the fear that some small portion of it might somehow be used by someone.”

The backlash against love letters is part of an industrywide reckoning with its complicity in decades of housing discrimination and segregation that kept Black Americans from homeownership.

In 2019, Newsday published the findings of a three-year undercover investigation that exposed discriminatory home-selling practices by real estate agents that helped keep neighborhoods in Long Island, New York, segregated. Agents treated people of color unequally, especially Black residents, the investigation found.

Efforts to reform racist practices and increase Black homeownership intensified after the murder of George Floyd in Minneapolis.

Last year, the National Association of Realtors warned members love letters were not as harmless as they seemed.

But as stratospheric prices and record low housing inventory fuel bidding wars, love letters are more popular than ever.

Realtors said they don’t want to put their buyers at a disadvantage in competitive situations by refusing to pass them along. Besides, they said, sellers are swayed first and foremost by the offering price and terms.

But the right words can be persuasive. In 2019, the Redfin real estate brokerage studied the most effective strategies to win a bidding war. All-cash offers more than tripled a buyer’s odds. Writing a love letter came in second, increasing a buyer’s chances by 59%.

read more…

This article originally appeared on USA TODAY: Oregon sued over law banning real estate ‘love letters’ in hot market

Existing home sales down 5.8%, Median price up 13.1% | Katonah Real Estate

Key Highlights

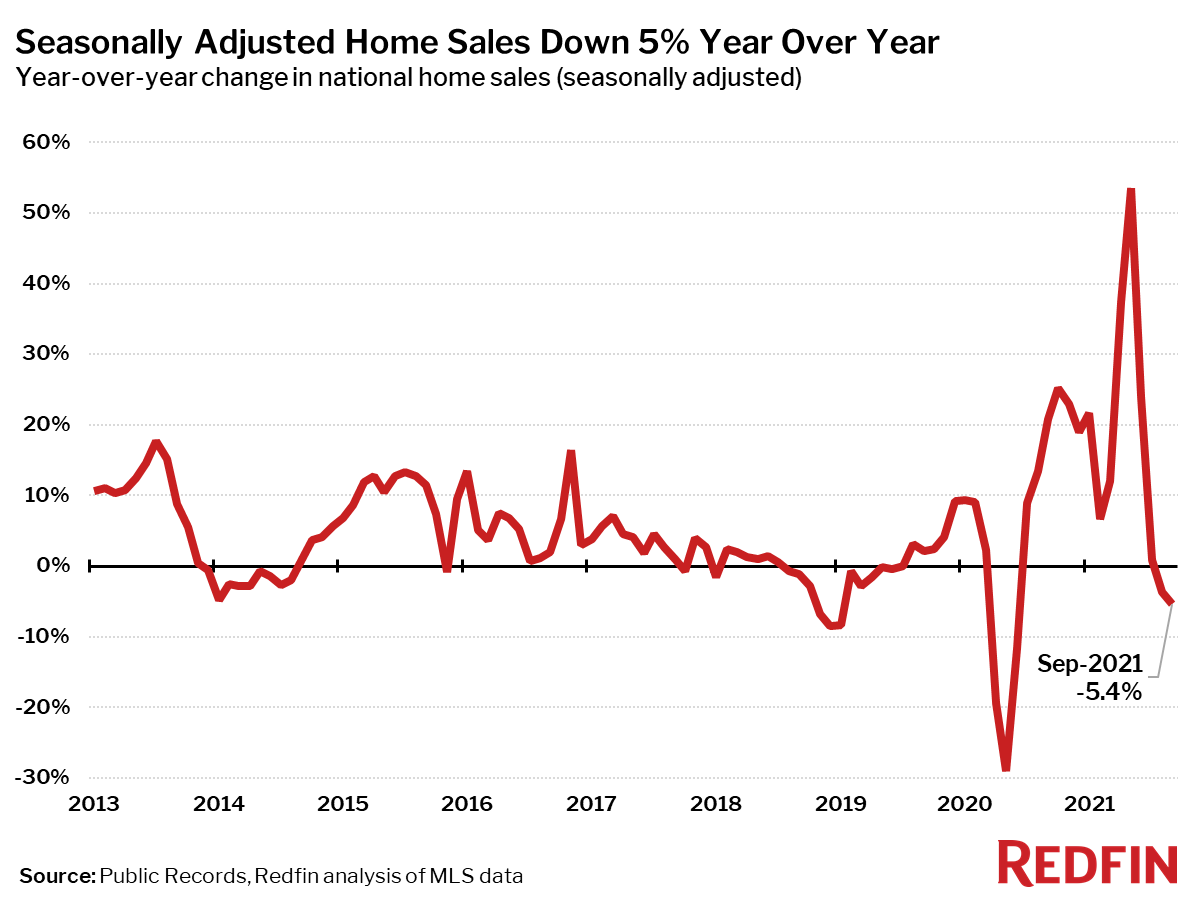
  • Existing-home sales rose 0.8% in October from September to a seasonally adjusted annual rate of 6.34 million, sustaining the growth in sales in the prior month.
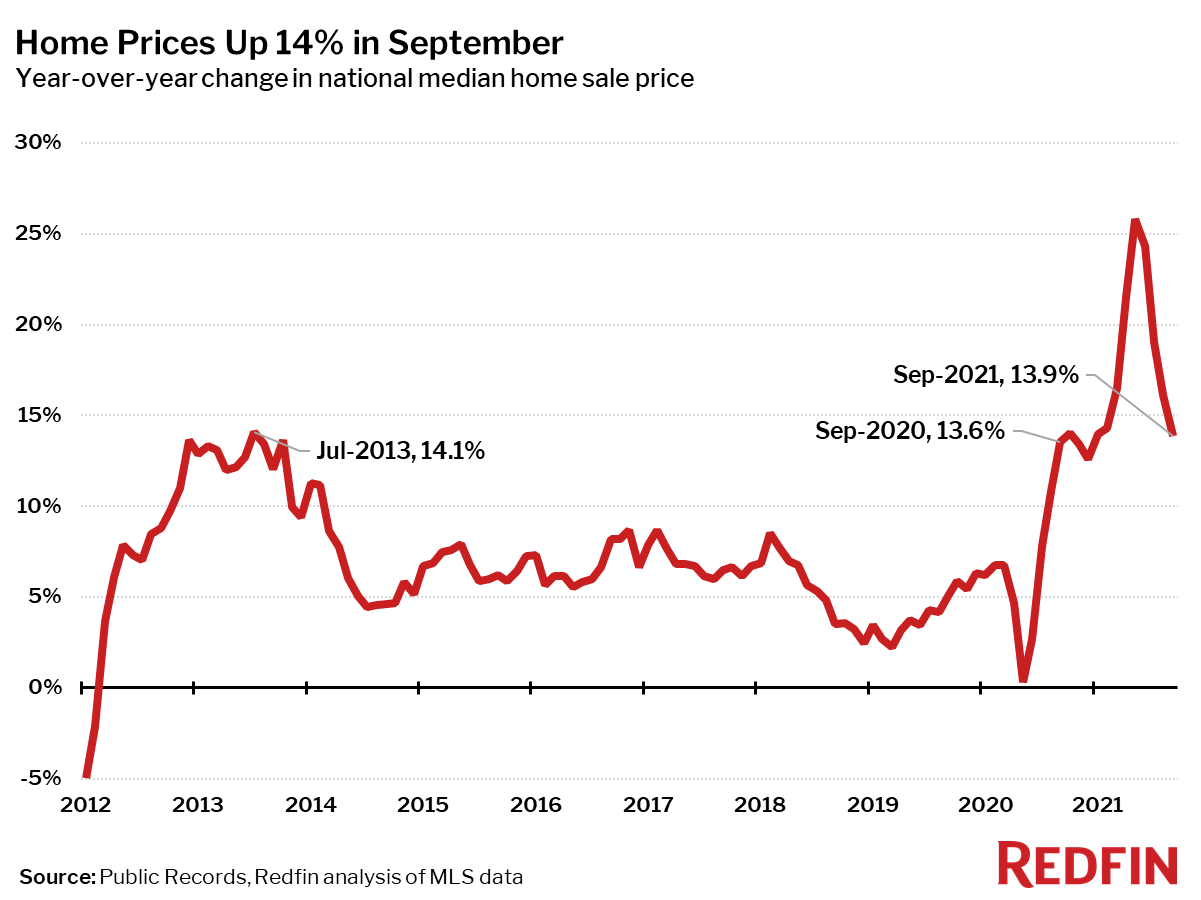
  • The median existing-home sales price increased 13.1% year-over-year to $353,900.
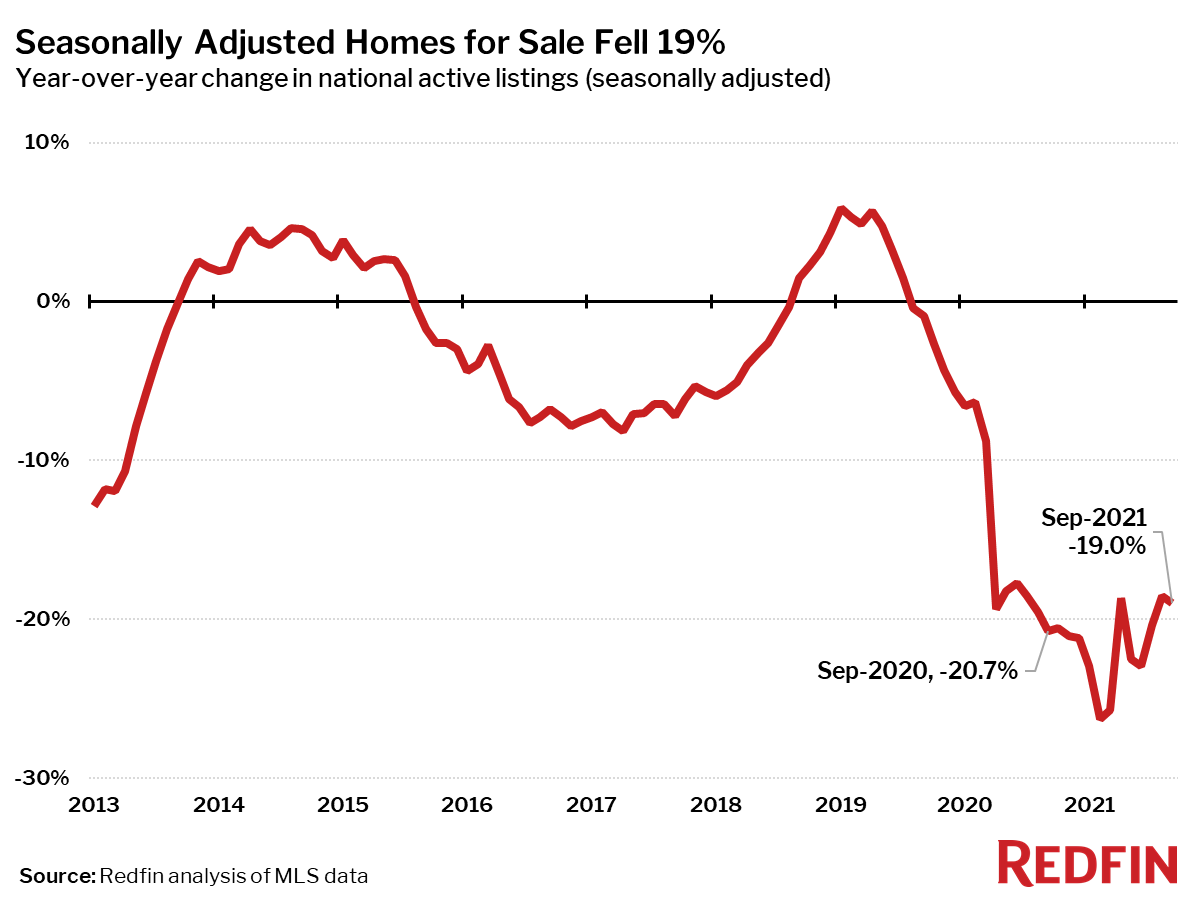
  • From one year ago, the inventory of unsold homes decreased 12% to 1.25 million – equivalent to 2.4 months of the monthly sales pace.

Existing-home sales increased in October, marking two straight months of growth, according to the National Association of Realtors®. Two of the four major U.S. regions saw month-over-month sales climb, one region reported a drop and the fourth area held steady in October. On a year-over-year basis, each region witnessed sales decrease.

Total existing-home sales,[i] https://www.nar.realtor/existing-home-sales, completed transactions that include single-family homes, townhomes, condominiums and co-ops, rose 0.8% from September to a seasonally adjusted annual rate of 6.34 million in October. Sales fell 5.8% from a year ago (6.73 million in October 2020).

“Home sales remain resilient, despite low inventory and increasing affordability challenges,” said Lawrence Yun, NAR’s chief economist. “Inflationary pressures, such as fast-rising rents and increasing consumer prices, may have some prospective buyers seeking the protection of a fixed, consistent mortgage payment.”

Total housing inventory[ii] at the end of October amounted to 1.25 million units, down 0.8% from September and down 12.0% from one year ago (1.42 million). Unsold inventory sits at a 2.4-month supply at the current sales pace, equal to September’s supply, and down from 2.5 months in October 2020.

The median existing-home price[iii] for all housing types in October was $353,900, up 13.1% from October 2020 ($313,000), as prices climbed in each region. This marks 116 straight months of year-over-year increases, the longest-running streak on record.

“Among some of the workforce, there is an ongoing trend of flexibility to work anywhere, and this has contributed to an increase in sales in some parts of the country,” said Yun. “Record-high stock markets and all-time high home prices have worked to significantly raise total consumer wealth and, when coupled with extended remote work flexibility, elevated housing demand in vacation regions.”

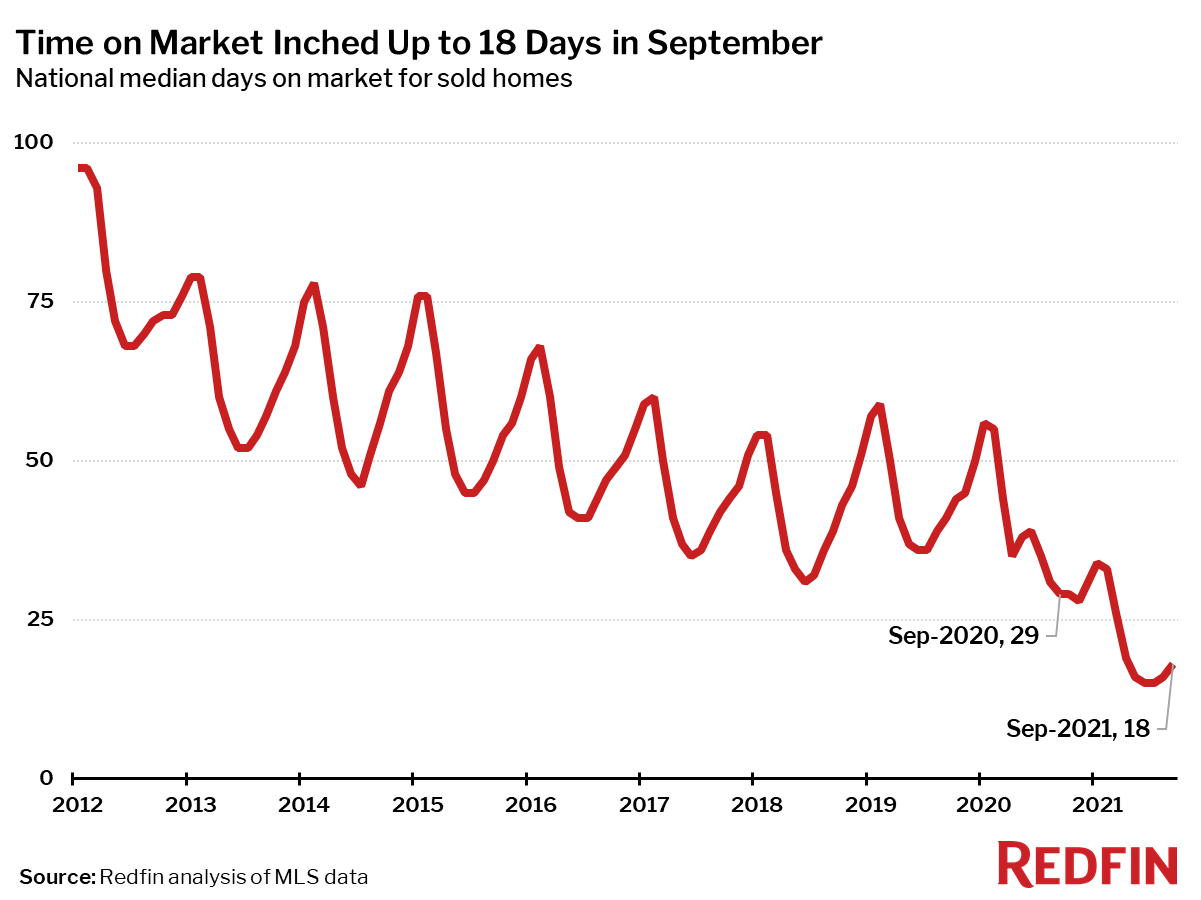
Properties typically remained on the market for 18 days in October, up from 17 days in September and down from 21 days in October 2020. Eighty-two percent of homes sold in October 2021 were on the market for less than a month.

In October, first-time buyers were responsible for 29% of sales, up from 28% in September and down from 32% in October 2020. NAR’s 2021 Profile of Home Buyers and Sellers – released earlier this month[iv] – reported that the annual share of first-time buyers was 34%.

Individual investors or second-home buyers, who make up many cash sales, purchased 17% of homes in October, up from both 13% in September and from 14% in October 2020. All-cash sales accounted for 24% of transactions in October, up from both 23% in September and from 19% in October 2020.

Distressed sales[v] – foreclosures and short sales – represented less than 1% of sales in October, equal to the percentage seen a month prior and equal to October 2020.

According to Freddie Mac, the average commitment rate for a 30-year, conventional, fixed-rate mortgage was 3.07 in October, up from 2.90% in September. The average commitment rate across all of 2020 was 3.11%.

Single-family and Condo/Co-op Sales

Single-family home sales rose to a seasonally adjusted annual rate of 5.66 million in October, up 1.3% from 5.59 million in September and down 5.8% from one year ago. The median existing single-family home price was $360,800 in October, up 13.5% from October 2020.

Existing condominium and co-op sales were recorded at a seasonally adjusted annual rate of 680,000 units in October, down 2.9% from 700,000 in September and down 5.6% from one year ago. The median existing condo price was $296,700 in October, an annual increase of 8.7%.

“At a time when mortgage rates are still low, buying and securing a home is a wise investment,” said NAR President Leslie Rouda Smith, a Realtor® from Plano, Texas, and a broker associate at Dave Perry-Miller Real Estate in Dallas. “NAR will strive to make homeownership obtainable for all who want to pursue one of the key components of the American Dream.”

Regional Breakdown

Existing-home sales in the Northeast fell 2.6% in October, registering an annual rate of 750,000, a 13.8% decline from October 2020. The median price in the Northeast was $379,100, up 6.4% from one year ago.

Existing-home sales in the Midwest rose 4.2% to an annual rate of 1,500,000 in October, a 6.3% decrease from a year ago. The median price in the Midwest was $259,800, a 7.8% jump from October 2020.

Existing-home sales in the South increased 0.4% in October, posting an annual rate of 2,780,000, a 3.5% drop from one year ago. The median price in the South was $315,500, a 16.1% climb from one year prior.

Existing-home sales in the West neither rose nor fell from the prior month’s level, registering an annual rate of 1,310,000 in October, down 5.1% from one year ago. The median price in the West was $507,200, up 7.7% from October 2020.

The National Association of Realtors® is America’s largest trade association, representing more than 1.5 million members involved in all aspects of the residential and commercial real estate industries.

# # #

For local information, please contact the local association of Realtors® for data from local multiple listing services (MLS). Local MLS data is the most accurate source of sales and price information in specific areas, although there may be differences in reporting methodology.

NOTE: NAR’s Pending Home Sales Index for October is scheduled for release on November 29, and Existing-Home Sales for November will be released December 22; release times are 10:00 a.m. ET.

Information about NAR is available at www.nar.realtor. This and other news releases are posted on the NAR Newsroom at www.nar.realtor/newsroom. Statistical data in this release, as well as other tables and surveys, are posted in the “Research and Statistics” tab.


[i] Existing-home sales, which include single-family, townhomes, condominiums and co-ops, are based on transaction closings from Multiple Listing Services. Changes in sales trends outside of MLSs are not captured in the monthly series. NAR rebenchmarks home sales periodically using other sources to assess overall home sales trends, including sales not reported by MLSs.

Existing-home sales, based on closings, differ from the U.S. Census Bureau’s series on new single-family home sales, which are based on contracts or the acceptance of a deposit. Because of these differences, it is not uncommon for each series to move in different directions in the same month. In addition, existing-home sales, which account for more than 90% of total home sales, are based on a much larger data sample – about 40% of multiple listing service data each month – and typically are not subject to large prior-month revisions.

The annual rate for a particular month represents what the total number of actual sales for a year would be if the relative pace for that month were maintained for 12 consecutive months. Seasonally adjusted annual rates are used in reporting monthly data to factor out seasonal variations in resale activity. For example, home sales volume is normally higher in the summer than in the winter, primarily because of differences in the weather and family buying patterns. However, seasonal factors cannot compensate for abnormal weather patterns.

Single-family data collection began monthly in 1968, while condo data collection began quarterly in 1981; the series were combined in 1999 when monthly collection of condo data began. Prior to this period, single-family homes accounted for more than nine out of 10 purchases. Historic comparisons for total home sales prior to 1999 are based on monthly single-family sales, combined with the corresponding quarterly sales rate for condos.

[ii] Total inventory and month’s supply data are available back through 1999, while single-family inventory and month’s supply are available back to 1982 (prior to 1999, single-family sales accounted for more than 90% of transactions and condos were measured only on a quarterly basis).

[iii] The median price is where half sold for more and half sold for less; medians are more typical of market conditions than average prices, which are skewed higher by a relatively small share of upper-end transactions. The only valid comparisons for median prices are with the same period a year earlier due to seasonality in buying patterns. Month-to-month comparisons do not compensate for seasonal changes, especially for the timing of family buying patterns. Changes in the composition of sales can distort median price data. Year-ago median and mean prices sometimes are revised in an automated process if additional data is received.

The national median condo/co-op price often is higher than the median single-family home price because condos are concentrated in higher-cost housing markets. However, in a given area, single-family homes typically sell for more than condos as seen in NAR’s quarterly metro area price reports.

[iv] Survey results represent owner-occupants and differ from separately reported monthly findings from NAR’s Realtors® Confidence Index, which include all types of buyers. Investors are under-represented in the annual study because survey questionnaires are mailed to the addresses of the property purchased and generally are not returned by absentee owners. Results include both new and existing homes.

[v] Distressed sales (foreclosures and short sales), days on market, first-time buyers, all-cash transactions and investors are from a monthly survey for the NAR’s Realtors® Confidence Index, posted at nar.realtor.

read more…

nar.realtor.com

Housing size trends higher | Bedford Hills Real Estate

An expected impact of the virus crisis is a need for more residential space, as people use homes for more purposes including work. Recent data confirms this impact on the market continues to occur.

According to third quarter 2021 data from the Census Quarterly Starts and Completions by Purpose and Design and NAHB analysis, median single-family square floor area increased to 2,337 square feet. Average (mean) square footage for new single-family homes increased to 2,541.

Since Great Recession lows (and on a one-year moving average basis), the average size of new single-family homes is now 6.2% higher at 2,518 square feet, while the median size is 9.3% higher at 2,296 square feet.

Home size rose from 2009 to 2015 as entry-level new construction was constrained. Home size declined between 2016 and 2020 as more starter homes were developed. Going forward we expect home size to increase again, given a shift in consumer preferences for more space due to the increased use and roles of homes (for work, for study) in the post-Covid-19 environment.

read more…

eyeonhousing.org/2021/11/

Fleeing NYC residents return after Covid | Bedford Real Estate

Since July 2021, the city has gained an estimated 6,332 permanent movers, indicating a gradual return to New York City.

Residents who fled New York City during the early days of the pandemic, particularly the wealthiest neighborhoods, are beginning to return.

New York City Comptroller Scott Stringer released a comprehensive analysis earlier this week (Nov. 15) of the pandemic’s impact on monthly migration patterns into and out of the city. Using data published by the United States Postal Service (USPS) from change of address forms, the analysis confirms that New York City’s net residential out-migration tripled from 2019 to 2020. The data show that the city’s wealthiest neighborhoods experienced the most population loss; residents in the wealthiest 10% of city neighborhoods, as measured by median income, were 4.6 times more likely to move than other residents during 2020.

In more recent months, the reopening of office buildings, the return of in-person school, and the rebirth of arts and entertainment have helped to attract movers to the city. Since July 2021, USPS data has shown an estimated net gain of 6,332 permanent movers, mainly in neighborhoods that experienced the greatest flight, according to the report.

“New York City is steadily reopening and New Yorkers are returning to the city we love—that’s why it’s vital that we invest in the value proposition that is New York City and make sure we continue to be the best place to live, work, and raise a family,” said New York City Comptroller Stringer. “That means investing in our classrooms and teachers so our children get the very best education, investing in affordable and accessible child care so parents can return to work, and investing in our streetscapes and green spaces to ensure that our neighborhoods are walkable and breathable. We have a once-in-a-generation opportunity to reimagine our city and build back stronger than ever from the losses of the pandemic.”

Despite recent gains, certain neighborhoods have a long road ahead to regain pre-pandemic population. Whether or not these gains continue and accelerate will depend on the trajectory of the pandemic and the city’s ability to maintain in-person activities and attractions, as well as the endurance of telework arrangements and workers’ ability and desire to live farther from their place of work as commuting becomes less burdensome.

Major findings of the analysis include:

• In the first three months of the pandemic, from March to May 2020, more than 60% of net moves from city addresses were marked as temporary, indicating that the person or household intended to return, but since then 79% of net moves have been marked as permanent.

• Excluding moves marked as “temporary,” net out-migration from the city increased by an estimated 130,837 from March 2020 through June 2021, as compared to pre-pandemic trends.

• Residents from the city’s wealthiest neighborhoods were the most likely to leave. Residents in the wealthiest 10% of city neighborhoods, as measured by median income, were 4.6 times more likely to leave than other residents during 2020, recording 109 net move-outs per 1,000 residents vs 24 elsewhere. Moves from wealthier neighborhoods were also more likely to be recorded as temporary. About half of net out-migration from the wealthiest 10% of neighborhoods was marked as temporary in 2020, compared to 44% in the next wealthiest decile and less than 30% elsewhere.

• In September 2021, New York City public schools and colleges opened to full-time, in-person learning; some employers, including city government, called office workers back; and the curtains rose on Broadway after an 18-month shutdown. Not surprisingly, these events coincided with an improvement in net residential migration to the city, particularly in the neighborhoods that experienced the greatest flight in the spring of 2020.

• Since July 2021, USPS data has shown an estimated net gain of 6,332 permanent movers, indicating a gradual return to New York City, mainly in neighborhoods that experienced the greatest flight. On a per-capita basis, the largest net gains over the summer were in Chelsea/Midtown, Murray Hill/Gramercy, Battery Park City/Greenwich Village, and Chinatown/Lower East Side.

read more…

realestateindepth.com/news/

States can improve housing well-being through thoughtfully designed policies | Pound Ridge Real Estate

Senior Fellow – Brookings MetroFuture of the Middle Class Initiative


Jenny Schuetz

Rising housing costs have become an increasingly salient political issue for state-level elected officials across the United States. Local governments have traditionally exerted the most direct control over land use and housing production, yet political and fiscal incentives align to pressure local officials into restricting new development, especially of moderately priced homes. However, state governments are increasingly feeling the pinch of poorly functioning housing markets in several ways. Inadequate supply, especially in near job centers and transportation infrastructure, makes it harder for companies to recruit and retain workers. Most new housing is developed on the urban fringe in car-dependent locations, leading to higher traffic volumes and more greenhouse gas emissions. Exclusionary zoning by affluent, high-opportunity communities restricts economic mobility and exacerbates racial and economic segregation. In short, the economic, social, and environmental costs of poorly functioning housing markets spill over beyond local boundaries to affect entire regions and states. State-level action has the potential to improve these outcomes.

In a new study, I examine what state governments can—and should—do to encourage healthy housing markets. I identify four broad goals to guide statewide housing policies, discussed in more detail below. To illustrate the range of existing state policy approaches, I examine the types of policies uses by five contrasting states: California, Massachusetts, Oregon, Utah, and Virginia. To achieve any particular goal, states can use a variety of different policy tools, giving them flexibility to design an approach that fits their economic needs, institutional capacity, and political circumstances.

GOAL #1: ANALYZE STATE HOUSING MARKET CONDITIONS TO DESIGN APPROPRIATE POLICIES

Before adopting or amending housing policies, state leaders should use data to identify key needs and challenges, and design their interventions accordingly. Comparing a handful of simple metrics across the five sampled states illustrates how differences in underlying market conditions can inform policy choices (Figure 1).

Figure 1

Population growth is a primary driver of housing demand: Fast-growing places need to build more housing to accommodate more people. Utah counties experienced by far the highest average population growth (0.16) between 2009 and 2019, three times as high as Massachusetts counties. This implies that the typical Utah locality will need to expand housing supply more than localities in other states, particularly slow-growth states like Massachusetts.

A helpful affordability metric is the ratio of median home values to median household incomes. Value-to-income ratios between 3 and 4 are considered healthy, because they imply that the typical household could buy a home while spending about one-third of their monthly income on housing. Of the studied states, only Utah and Virginia fall in that range. California has (unsurprisingly) the most expensive housing, with median home value-to-income ratios around 7.00—well above any threshold for “affordable.”

The final metric, the share of housing built before 1940, is a proxy for housing quality. Older homes typically have higher maintenance needs, including lower energy efficiency. Massachusetts stands out for having a very large share of older housing.

Although specific policy priorities and strategies will vary across states, based on underlying housing market conditions, most states could benefit from policies to address the next three goals:

  • Encourage housing production in places with strong demand
  • Provide financial support to low-income households,
  • Reduce climate risks

GOAL #2: ENCOURAGE HOUSING PRODUCTION IN PLACES WITH STRONG DEMAND

Current debates over how statewide zoning reform start with the assumption that local governments are overly restrictive of housing, needing more state oversight. This raises the question: Are strict zoning and limited housing production prevalent across all (or most) localities within states? One simple diagnostic is to look at the relationship between housing growth and prices or rents: In well-functioning housing markets, places with strong demand will add more housing, while places with weak demand build very little.

Graphing county-level housing values and changes in the number of homes for our sample states shows the expected positive relationship in four states (Figure 2). In Massachusetts, Oregon, Utah, and Virginia, counties that had higher population growth from 2009 to 2019 had higher housing values in 2019. (Counties offer a consistent unit of analysis across states, although cities and towns also play important roles in land use regulation.) California is the one exception: The more rapidly growing counties are among the least expensive. This corresponds with prior research that affluent counties have the most restrictive regulations and generally oppose new development.

Figure 2

States have at least four different strategies to incentivize local governments to allow more development in places with strong demand. These can be designed either to apply to all localities within a state or targeted towards specific places where supply lags demand. Broadly defined, these strategies include:

  • Financial carrots and/or sticks tied to quantitative housing production targets
  • Oversight of local land use planning
  • Create a “builders remedy” that allows developers to override local zoning under certain conditions (for instance, to construct below-market-rate housing),
  • State pre-emption of specific zoning rules

Over the past few years, several states have focused on preemption of narrowly defined rules, especially zoning bans on accessory dwelling units (ADUs) and duplexes. However, the most effective policies will target improved housing outcomes, such as increased production or affordability. Land use regulations are complex and multi-layered, making it easy for localities that don’t want to produce housing to appear compliant on paper while actually not building anything. For example, a city’s zoning might technically allow duplexes, while large setback requirements or low floor-to-area ratios make them financially infeasible or impractical.

GOAL #3: PROVIDE FINANCIAL SUPPORT TO LOW-INCOME HOUSEHOLDS

Even in well-functioning housing markets with abundant housing, the poorest 20% of households in all parts of the U.S. cannot afford even modest market-rate housing without subsidies. This is primarily a reflection of very low wages, and so can be most directly addressed by giving poor households direct financial assistance. Because federal housing subsidies are not an entitlement, only one in four poor renters receive any federal rental subsidy. States have a number of different ways they can support low-income households including:

  • Household-based rental assistance, such as vouchers and homelessness prevention services
  • Supply-side rental assistance, including the federal Low-Income Housing Tax Credit (LIHTC) program
  • Subsidies to help low-income homeowners with maintenance and utility costs,
  • Down-paymentassistance for first-time homeowners

GOAL #4: REDUCE CLIMATE RISKS

Land use regulation and building codes are part of the toolkit available to state governments to reduce the risk and harm of climate change. Ideally, state environmental protection laws should discourage development in risky and/or sensitive locations (e.g. flood- and fire-prone areas) and encourage climate-friendly homes (energy efficient materials, structures, and locations), while not unduly restricting overall housing stock relative to population and job growth. In practice, states often struggle to balance these goals. The clearest example is California’s landmark environmental protection law, CEQA. Adopted in the 1970s with the intent to limit environmentally damaging development, in recent years CEQA has been weaponized by NIMBY homeowners to block projects with broad public benefits, including climate-friendly projects like bike lanes.

CURRENT STATE HOUSING POLICIES START FROM WIDELY VARYING BASELINES

Housing policies in the five studied states vary along several important dimensions. They represent different points along the intensity and complexity of current policies, from highly complex (California) to lightest touch (Utah and Virginia). The states’ legal and institutional structures—the framework within which localities operate—also vary widely. California sets housing production targets for metro areas and localities—although these targets have not been effectively enforced. California and Oregon have explicit statewide mandates to monitor land use planning and/or housing production. Massachusetts has a statewide “fair share” rule focused on low-income housing, which allows developers to override local zoning under certain conditions. All five states offer some types of housing subsidies, but differ in the target populations and activities. Figure 3 summarizes high-level differences in how each state addresses the four policy goals; specific policies and institutional structures are discussed in more detail in the longer report.

Figure 3

GETTING POLICY JUST RIGHT REQUIRES GOOD DATA, CAREFUL PLANNING, AND A WILLINGNESS TO EXPERIMENT

Because states currently start from such different baselines—both in market conditions and institutional capacity—there is not one consistent set of recommendations that will work for all states. California would benefit from simplifying and streamlining its many complex programs and regulations. Virginia and Utah will need to start slowly, assessing current needs and building up staff capacity. With that caveat, three general rules of good policy can benefit all states.

  • Do your homework. Thoughtful data analysis is the foundation of solid policy.
  • Experiment, evaluate, and tweak. It’s hard to get policy “just right” on the first try, especially in such a complex and fast-changing market. Implementing pilot programs that can be evaluated and tweaked before rolling out at scale can help deliver better long-term results.
  • Keep things simple. Complex policies and regulations require more staff time and resources to administer and oversee and impose higher administrative burdens on grant recipients to comply.
  • Think hard about unintended consequences. Policies can have ripple effects that undermine their primary goals—and it’s very difficult to reform or repeal harmful policies (like California’s CEQA and Prop 13) once they become deeply entrenched.

read more…

brookings.edu/research/

NYC rents skyrocket amid record-high inflation rates | Bedford Corners Real Estate

As New Yorkers struggle with higher gas and grocery prices amid record-high inflation rates, the cost of rent is also increasing — and isn’t expected to level off anytime soon, according to data and experts. 

The net effective median rent in Manhattan increased by a whopping 10.1 percent between July and October and 20 percent since January as inflation jumped to the highest level seen since 1990, according to data compiled by Miller Samuel/Douglas Elliman.

In Queens, the third-quarter median asking rent was $2,200 this year, just $100 shy of the pre-pandemic peak set in quarter three of 2019, according to data from StreetEasy. 

While numbers from Miller Samuel/Douglas Elliman show housing costs across Manhattan, Brooklyn and Northwest Queens are still lower than 2019, early numbers from real estate analytics company UrbanDigs show prices jumped beyond pre-pandemic levels this month. 

So far, the median asking rent in Manhattan is up 27 percent this month compared to last year and up 4 percent compared to November 2019, the data show. 

Cityscape at dusk of the upper westside looking to midtown.
New York’s numbers reflect a nationwide trend that’s seen a 0.4 percent increase in housing cost for renters between September and October.

In Brooklyn, the median asking rent is up 15 percent so far this month compared to last year and up 5 percent compared to Nov. 2019. 

“I wish I had better news on that one, I think a lot of tenants are likely to get sticker shock at their next lease renewal,” Greg McBride, the chief financial analyst at the personal finance website Bankrate.com, told The Post. 

“If inflation does eventually moderate and we get back to that 2 percent rate of inflation, then OK, that’s an environment where rents would likely increase at a much more modest, pedestrian pace, but if inflation stays at 4 or 5 percent, that’s going to translate into similar increase in rents year after year.” 

New York’s numbers reflect a nationwide trend that’s seen a 0.4 percent increase in housing cost for renters between September and October amid a dwindling supply of listings, high demand and a supply chain bottleneck that’s increased the cost of home building materials, Labor Department data show. 

Earlier this year, rents in tech hubs like New York City, Los Angeles and Chicago were declining by 15.8 percent but in September, they jumped by 7.6 percent year over year, according to data from Realtor. 

“In New York City, the vacancy rate here is already absurdly low and rents have been steadily rising post pandemic as there is more demand than supply. Additionally, if mortgage rates start to go up and affordability is affected it will force potential buyers to become renters as they are priced out of the market,” Pamela Liebman, the CEO of real estate giant Corcoran, told The Post. 

“If mortgage rates rise, that will put additional pressure on an already robust rental market and we could see a serious rise in rent. And as landlords’ costs go up due to inflation, they will continue to pass the increases on to the tenants.” 

High angle view of Lower East Side in Manhattan.
Earlier this year, rents in tech hubs like New York City, Los Angeles and Chicago were declining by 15.8 percent but in September, they jumped by 7.6 percent year over year

The pandemic massively disrupted New York’s housing market and is partly to blame for the sky-high increases, said Jonathan Miller, the President and CEO of Miller Samuel Inc.

“The rate of growth in 2021 has been like a rocket ship, but it’s coming from a very low place because rents fell to 25% during the early days of the pandemic and now are rising,” Miller explained. 

“If we look at net-effective median rent for all of Manhattan compared to October of 2019, so pre-pandemic but the same seasonal period in the year, median rent is 0.8 percent below 2 years ago. It’s very close to parity.” 

Still, with billions in stimulus dollars flowing through the region, expected wage growth and the return of international buyers, demand is only expected to go up and unless the housing supply increases, rent costs are slated to jump even more, too, said Miller.  

In 2020, the number of new housing permits decreased by 26.3 percent citywide and in Manhattan, only 1,896 new housing permits were issued last year, down 65.6 percent from 2019 and the lowest level seen since the 2010 Great Recession, city statistics show.  

Aerial photo of Manhattan buildings.
Rents are expected to continue to grow throughout the end of the year and throughout next spring according to an economist at StreetEasy.

“Rents are going to continue to grow throughout the end of the year and throughout next spring,” said Nancy Wu, an economist with StreetEasy. 

“We’re going to see a very busy rentals market [next year] and high demand is going to lead to higher rents, given the supply is pretty constant.” 

At the start of the pandemic, New York implemented a moratorium on evictions barring landlords from booting tenants who can show they’re behind on their rents because of COVID-era financial difficulties but the program will end come January 15. 

Beyond that, cash-strapped renters can apply for state aid through a federally financed program designed to help lower-income New Yorkers pay their housing costs but that program has a bottom, too. 

So far, tenants have filed 252,000 applications, 73,000 of which have been paid out, totaling $913 million in aid. 

An additional 73,000 applications, totaling $917 million in aid, have been tentatively approved.

read more…

nypost.com/2021/11/11/

Northeast home prices up 17% | Chappaqua Real Estate

Although NAR’s third quarter report showcases price increases across the board, the rate at which they are climbing has slowed.

Adobe Stock / Africa Studio

Median sales prices rose for existing single-family homes in all but one of 183 measured markets in the third quarter of 2021, according to the latest quarterly report from the National Association of Realtors.

The report also found that 78% of the 183 markets experienced double-digit year-over-year price increases, a decrease from 94% in the prior quarter, and three metro areas saw price gains of over 30% from one year ago, also fewer than the number in the previous quarter.

The median sales price of single-family existing homes climbed 16% from one year ago to $363,700, a slower pace in comparison to the preceding quarter at 22.9%. All four major regions had double-digit year-over-year price growth, led by the Northeast at 17.5%, followed by the South at 14.9%, the Midwest at 10.7%, and the West at 10.3%.

“Home prices are continuing to move upward, but the rate at which they ascended slowed in the third quarter,” says Lawrence Yun, NAR chief economist. “I expect more homes to hit the market as early as next year, and that additional inventory, combined with higher mortgage rates, should markedly reduce the speed of price increases.”

The markets with the highest year-over-year price gains were: Austin-Round Rock, Texas; Naples-Immokalee-Marco Island, Florida; Boise-Nampa, Idaho; Ocala, Florida; Punta Gorda, Florida; Salt Lake CityPhoenix; Sebastian-Vero Beach, Florida; Port St. Lucie, Florida; and New York-Jersey City-White Plains, New Jersey.

The most expensive markets in the third quarter were San Jose-Sunnyvale-Santa Clara, CaliforniaSan Francisco; Anaheim-Santa Ana-Irvine, California; HonoluluLos AngelesSan DiegoBoulder, Colorado; Seattle; Bridgeport-Stamford-Norwalk, Connecticut; and Boston.

“While buyer bidding wars lessened in the third quarter compared to early 2021, consumers still faced stiff competition for homes located in the top 10 markets,” continues Yun. “Most properties were only on the market for a few days before being listed as under contract.”

In the third quarter, the average monthly mortgage payment on an existing single-family home financed with a 30-year fixed-rate loan and 20% down payment rose to $1,214, an increase of $156 from one year ago.

Among all home buyers, the monthly mortgage payment as a share of the median family income increased to 16.6%, up from 14.9% a year ago. For first-time buyers, the typical mortgage payment on a 10% down payment loan increased to 25.2% of the median family income, up from 22.6% a year ago.

A family typically needed an income of more than $100,000 to affordably pay a 10% down payment mortgage in 17 markets, matching the prior quarter. In 83 markets, a family typically needed an income of less than $50,000 to afford a home, down from 85 markets in the prior quarter.

“For the third quarter—and for 2021 as a whole—home affordability declined for many potential buyers,” says Yun. “While the higher prices made it extremely difficult for typical families to afford a home, in some cases the historically low mortgage rates helped offset the asking price.”

read more…

builderonline.com/money/prices/

Inventory down, sales slow | Armonk Real Estate

New listings of homes for sale fell 9% from a year earlier and closed home sales were down 5%.

The median price of homes sold in September was $376,800, up 14% from a year earlier, the lowest growth rate since December 2020. September marked the 14th consecutive month of double-digit price gains. Closed home sales and new listings of homes for sale both fell from a year earlier, by 5% and 9% respectively.

“The severe lack of inventory is restricting home sales, said Redfin Chief Economist Daryl Fairweather. “Even though plenty of people bought homes last year, many homebuyers waited while the pandemic went from bad to worse and remote-work policies were finalized. The homebuyers who are just beginning their search are finding that the well has run dry. But I am hopeful that as it becomes easier to get building materials, we will finally have a strong year for new construction in 2022. That’s what the market needs more than anything.”

Market SummarySeptember 2021Month-Over-MonthYear-Over-Year
Median sale price$376,800-0.8%13.9%
Homes sold, seasonally-adjusted613,2001.6%-5.4%
Pending sales, seasonally-adjusted604,9002.9%2.8%
New listings, seasonally-adjusted631,800-2.3%-9.0%
All Homes for sale, seasonally-adjusted1,384,200-2.0%-19.0%
Median days on market182-11
Months of supply1.40-0.3
Sold above list47.8%-4.1 pts13.8 pts
Median Off-Market Redfin Estimate$381,9007.3%19.9%
Average Sale-to-list101.0%-0.6 pts1.6 pts
Average 30-year fixed mortgage rate2.90%+0.06 pts+0.01 pts

† – ‘pts’ = percentage point change

Median sale prices increased from a year earlier in all but one of the 85 largest metro areas Redfin tracks: Bridgeport, CT, where prices were down 2.2%. A year ago prices were up 32% in Bridgeport as the area experienced a sudden flood of interest from homebuyers looking to leave New York. The current price decline is likely a cooling from an extremely overheated state.

The largest price increases in September 2021 were in North Port, FL (+30%), Salt Lake City (+28%) and Austin, TX (+27%).

Home Prices Up 14% in September

Seasonally-adjusted home sales in September were down 5% from a year earlier, the second annual decline in 16 months. Home sales fell in 66 of the 85 largest metro areas Redfin tracks. The biggest sales declines were seen in New Orleans (-42%), Bridgeport, CT (-24%) and Salt Lake City (-23%). The largest gains were in places where sales were still somewhat depressed in September 2020, including New York (+26%), Honolulu (+24%), and San Jose, CA (+15%).

Seasonally Adjusted Home Sales Down 5% Year Over Year

Seasonally adjusted active listings—the count of all homes that were for sale at any time during the month—fell 19% year over year in September, on par with the previous month.

Only three of the 85 largest metros tracked by Redfin posted a year-over-year increase in the number of seasonally adjusted active listings of homes for sale: Austin, TX (+3%), Tacoma, WA (+3%) and Columbus, OH (+0.3%). The biggest year-over-year declines in active housing supply in September were in Baton Rouge, LA (-53%), Salt Lake City (-50%) and Rochester, NY (-47%).

Seasonally Adjusted Homes for Sale Fell 19%

Seasonally adjusted new listings of homes for sale were down 9% in September from a year earlier, only the second decline since February. New listings fell from a year ago in 75 of the 85 largest metro areas. The biggest declines were in Baton Rouge (-59%), Allentown, PA (-57%) and Salt Lake City, UT (-51%). New listings rose the most from a year ago in Austin, TX (+18%), Tacoma, WA (+9%) and Portland, OR (+8%).

Seasonally Adjusted New Listings Down 9% Year Over Year

Measures of housing market competition based on completed home sales eased further in September.

The typical home that sold in September went under contract in 18 days—more than a week faster than a year earlier, when homes sold in a median 29 days, but up three days from the record low in June.

Time on Market Inched Up to 18 Days in September

In September, 48% of homes sold above list price, down 8 percentage points from the record high in June, but up 14 percentage points from a year earlier.

48% of Homes Sold Over List Price in September

The average sale-to-list price ratio also dipped slightly in September to 101%, down from a record high of 102.5% in June but up from 99.4% a year earlier.

Average Sale to List Price Ratio Fell to 101% in September

Other September Highlights

Competition

Prices

Sales

Inventory

Redfin Estimate

Below are market-by-market breakdowns for prices, inventory, new listings and sales for markets with populations of 750,000 or more. For downloadable data on all of the markets Redfin tracks, visit the Redfin Data Center.

Median Sale Price

Redfin MetroMedian Sale PriceMonth-Over-MonthYear-Over-Year
Albany, NY$270,0000.0%9.1%
Allentown, PA$270,5000.2%13.9%
Anaheim, CA$900,000-0.6%15.1%
Atlanta, GA$330,0000.0%16.6%
Austin, TX$452,000-4.8%27.3%
Bakersfield, CA$328,5004.3%20.6%
Baltimore, MD$342,000-2.3%5.2%
Baton Rouge, LA$242,400-3.8%7.7%
Birmingham, AL$257,9003.2%5.3%
Boston, MA$605,000-4.0%8.0%
Bridgeport, CT$484,000-8.7%-2.2%
Buffalo, NY$217,800-3.0%15.4%
Camden, NJ$275,0000.0%17.0%
Charleston, SC$355,000-1.4%13.6%
Charlotte, NC$343,0000.0%16.3%
Chicago, IL$294,500-3.4%6.7%
Cincinnati, OH$240,000-2.4%10.6%
Cleveland, OH$185,900-7.1%6.2%
Columbus, OH$279,900-1.8%13.4%
Dallas, TX$375,000-1.1%17.2%
Dayton, OH$180,0000.6%6.5%
Denver, CO$530,0000.0%16.5%
Detroit, MI$186,0003.3%12.7%
El Paso, TX$200,000-4.3%9.3%
Elgin, IL$270,000-1.8%8.0%
Fort Lauderdale, FL$350,000-1.4%14.8%
Fort Worth, TX$315,0000.0%18.9%
Frederick, MD$480,000-4.0%8.3%
Fresno, CA$370,000-0.3%15.6%
Grand Rapids, MI$269,7001.2%10.1%
Greensboro, NC$230,0002.5%16.2%
Greenville, SC$269,500-2.2%14.2%
Hartford, CT$275,000-3.5%9.1%
Houston, TX$300,000-2.3%14.8%
Indianapolis, IN$250,0000.0%11.1%
Jacksonville, FL$310,5000.5%19.4%
Kansas City, MO$270,000-1.8%3.9%
Knoxville, TN$289,0000.2%18.0%
Lake County, IL$292,0000.7%6.2%
Las Vegas, NV$378,0000.8%19.3%
Los Angeles, CA$815,000-0.6%12.1%
Louisville, KY$240,0001.5%8.1%
McAllen, TX$203,5008.8%25.1%
Memphis, TN$245,000-1.2%1.2%
Miami, FL$406,800-0.8%14.6%
Milwaukee, WI$270,0000.0%10.2%
Minneapolis, MN$345,000-1.4%10.8%
Montgomery County, PA$390,000-3.7%8.2%
Nashville, TN$390,000-0.8%19.1%
Nassau County, NY$590,000-1.7%12.4%
New Brunswick, NJ$429,000-0.2%11.1%
New Haven, CT$275,000-2.5%5.8%
New Orleans, LA$289,4007.6%17.2%
New York, NY$650,000-3.7%13.0%
Newark, NJ$465,000-4.1%6.7%
North Port, FL$389,0003.5%29.7%
Oakland, CA$940,0000.0%13.3%
Oklahoma City, OK$226,3002.9%9.9%
Omaha, NE$250,000-2.0%8.2%
Orlando, FL$335,0000.3%18.8%
Oxnard, CA$765,500-1.2%9.4%
Philadelphia, PA$260,000-4.1%6.1%
Phoenix, AZ$417,0001.2%25.6%
Pittsburgh, PA$210,800-4.2%4.9%
Portland, OR$500,000-3.3%11.2%
Providence, RI$385,000-0.9%14.9%
Raleigh, NC$380,5001.5%20.8%
Richmond, VA$317,500-2.3%7.8%
Riverside, CA$505,0000.0%16.1%
Rochester, NY$195,000-2.5%11.4%
Sacramento, CA$550,0000.0%16.7%
Salt Lake City, UT$489,0003.6%27.8%
San Antonio, TX$297,0000.7%14.2%
San Diego, CA$760,0002.0%14.8%
San Francisco, CA$1,530,0001.3%5.5%
San Jose, CA$1,340,000-1.1%11.8%
Seattle, WA$710,900-2.6%11.8%
St. Louis, MO$230,0000.0%7.5%
Tacoma, WA$501,000-0.8%16.5%
Tampa, FL$320,0001.6%20.1%
Tucson, AZ$321,4002.1%23.1%
Tulsa, OK$225,000-2.2%5.6%
Honolulu, HI$683,500-2.4%6.5%
Virginia Beach, VA$283,000-2.4%4.8%
Warren, MI$270,000-1.7%8.9%
Washington, D.C.$480,000-2.0%5.0%
West Palm Beach, FL$365,0000.0%14.1%
Worcester, MA$371,0000.3%11.9%
National$376,800-0.8%13.9%

Homes Sold

Redfin MetroHomes SoldMonth-Over-MonthYear-Over-Year
Albany, NY1,079-11.0%-5.6%
Allentown, PA1,002-8.9%-12.6%
Anaheim, CA3,027-5.1%-9.5%
Atlanta, GA9,936-10.4%-7.7%
Austin, TX3,372-7.0%-10.3%
Bakersfield, CA826-9.1%-10.8%
Baltimore, MD4,323-8.4%-0.1%
Baton Rouge, LA1,011-1.9%-13.8%
Birmingham, AL1,643-10.9%-2.2%
Boston, MA4,975-11.4%-3.8%
Bridgeport, CT1,394-14.3%-23.5%
Buffalo, NY1,090-15.7%-9.8%
Camden, NJ1,947-8.1%-2.3%
Charleston, SC1,676-11.1%-11.6%
Charlotte, NC4,688-6.9%-2.8%
Chicago, IL9,704-14.3%-6.1%
Cincinnati, OH3,025-8.2%-7.6%
Cleveland, OH3,176-2.7%6.5%
Columbus, OH3,341-6.3%2.8%
Dallas, TX6,457-6.6%-8.1%
Dayton, OH1,2250.4%-3.2%
Denver, CO5,574-6.8%-9.2%
Detroit, MI2,097-4.9%-3.0%
El Paso, TX869-13.3%-9.1%
Elgin, IL1,247-12.9%-9.2%
Fort Lauderdale, FL3,035-14.5%-3.9%
Fort Worth, TX3,352-5.7%-5.7%
Frederick, MD1,838-11.9%-2.2%
Fresno, CA843-7.1%3.4%
Grand Rapids, MI1,408-8.3%-17.6%
Greensboro, NC1,122-2.0%9.1%
Greenville, SC1,3590.7%-2.2%
Hartford, CT1,726-10.5%-6.3%
Houston, TX9,447-8.3%0.6%
Indianapolis, IN3,711-4.2%-0.8%
Jacksonville, FL2,821-14.1%-11.5%
Kansas City, MO3,689-7.2%-4.8%
Knoxville, TN1,409-5.2%-4.7%
Lake County, IL1,455-12.2%-8.1%
Las Vegas, NV4,154-3.5%4.9%
Los Angeles, CA6,889-1.5%3.3%
Louisville, KY1,880-2.1%3.2%
McAllen, TX376-13.2%-18.4%
Memphis, TN1,256-15.8%3.7%
Miami, FL2,915-17.8%3.8%
Milwaukee, WI2,181-10.3%-7.3%
Minneapolis, MN6,391-9.8%-5.8%
Montgomery County, PA2,709-16.7%-7.3%
Nashville, TN3,692-9.1%-11.9%
Nassau County, NY2,934-12.5%-8.5%
New Brunswick, NJ3,483-12.5%-18.6%
New Haven, CT1,194-8.5%-7.5%
New Orleans, LA930-28.5%-41.7%
New York, NY7,033-21.0%25.9%
Newark, NJ2,278-20.3%-21.9%
North Port, FL2,091-3.8%-11.2%
Oakland, CA2,941-6.3%2.2%
Oklahoma City, OK2,250-11.6%-6.2%
Omaha, NE1,347-6.5%-6.5%
Orlando, FL4,613-4.6%7.8%
Oxnard, CA8760.1%-7.2%
Philadelphia, PA2,452-7.4%-6.2%
Phoenix, AZ8,8592.9%-1.8%
Pittsburgh, PA2,604-9.1%-9.4%
Portland, OR4,057-4.4%-5.7%
Providence, RI2,2121.4%-2.8%
Raleigh, NC2,401-13.2%-11.6%
Richmond, VA1,982-11.7%6.6%
Riverside, CA5,811-0.5%-4.6%
Rochester, NY1,195-13.8%-14.3%
Sacramento, CA2,954-6.6%-17.8%
Salt Lake City, UT1,515-9.9%-23.3%
San Antonio, TX3,257-8.2%-7.3%
San Diego, CA3,592-3.6%-6.7%
San Francisco, CA1,223-4.6%8.0%
San Jose, CA1,709-3.0%14.7%
Seattle, WA5,312-3.2%-1.1%
St. Louis, MO4,332-6.1%-1.3%
Tacoma, WA1,756-2.1%3.9%
Tampa, FL6,442-3.0%3.3%
Tucson, AZ1,483-3.7%-8.7%
Tulsa, OK1,610-2.6%4.1%
Honolulu, HI1,020-4.1%23.6%
Virginia Beach, VA3,051-7.7%7.7%
Warren, MI4,135-3.5%-12.5%
Washington, D.C.6,963-12.9%-9.1%
West Palm Beach, FL2,811-14.4%-13.2%
Worcester, MA1,231-5.0%3.0%
National613,2001.6%-5.4%

New Listings

Redfin MetroNew ListingsMonth-Over-MonthYear-Over-Year
Albany, NY1,118-16.6%-20.9%
Allentown, PA534-35.3%-57.3%
Anaheim, CA2,567-16.1%-27.4%
Atlanta, GA9,548-14.1%-10.4%
Austin, TX3,840-7.3%17.6%
Bakersfield, CA992-6.0%-5.7%
Baltimore, MD4,408-10.4%-8.5%
Baton Rouge, LA440-40.0%-59.0%
Birmingham, AL1,543-14.9%-13.0%
Boston, MA6,47832.2%-4.6%
Bridgeport, CT1,338-5.8%-30.7%
Buffalo, NY1,113-24.7%-22.8%
Camden, NJ1,845-14.7%-15.8%
Charleston, SC1,753-5.3%-2.2%
Charlotte, NC3,143-26.2%-36.0%
Chicago, IL10,927-7.4%-10.1%
Cincinnati, OH3,123-15.0%-7.1%
Cleveland, OH3,287-5.7%-4.2%
Columbus, OH3,305-9.7%1.3%
Dallas, TX6,655-10.0%-2.4%
Dayton, OH1,273-11.5%-7.0%
Denver, CO5,9180.3%0.4%
Detroit, MI2,561-11.5%2.2%
El Paso, TX956-5.7%-1.4%
Elgin, IL1,144-18.1%-7.7%
Fort Lauderdale, FL2,995-12.4%-25.2%
Fort Worth, TX3,415-6.8%1.9%
Frederick, MD1,9692.0%-1.3%
Fresno, CA883-9.2%-6.8%
Grand Rapids, MI1,536-5.9%-4.4%
Greensboro, NC780-24.3%-27.4%
Greenville, SC1,309-9.3%-2.7%
Hartford, CT1,788-6.4%-15.0%
Houston, TX10,080-13.5%3.0%
Indianapolis, IN3,727-7.4%-7.4%
Jacksonville, FL3,131-8.4%5.8%
Kansas City, MO3,464-12.8%-11.5%
Knoxville, TN1,203-17.2%-11.3%
Lake County, IL1,291-15.3%-12.9%
Las Vegas, NV4,416-11.4%-4.4%
Los Angeles, CA6,806-10.8%-18.9%
Louisville, KY1,997-6.6%-0.7%
McAllen, TX503-13.3%-10.5%
Memphis, TN1,260-15.7%-3.7%
Miami, FL3,908-5.9%-2.2%
Milwaukee, WI2,212-9.2%-8.0%
Minneapolis, MN6,586-8.0%-10.4%
Montgomery County, PA2,555-9.0%-13.3%
Nashville, TN3,801-0.7%-5.8%
Nassau County, NY2,986-9.8%-28.8%
New Brunswick, NJ3,491-14.7%-29.2%
New Haven, CT1,168-16.5%-23.1%
New Orleans, LA773-49.1%-49.4%
New York, NY8,7196.6%-22.6%
Newark, NJ2,464-8.4%-27.7%
North Port, FL2,169-8.2%-9.7%
Oakland, CA3,078-4.2%-3.9%
Oklahoma City, OK2,231-16.6%-2.1%
Omaha, NE1,353-0.3%-3.8%
Orlando, FL4,599-10.8%-3.6%
Oxnard, CA806-14.0%-32.4%
Philadelphia, PA2,988-2.2%-10.0%
Phoenix, AZ8,765-10.2%-12.0%
Pittsburgh, PA2,870-11.0%0.5%
Portland, OR4,150-4.0%8.3%
Providence, RI2,292-6.3%-14.3%
Raleigh, NC2,6581.3%-1.6%
Richmond, VA1,890-11.6%-10.7%
Riverside, CA6,307-5.9%-3.8%
Rochester, NY967-20.6%-31.6%
Sacramento, CA3,111-3.4%-12.8%
Salt Lake City, UT879-40.0%-51.3%
San Antonio, TX3,401-15.2%1.3%
San Diego, CA3,204-11.9%-14.4%
San Francisco, CA1,33515.4%-29.4%
San Jose, CA1,550-9.1%-11.4%
Seattle, WA5,3550.4%-6.3%
St. Louis, MO2,345-37.0%-49.0%
Tacoma, WA1,734-5.7%9.1%
Tampa, FL6,535-6.1%3.2%
Tucson, AZ1,7191.5%-6.8%
Tulsa, OK1,540-17.0%-2.4%
Honolulu, HI907-8.0%3.7%
Virginia Beach, VA2,812-15.5%-0.8%
Warren, MI4,417-14.0%-2.9%
Washington, D.C.7,7810.9%-8.0%
West Palm Beach, FL3,173-0.5%-16.1%
Worcester, MA1,3990.4%-5.7%
National631,800-2.3%-9.0%

All Homes for Sale

Redfin MetroAll Homes for SaleMonth-Over-MonthYear-Over-Year
Albany, NY3,174-7.8%-13.6%
Allentown, PA1,642-21.7%-37.7%
Anaheim, CA6,550-12.9%-35.8%
Atlanta, GA21,830-9.4%-25.2%
Austin, TX9,426-3.5%3.3%
Bakersfield, CA2,249-2.7%-8.1%
Baltimore, MD10,451-6.3%-7.1%
Baton Rouge, LA1,828-21.1%-52.6%
Birmingham, AL4,567-8.8%-21.0%
Boston, MA12,6797.5%-15.1%
Bridgeport, CT5,194-7.4%-28.5%
Buffalo, NY2,394-15.6%-21.7%
Camden, NJ4,918-8.9%-9.4%
Charleston, SC5,308-1.0%-22.8%
Charlotte, NC9,350-14.8%-36.0%
Chicago, IL31,391-4.1%-10.2%
Cincinnati, OH9,198-4.4%-5.2%
Cleveland, OH8,411-4.9%-6.7%
Columbus, OH8,690-5.3%0.3%
Dallas, TX15,451-8.6%-23.4%
Dayton, OH3,028-3.9%-4.9%
Denver, CO9,919-4.4%-14.2%
Detroit, MI6,3910.3%-1.4%
El Paso, TX2,414-7.8%-24.5%
Elgin, IL2,511-10.5%-15.5%
Fort Lauderdale, FL10,676-7.8%-35.4%
Fort Worth, TX7,741-6.9%-17.4%
Frederick, MD4,380-2.7%-2.1%
Fresno, CA1,795-4.3%-4.0%
Grand Rapids, MI2,744-4.7%-14.2%
Greensboro, NC2,081-13.4%-32.6%
Greenville, SC3,886-4.4%-19.8%
Hartford, CT5,153-5.3%-20.1%
Houston, TX27,563-5.7%-10.2%
Indianapolis, IN6,603-7.8%-17.0%
Jacksonville, FL7,444-6.1%-18.8%
Kansas City, MO8,063-7.7%-7.5%
Knoxville, TN4,084-5.3%-13.6%
Lake County, IL3,664-10.3%-17.3%
Las Vegas, NV10,634-4.2%-22.3%
Los Angeles, CA19,577-7.7%-20.5%
Louisville, KY4,468-2.4%-9.7%
McAllen, TX1,719-6.0%-19.4%
Memphis, TN3,235-10.2%-7.4%
Miami, FL15,347-4.0%-21.8%
Milwaukee, WI7,353-4.8%-1.5%
Minneapolis, MN14,368-3.7%-10.3%
Montgomery County, PA6,213-7.7%-15.6%
Nashville, TN8,502-0.8%-28.6%
Nassau County, NY9,782-5.3%-25.6%
New Brunswick, NJ10,510-5.0%-21.4%
New Haven, CT3,946-6.6%-18.9%
New Orleans, LA3,530-18.5%-25.1%
New York, NY37,536-2.0%-21.5%
Newark, NJ8,179-3.3%-18.3%
North Port, FL4,037-4.7%-42.6%
Oakland, CA5,742-4.3%-3.7%
Oklahoma City, OK5,040-7.2%-9.8%
Omaha, NE2,438-3.2%-10.6%
Orlando, FL9,513-6.8%-28.3%
Oxnard, CA2,134-6.6%-26.3%
Philadelphia, PA9,096-2.2%-6.7%
Phoenix, AZ19,636-5.8%-15.4%
Pittsburgh, PA10,328-3.3%-5.9%
Portland, OR7,948-4.1%-8.0%
Providence, RI5,668-3.7%-13.3%
Raleigh, NC5,733-3.1%-30.0%
Richmond, VA3,710-8.8%-12.5%
Riverside, CA15,342-3.1%-11.1%
Rochester, NY1,594-26.4%-46.9%
Sacramento, CA6,141-4.6%-11.9%
Salt Lake City, UT2,084-25.9%-50.3%
San Antonio, TX8,494-8.1%-16.3%
San Diego, CA6,546-11.8%-21.6%
San Francisco, CA2,9710.2%-38.0%
San Jose, CA3,057-10.4%-22.6%
Seattle, WA8,616-5.1%-21.2%
St. Louis, MO7,395-21.2%-36.4%
Tacoma, WA2,953-5.8%2.6%
Tampa, FL12,173-6.6%-20.3%
Tucson, AZ4,4231.0%-12.6%
Tulsa, OK3,327-8.0%-12.2%
Honolulu, HI3,133-6.7%-21.0%
Virginia Beach, VA6,764-10.7%-1.4%
Warren, MI10,282-4.9%-7.9%
Washington, D.C.18,884-3.2%-0.1%
West Palm Beach, FL9,665-4.2%-38.8%
Worcester, MA2,9890.2%-6.6%
National1,384,200-2.0%-19.0%

Median Off-Market Redfin Estimate

Redfin MetroEstimateMonth-Over-MonthYear-Over-Year
Albany, NY$232,7001.8%13.8%
Allentown, PA$263,7005.5%19.8%
Anaheim, CA$919,3004.7%22.2%
Atlanta, GA$301,6005.8%25.2%
Austin, TX$463,30010.5%48.9%
Bakersfield, CA$248,7007.5%21.2%
Baltimore, MD$326,5003.9%16.6%
Baton Rouge, LA$145,400-1.8%9.8%
Birmingham, AL$162,4002.8%16.0%
Boston, MA$616,9002.1%13.4%
Bridgeport, CT$462,6004.8%16.9%
Buffalo, NY$187,5004.5%19.0%
Camden, NJ$267,0006.1%23.9%
Charleston, SC$296,8005.2%20.7%
Charlotte, NC$282,7006.3%28.7%
Chicago, IL$284,300-2.5%6.0%
Cincinnati, OH$207,0005.7%20.2%
Cleveland, OH$173,3004.2%17.4%
Columbus, OH$244,9005.5%17.9%
Dallas, TX$332,4007.5%25.6%
Dayton, OH$158,5006.4%21.4%
Denver, CO$524,2007.0%22.1%
Detroit, MI$128,9003.4%19.7%
Elgin, IL$258,500-1.7%9.3%
Fort Lauderdale, FL$329,1004.3%17.0%
Fort Worth, TX$281,9007.2%23.9%
Frederick, MD$493,5003.6%15.9%
Fresno, CA$341,1007.2%25.6%
Grand Rapids, MI$237,6009.7%32.0%
Greensboro, NC$176,8005.1%23.0%
Greenville, SC$201,9006.0%21.2%
Hartford, CT$269,5007.6%18.1%
Houston, TX$248,7006.0%21.2%
Indianapolis, IN$209,8006.7%21.6%
Jacksonville, FL$275,0006.6%25.4%
Kansas City, MO$233,1007.6%22.5%
Knoxville, TN$232,0005.4%24.5%
Lake County, IL$246,800-0.2%9.8%
Las Vegas, NV$362,8005.7%24.3%
Los Angeles, CA$801,5005.0%20.5%
Louisville, KY$195,100-0.9%6.1%
Memphis, TN$184,9003.1%19.2%
Miami, FL$382,7005.6%18.7%
Milwaukee, WI$252,6005.5%16.5%
Minneapolis, MN$328,8005.2%16.0%
Montgomery County, PA$396,0004.8%18.0%
Nashville, TN$354,1007.5%23.3%
Nassau County, NY$581,2003.6%16.1%
New Brunswick, NJ$431,1005.3%21.0%
New Haven, CT$277,6007.7%21.9%
New Orleans, LA$195,700-0.5%10.8%
Newark, NJ$439,3001.9%16.1%
North Port, FL$312,7008.6%28.5%
Oakland, CA$1,002,7005.5%25.1%
Oklahoma City, OK$177,0005.7%16.8%
Omaha, NE$231,2003.6%17.1%
Orlando, FL$296,2007.5%22.2%
Oxnard, CA$754,7005.7%22.2%
Philadelphia, PA$230,8001.5%15.1%
Phoenix, AZ$396,90011.8%39.3%
Pittsburgh, PA$158,7003.2%12.8%
Portland, OR$499,4005.9%20.9%
Providence, RI$371,3004.8%20.7%
Raleigh, NC$336,9008.8%26.1%
Richmond, VA$279,6002.4%13.7%
Riverside, CA$452,6007.2%31.1%
Rochester, NY$176,5004.7%17.0%
Sacramento, CA$549,5008.0%28.3%
Salt Lake City, UT$500,40011.7%34.6%
San Antonio, TX$231,4006.9%21.5%
San Diego, CA$795,5005.4%26.1%
San Francisco, CA$1,531,9003.7%11.3%
San Jose, CA$1,436,4005.1%21.8%
Seattle, WA$724,8005.1%23.1%
St. Louis, MO$181,9005.3%10.5%
Tacoma, WA$490,2006.5%27.1%
Tampa, FL$282,4008.1%23.1%
Tucson, AZ$270,5004.8%26.6%
Tulsa, OK$155,5002.6%12.8%
Honolulu, HI$819,9003.0%16.4%
Virginia Beach, VA$273,3003.0%13.2%
Warren, MI$257,1004.2%17.0%
Washington, D.C.$476,6003.5%15.4%
West Palm Beach, FL$344,6005.8%21.4%
Worcester, MA$350,9004.9%19.9%
National$381,9007.3%19.9%

read more…

redfin.com/news/

Housing Affordability steady | North Salem Real Estate

Housing affordability held steady at its lowest level in nearly a decade, as higher home prices offset lower mortgage rates to keep the affordability rate flat in the third quarter of 2021.  In the months ahead, however, supply-chain disruptions and the prospect of higher interest rates will continue to threaten housing affordability.

According to the National Association of Home Builders (NAHB)/Wells Fargo Housing Opportunity Index (HOI), 56.6 percent of new and existing homes sold between the beginning of July and end of September were affordable to families earning the U.S. median income of $79,900. This is unchanged from the 56.6% of homes sold in the second quarter of 2021 and remains the lowest affordability level since the beginning of the revised series in the first quarter of 2012.

The HOI shows that the national median home price increased to a record $355,000 in the third quarter, up $5,000 from the second quarter and $35,000 from the first quarter. Meanwhile, average mortgage rates fell by 14 basis points in the third quarter to 2.95% from the rate of 3.09% in the second quarter. However, mortgage rates are currently running above 3.1%, and this higher trend could affect affordability later this year and into 2022.

Lansing, East Lansing, Mich. was the nation’s most affordable major housing market, defined as a metro with a population of at least 500,000. There, 89.1% of all new and existing homes sold in the third quarter were affordable to families earning the area’s median income of $79,100.

Meanwhile, Davenport-Moline-Rock Island, Iowa-Ill. was rated the nation’s most affordable smaller market, with 93.4% of homes sold in the third quarter being affordable to families earning the median income of $76,300.

For the fourth straight quarter, Los Angeles-Long Beach-Glendale, Calif., remained the nation’s least affordable major housing market. There, just 8.3% of the homes sold during the third quarter were affordable to families earning the area’s median income of $80,000.

Four of the five least affordable small housing markets were also in the Golden State. However, at the very bottom of the affordability chart was Corvallis, Ore., where 6% of all new and existing homes sold in the third quarter were affordable to families earning the area’s median income of $93,000.

Visit nahb.org/hoi  for tables, historic data and details.

read more…

eyeonhousing.org

Mortgage rates average 2.98% | Mt Kisco Real Estate

Freddie Mac (OTCQB: FMCC) today released the results of its Primary Mortgage Market Survey® (PMMS®), showing that the 30-year fixed-rate mortgage (FRM) averaged 2.98 percent.

“Despite the re-acceleration of economic growth, the recent bond rally drove mortgage rates down for the second consecutive week,” said Sam Khater, Freddie Mac’s Chief Economist. “These low mortgage rates, combined with the tailwind of first-time homebuyers entering the market, means that purchase demand will remain strong into next year. However, affordability pressures continue to be an ongoing concern for homebuyers.”

News Facts

  • 30-year fixed-rate mortgage averaged 2.98 percent with an average 0.7 point for the week ending November 10, 2021, down from last week when it averaged 3.09 percent. A year ago at this time, the 30-year FRM averaged 2.84 percent.
  • 15-year fixed-rate mortgage averaged 2.27 percent with an average 0.6 point, down from last week when it averaged 2.35 percent. A year ago at this time, the 15-year FRM averaged 2.34 percent.
  • 5-year Treasury-indexed hybrid adjustable-rate mortgage (ARM) averaged 2.53 percent with an average 0.4 point, down slightly from last week when it averaged 2.54 percent. A year ago at this time, the 5-year ARM averaged 3.11 percent.

The PMMS® is focused on conventional, conforming, fully amortizing home purchase loans for borrowers who put 20 percent down and have excellent credit. Average commitment rates should be reported along with average fees and points to reflect the total upfront cost of obtaining the mortgage. Visit the following link for the Definitions. Borrowers may still pay closing costs which are not included in the survey.

Freddie Mac makes home possible for millions of families and individuals by providing mortgage capital to lenders. Since our creation by Congress in 1970, we’ve made housing more accessible and affordable for homebuyers and renters in communities nationwide. We are building a better housing finance system for homebuyers, renters, lenders, investors and taxpayers. Learn more at FreddieMac.com, Twitter @FreddieMac and Freddie Mac’s blog FreddieMac.com/blog.