Tag Archives: Armonk NY

Armonk NY

Building material prices up 14% | Armonk Real Estate

The prices of goods used in residential construction ex-energy climbed 1.8% in November (not seasonally adjusted), according to the latest Producer Price Index (PPI) report released by the Bureau of Labor Statistics. The monthly increase was driven by price increases in nearly every product category.

Building materials prices have increased 14.1% year-to-date, more than tripling the November YTD increase of the prior year (+3.9%) and well above the average YTD increase of 1.5% between 2015 and 2020. The index has climbed 2.5% over the past two months following a 1.5% decline between July and September.

The price index of services inputs to residential construction decreased 0.8% in November, continuing a four-month trend during which the index has declined 10.1%.

Wholesale and retail trade services decreased 1.3% in November which more than offset price increases in transportation and warehousing (+1.0%) and services less trade, transportation, and warehousing (+0.3%). Nonetheless, the price index of services used in residential construction (excluding labor) is 13.5% higher than it was 12 months prior and 22.3% higher and 22.3% than the January 2020 reading.

The PPI for all inputs to residential construction–which is a weighted average of goods and services, increased 0.3% in November–has climbed 17.3% over the past 12 months, and is 22.7% higher than its pre-pandemic level.

Product Detail: Goods

Softwood Lumber

The PPI for softwood lumber (seasonally adjusted) increased 6.9% in November and has gained 16.1% since September.  Once again, as was stated in last month’s PPI post, the recent trend of mill prices—which have more than doubled since late August and are up 37% over the past four weeks—suggests that the softwood lumber PPI is headed for another sizable gain in December.

The PPI of most durable goods for a given month is largely based on prices paid for goods shipped, not ordered, in the survey month. This can result in lags relative to cash market prices during periods of long lead times.

Steel Products

Steel mill products prices rose 2.4% in November, the smallest monthly increase since May 2021. The last monthly price decrease in steel mill products occurred in August 2020, and the index has climbed 151.4% in the months since–with more than 80% of that increase taking place in 2021.

Since the inception of the steel mill products PPI, it has doubled over four non-overlapping periods which have averaged 181 months in duration.  In other words, over the last 60 years it has taken roughly 15 years for the price of steel mill products to double, on average.  Given that context, the recent pace of price increases has been incredible—it took only 11 months for steel prices to double between August 2020 and July 2021.

Ready-Mix Concrete

The PPI for ready-mix concrete (RMC) gained 0.9% in November after increasing 0.1% in October.  The index for RMC has risen 8.3% since January 2020 and 6.6% YTD—the largest year-to-date increase in November since 2005.

At the regional level, prices increased in the Northeast (+2.5%%) and Midwest (+4.7%) while prices fell in the South (-0.9%) and West (-1.1%) regions.

 Gypsum Products

In November, the PPI for gypsum products declined (-0.2%) for only the second time in 2021.  Gypsum products prices have climbed 19.8% over the past 12 months and are up 18.8% in 2021—more than quadruple the largest percentage YTD increase in November since seasonally adjusted data became available in 2012.

Paint

The PPIs for exterior and interior architectural coatings (i.e., paint) increased 1.5% and 0.2%, respectively, in November. Neither index has declined since January 2021.

The YTD price increases of architectural coatings is unprecedented with exterior and interior paint prices climbing 16.7% and 10.9%, respectively, thus far in 2021.  In contrast, November YTD price increases averaged just 2.1% for exterior paint and 1.4% for interior paint from 2013 through 2020 (the most recent data available).

Paint prices began a series of large monthly increases in the wake of the winter storm that devastated Texas earlier this year as the petrochemical industry—upon which paint manufacturing is heavily reliant—is highly concentrated in the state.

Other Building Materials

The chart below shows the 12-month and year-to-date price changes of other price indices relevant to the residential construction industry.

With the recent passage of the Infrastructure Investment and Jobs Act (a.k.a. the Bipartisan Infrastructure Bill), the construction materials index is particularly salient.  This index, which has increased 29.1% year-to-date and 40.9% since January 2020, is more heavily weighted with products used in large amounts in the production of “traditional” infrastructure (e.g., roads, bridges, rail).

Product Detail: Services

Building Materials Wholesaling and Retailing

The Producer Price Index for building materials wholesaling decreased 1.4% in November and the building materials retailing PPI declined 1.6%.  The wholesale and retail services indices measure changes in the nominal gross margins for goods sold by retailers and wholesalers. Gross profit margins of retailers, in dollar terms, have declined 22.1% since reaching an all-time high in June 2021 but remain 33.4% higher than the January 2020 level.

Building materials wholesale and retail indexes which together account for roughly two-thirds of the PPI for “inputs to residential construction, services.”

Professional Services

Professional services is the third most heavily weighted category in the service inputs to residential construction PPI.  The prices of legal, architectural, and engineering services rose 0.3%, 0.3%, and 0.2%, respectively, in November. Although the year-to-date increase in prices of professional services used in residential construction are quite modest compared to that of materials, prices have increased more in 2021 than they had by November 2020; the difference is especially striking for engineering and architectural services.

Although the difference in YTD price changes for legal services is small, the percentage increases are relatively large.  This follows with a trend in recent years.  Since November 2018, the price of legal services has risen 13.2%–much higher than the three-year increase in architectural (+1.7%) and engineering services (+5.9%).

Metal Treatment Services

Prices of metal treatment services increased 0.7%, on average, in November.  The subset of these services used to calculate the services inputs to residential construction includes plating and polishing, coating and allied services, and heat treating.  Metal coating and allied services have increased the most— +14.1% (NSA)—since the start of 2021.  Metal heat treating and plating and polishing services have increased 5.4% and 2.0%, respectively, year-to-date.  The average price increase of the three services averaged 0.1% over the course of 2020.

read more…

eyeonhousing.org

Mortgage lenders loosened credit standards | Chappaqua Real Estate

Numbers are consistent with an uptick in mortgage rates and a downturn in applications.

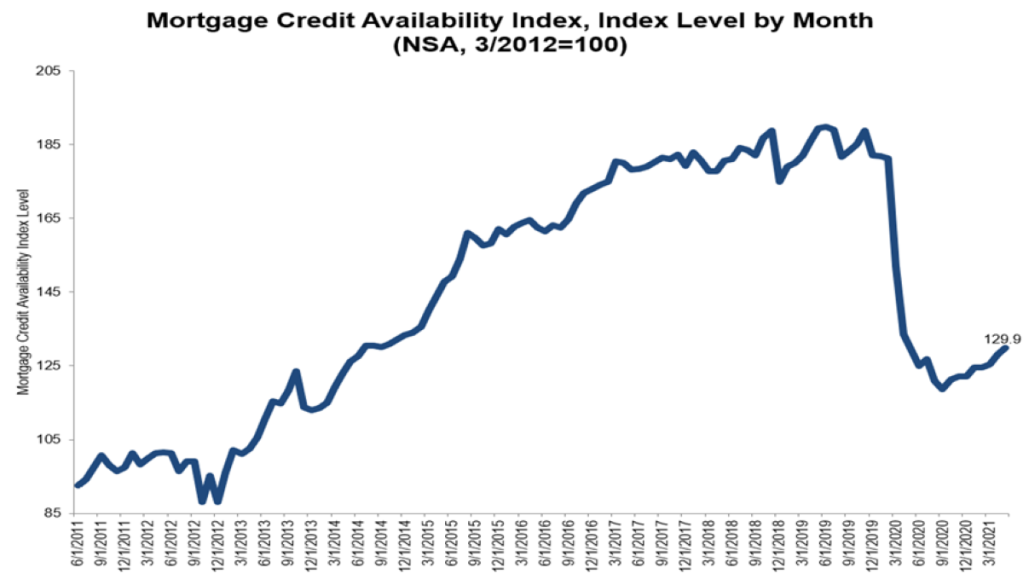
Mortgage credit availability increased by 1.4% in May – a sign that volume-hungry lenders continued to loosen credit standards in a highly competitive market, according to Thursday data from the Mortgage Bankers Association.

MBA’s Mortgage Credit Availability Index (MCAI) which uses 100 as a benchmark — increased to 129.9 in May. A decline in the MCAI suggests that lending standards are tightening while a higher number suggests loosening credit standards.

Lenders concerned over borrowers’ ability to pay their bills at the beginning of the economic shutdown resulted in an exponential tightening of credit. However, May’s credit availability inched to its highest level since the early days of the pandemic, but remained at 2014 levels.

The MCAI on conventional loans increased 3.5%, while MCAI on government loans increased by 0.3%. Of the two component indices of the conventional MCAI, the jumbo MCAI increased by 5.1%, and the conforming MCAI rose by 1.6%, the MBA said.

MCAI-May

“The overall increases were driven by a 3% gain in the conventional segment of the market, with a rise in the supply of ARMs and cash-out refinances,” said Joel Kan, MBA’s associate vice president of economic and industry forecasting.

Borrowers are “stuck in the middle” between the agencies’ minimum FICO requirements and the “FICO gates” imposed by lenders’ credit overlays. We have the tools to help them, we just need to use them. 

According to Kan, this is consistent with the uptick in mortgage rates and a slowing refinance market, as well as MBA’s Weekly Applications Survey data showing increased interest in ARMs. Monday data from the MBA revealed mortgage applications dropped for the third consecutive week.

Compared to last year, fewer people are applying for purchase mortgages – a likely result of home prices continuing to rise and prospective buyers avoiding astronomical bidding wars.

However, housing demand is still far outpacing supply, Kan said. The average loan size on a purchase application edged down to $407,000, below the record $418,000 set in February — but still far above 2020’s average of $353,900, the MBA reported.

“The jumbo index also jumped 5% last month, but even with increases over the past two months, the index is still around half of where it was in February 2020,” Kan said. “A rapidly improving economy and job market has freed up jumbo credit, as banks have deposits to utilize. However, there is still plenty of restraint, as many sectors have not fully returned to pre-pandemic capacity, and there are around 2 million borrowers still in forbearance.”

At this time last year, the Jumbo loan index was 54% lower than it had been in February 2020. Securing a jumbo loan was the most difficult it had been in four years, according to MBA data. But a flourishing housing market gave way to jumbos from a host of lenders, including Rocket Mortgage and United Wholesale Mortgage.

read more…

housingwire.com/articles/

NYC rental market tumbles down | Armonk Real Estate

New York apartment leases plunged last month as coronavirus stay-at-home orders kept the city’s renters from moving.

In Manhattan, new agreements fell 38% in March from a year earlier, the second-biggest decline in 11 years of record-keeping by appraiser Miller Samuel Inc. and brokerage Douglas Elliman Real Estate. In Brooklyn and Queens, signings were down 46% and 34%, respectively, the firms said in a report Thursday.

Restrictions on gatherings have made in-person showings illegal, and landlords, worried about units going vacant during a recession, did what they could to retain current tenants.

“Well, what are you going to do?” said Jonathan Miller, president of Miller Samuel. “Tenants can’t really look at new apartments other than virtually. And then they’d have to move, and moving has become one of the biggest problems because many buildings are restricting or prohibiting moving trucks.”

New leases that were signed set price records — a vestige of the overheated demand that existed before the pandemic as would-be buyers sat out a sluggish sales market.

Rents for the smallest apartments reached new highs in both Manhattan and Brooklyn. The monthly median for studios in Manhattan jumped 9.3% to $2,843, while one-bedroom costs climbed 4.4% to $3,650.

Brooklyn studios and one-bedrooms rented for a median of $2,700 and $2,995, respectively.

Those gains aren’t likely to continue. A prolonged economic shutdown costing thousands of jobs will leave many tenants unable to pay rent and fewer people seeking to move to new apartments in the city.

“There’s going to be downward pressure on rents going forward,” Miller said.

read more….

blommberg.com/news/articles

#Delinquency Rates Point to Continued Healing | Armonk Real Estate

Following a surprising, but small, increase in the percent of 1-4 family first-lien mortgages that were either 90 or more days delinquent or were in the process of foreclosure over the fourth quarter of 2016, the Mortgage Bankers Association reported that the measure continued its descent in the first quarter of 2017. This measure of delinquency, at least for conforming loans, is declining for both borrowers with a credit score below 660 and borrowers at or above it. Moreover, the gap in rate of delinquency for the two categories of borrowers is shrinking.

After rising by 10 basis points to 1.8 percent over the fourth quarter of 2016, the proportion of all mortgages either 90 or more days delinquent or in the foreclosure process fell by 10 basis points over the first quarter of 2017, currently sitting at 1.7 percent. The proportion of mortgages either 90 or more days past due or in the foreclosure process is highest for FHA-insured mortgages, 2.6 percent, and lower for both VA and Conventional loans.

However, at 2.6 percent, this measure of delinquency is below its 2005-2008 average of 4.1 percent. Similarly the current level of 90 or more day delinquency or entering the foreclosure process for VA loans is also below its average in the three years prior to the most recent recession. However, despite a rate below the overall percentage, conventional loans either 90 or more days delinquent or starting the foreclosure process remains 20 basis points above its 2005-2007 average level, 1.3 percent.

The Federal Housing Finance Agency, which oversees the government-sponsored entities (GSEs), Fannie Mae and Freddie Mac, provides estimations of loans purchased by the GSEs that become 90 or more days delinquent or start the foreclosure process*. This information is also provided by credit score, scores under 660 and those above or equal to 660. However, the series does not begin until 2009.

Overall, the proportion of mortgages 90 or more days past due or starting the foreclosure process has declined since its 2010 peak level. The declines have taken place for both mortgages loans obtained by borrowers with a credit score below 660 and borrowers with a credit score above 660. Currently, 4.6 percent of borrowers with a credit score below 660, the proportion of mortgage loans either 90 or more days delinquent or in the process of foreclosure, 8.3 percentage points less than its peak. The 0.8 percent of borrowers with a credit score at or above 660 with this kind of delinquency rate is 2.7 percentage points below its peak level, 3.5 percent.

Although the 90 or more day delinquency and foreclosure started rate for borrowers in both credit score categories is declining, the rate of decrease for borrowers with less than a 660 credit score is falling faster. As a result, the gap between these delinquency rates is shrinking. The figure above shows that at its peak in 2009 and 2010, the percent of borrowers with less than a 660 had a 90 or more day delinquency and foreclosure started rate that was 8 percentage points above the rate for borrowers with a credit score at or above 660. This gap has now shrunk to 3.4 percentage points.

Specifically, the data for 90 or more days delinquent is calculated as the residual between the percent of loans 60 or more days delinquent and the portion 60-89 days past due.

The definitions for the FHFA components are as follows:

60-plus-days Delinquent – Loans that are two or more payments delinquent, including loans in relief, in the process of foreclosure, or in the process of bankruptcy, i.e., total servicing minus current and performing, and 30 to 59 days delinquent loans. Our calculation may exclude loans in bankruptcy process that are less than 60 days delinquent.

60-89 Days Delinquent – Includes loans that are only two payments delinquent.

Serious Delinquency – All loans in the process of foreclosure plus loans that are three or more payments delinquent (including loans in the process of bankruptcy).

The definition of serious delinquency in the FHFA data likely differs from the MBA definition of “seriously delinquent” provided below.


read more….

http://eyeonhousing.org/2017/05/trends-in-delinquency-rates-point-to-continued-healing/

Rising Rents are Backfiring | Armonk Real Estate

A new survey by Freddie Mac finds that soaring rents are not turning renters into homeowners, but actually delaying homeownership for many.

Of those who experienced a rent increase in the past two years, 70 percent would like to buy a home but cannot afford to at this point. Half (51 percent) said that they now have to put off their plans to purchase a home. Some 44 percent indicated they’d like to buy a home and have started looking.

“We’ve found that rising rents do not appear to be playing a significant role in motivating renters to buy a home,” said David Brickman, EVP of Freddie Mac Multifamily. “This contradicts what some in the housing market think as they expect more renters ought to be actively looking to purchase a home. We believe rising rents are primarily a sign dsof increased demand rather than a signal that home purchases will be increasing.”

Brickman added, “Growth in the number of renter households is occurring amid an improving job market and economy. The demand for rental housing is increasing and an estimated 440,000 new apartment units are needed each year to keep up with demand.”

Rents rose 3.6 percent in 2014 and are expected to rise 3.4 percent above inflation this year. More than one-third of U.S. households now rent their homes, and renters account for all net new household growth over the last several years, according to the U.S. Census Bureau.

More than a third (38 percent) of renters who have lived in their home two years or more experienced a rent increase in the last two years, while 6 percent experienced a decrease.

A third of renters in the survey are very satisfied with their rental experience and another 30 percent indicate they are moderately satisfied.  The top favorable factors about renting are freedom from home maintenance, more flexibility over where you live and protection against declines in home prices.

Moreover, the results show some shared positive views across generations with no significant differences between Millennial, Generation X or Baby Boomer renters in their views that renting provides flexibility over where you live and protection against home price decline.


read more…


http://www.realestateeconomywatch.com/2015/05/

NAHB Completes Landmark 800th Local Impact Study | #Armonk Real Estate

n January, NAHB produced a study on the impact of home building in the nine-county Kansas City metropolitan area.  Like earlier studies, the one for Kansas City estimated the income, jobs and taxes generated by home building activity in the area.  However, the Kansas City study is especially notable because it marks the 800th such customized report NAHB has produced for various metropolitan areas, non-metropolitan counties, and states across the country since first offering this service late in 1996.

The map below illustrates the parts of the country covered by the 800 customized NAHB local impact studies.  The darker green shading indicates studies covering metro areas or non-metro counties; the somewhat lighter orange shading indicates studies produced for an entire state.

NAHB 800

Although a local market area analyzed by NAHB must be large enough to include places where construction workers live, and places where the new home occupants work and shop (most often, a metropolitan area or non-metropolitan county), the construction analyzed can be confined to a particular jurisdiction or development.  Over the years, the studies have been used to help get individual projects approved, counter anti-growth proposals, and generate publicity for the local home building industry.

A customized report can be ordered by anyone willing to pay the fee and provide the inputs needed to run the NAHB model.  For those lacking the time or resources, a study showing results for a typical or average local area is available immediately on line.

For example, this study shows that the estimated one-year local impacts of building 100 single-family homes in a typical metro area include

  • $21.1 million in local income,
  • $2.2 million in taxes and other revenue for local governments, and
  • 324 local jobs.

And that the additional, annually recurring impacts resulting from the 100 single-family homes becoming occupied and the occupants paying taxes and otherwise participated in the local economy  include

  • $3.1 million in local income,
  • $743,000 in taxes and other revenue for local governments, and
  • 53 local jobs.

The typical local area report, along with instructions for ordering customized reports for a particular area,  are available on NAHB’s local impact of home building web page.   Readers are urged to check back periodically, as NAHB anticipates updating the information for a typical local area within the next two months.   Readers with questions about the local impact estimates or how they’re generated may contact Paul Emrath in NAHB’s Housing Policy Department.


read more….


http://eyeonhousing.org/2015/03/nahb-completes-landmark-800th-local-impact-study/

10 Advantages of the Humble Ranch House | Armonk Homes

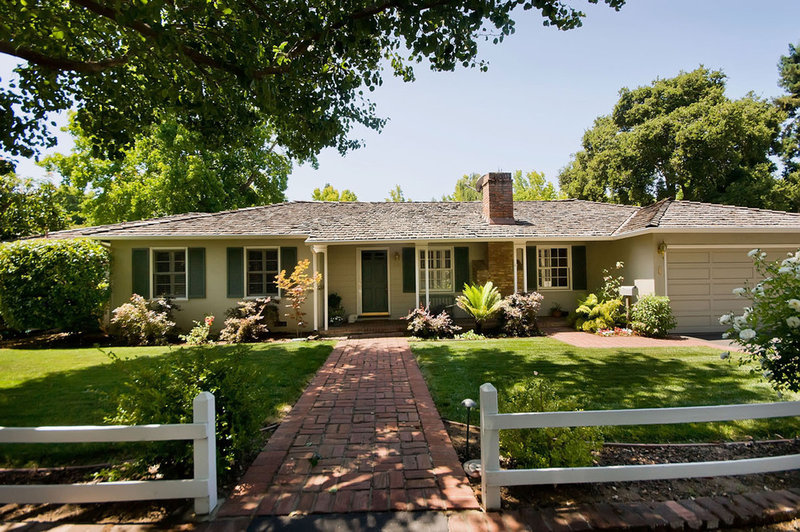
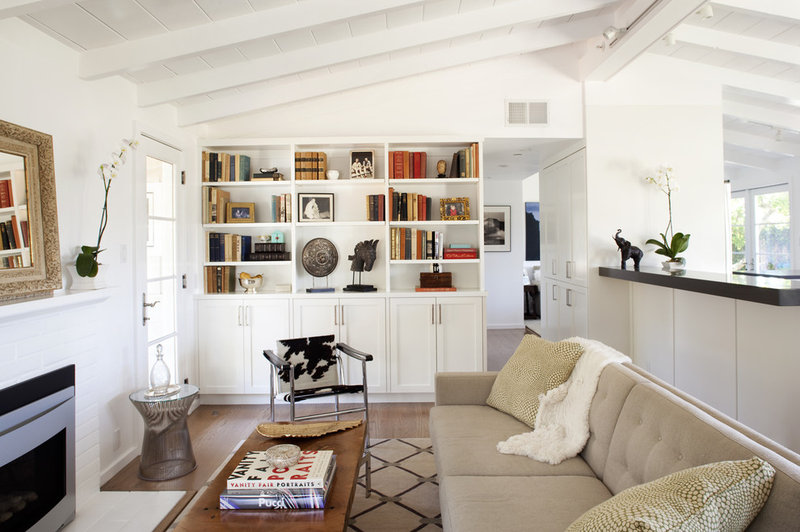
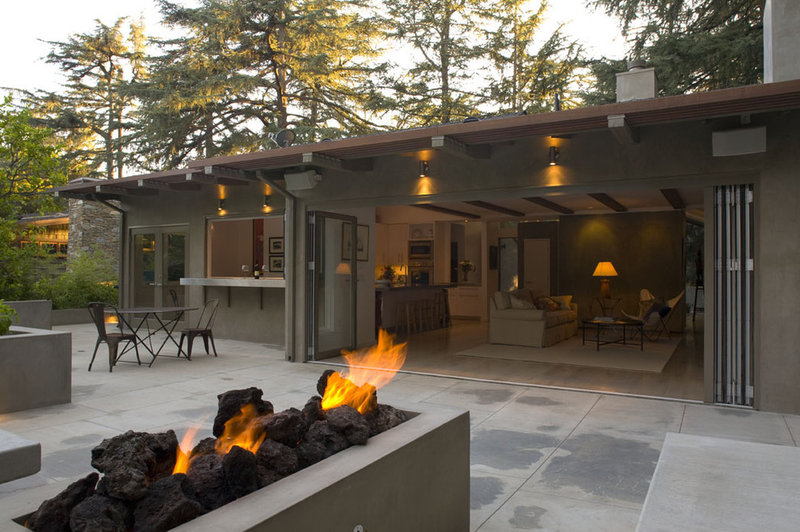
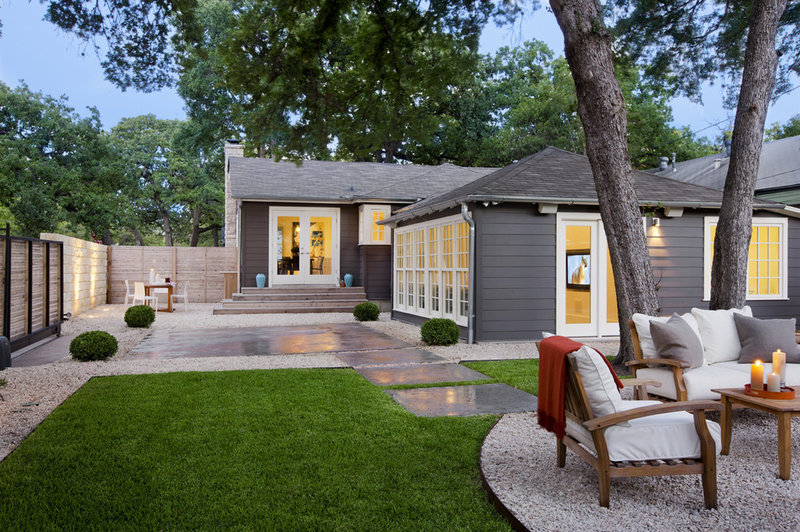
Since falling from favor in the 1970s, the ranch house has languished on the bottom rung of the architectural food chain. Critics deride its small size, dated finishes and prosaic design. But if you’re able to see past such shortcomings, the ranch (or rambler, as it’s sometimes known) has a lot to offer potential home buyers — particularly those on a budget.

Popularized in the 1950s by architectural designer and developer Cliff May, the ranch celebrated the postwar profusion of cheap land and sprawling suburbs, with a horizontal footprint that turned its back on the streetscape to focus on backyard living.

While May’s original designs showed great finesse, the ranch was copied so often — and so poorly — that eventually the style became associated with cheap tract-house living. Which is a shame, because ranch houses can be an affordable, efficient option that’s compatible with today’s lifestyles and needs.Below you’ll find some of their advantages, along with ideas for working with ranch homes.

Mianus River Gorge To Buy 73-Acre North Castle Site For $2.8M | Armonk Real Estate

Mianus River Gorge will acquire a 73-acre parcel in North Castle for $2.8 million, according to Rod Christie, the preserve’s executive director. The purchase is expected to close in the coming months.

The property, which is located at 99 E. Middle Patent Road, is co-owned by Hope Levene and her relatives, according to Christie.

Levene, a 93-year-old Bedford resident who formerly lived in North Castle, has a long local history. In a July interview that focused on her decades of six decades of volunteerism at Northern Westchester Hospital (NWH), she discussed the various roles she had over her lifetime. They included serving as the only trustee of a small school district that included a 1-room schoolhouse, and later as a Bedford Central school board member. Levene has also been involved with Twigs, a thrift store that supports NWH.

Christie noted that Levene used to serve on his organization’s board. He appeared before the North Castle Town Board on Monday evening at a special meeting. The Town Board voted to authorize Supervisor Michael Schiliro to sign a conservation easement, which will cost $500,000

The easement, which will cover 68 of the site’s acres, will be paid for by using open-space funding. It was disclosed at the meeting that the funding stems from a 2004 voter referendum that authorized the town to bond up to $3 million for acquiring open space and for conservation easements.

The Town Board voted on Monday because town’s ability to utilize the bond expired after 10 years, according to Schiliro. Monday was the expiration date because it was the next business day,


read more…


http://armonk.dailyvoice.com/news/mianus-river-gorge-buy-73-acre-north-castle-site-28m

Tankless Water Heaters | Armonk Homes

Several months after my husband and I and our two kids moved from the US to a space-efficient flat in London, I dragged our contractor into the back of one of our bathrooms to show him a strange, small silver box mounted on the wall and asked if he could remove it. “Not a good idea,” he said. “It’s your water heater.”

Long favored in Japan and Europe where square footage is at a premium, tankless water heaters provide hot water on demand when you need it. According to the EPA, residential electric water heaters are the second highest energy users in American households: “The energy consumed by your refrigerator, dishwasher, clothes washer, and dryer combined use less energy than your current standard water heater.” Tankless water heaters offer big savings in energy use and space. The question is: Can these little units cater to the water heating needs of larger homes? Read our primer to find out if a tankless water heater should be on your house remodeling or tank replacement short list.

Michaelis Boyd Architects Bathroom, Remodelista

Michaelis Boyd Architects Bathroom, Remodelista

Above: A London bathroom by Michaelis Boyd Architects.

With the help of a demure tankless water heater that barely took up any space in our London flat, four of us bathed, showered, washed clothes, and otherwise ran hot water without ever experiencing shortages or wars over water pressure.

What is a tankless water heater and how does is work?

Unlike standard water heaters that keep water hot and ready for use at all times in insulated 20- to 80-gallon tanks, tankless models don’t store hot water, they heat on demand. When a hot water tap is turned on, cold water runs through a pipe into the unit where a flow sensor turns on a gas burner or an electric element to heat the water to the desired temperature. When the hot water tap is closed, the flow sensor turns off the burner.

Tankless Water Heater Diagram, Remodelista

Tankless Water Heater Diagram, Remodelista

Above: The inner workings of a gas-powered tankless water heater. Image via Better Water Heaters.

How are tankless water heaters powered?

Tankless water heaters can be fueled by gas (natural or propane) or electricity. Gas-powered units require venting (just like standard tank heaters). Most gas models also have electronic controls, so an electric outlet is needed. Full electric tankless heaters don’t need venting but have minimum voltage and AMP requirements—consult a professional to be sure your power is adequate.

Steibel Tempra Plus Electric Tankless Water Heater, Remodelista

Steibel Tempra Plus Electric Tankless Water Heater, Remodelista

Above: The Steibel Tempra Plus Whole-House Electric Tankless Water Heater doesn’t require venting, which allows for location flexibility.

Are there different types of tankless water heaters?

Two types of heaters are generally offered: whole house and point of use. Whole-house systems are powerful enough to generate hot water at flow rates to serve a household. Point-of-use units have low flow rates and are designed to supply hot water for a single appliance or location. These compact contraptions are typically installed directly adjacent to wherever they’re needed, such as under a sink; they’re most often used to augment a system when instant or additional hot water is needed.

How much hot water can a tankless heater generate?

Unlike standard water heaters, which draw on reserves, tankless water heaters provide a continuous supply of hot water. Sound too good to be true? Well, sort of. While the stream of hot water is unlimited, tankless models can only heat and deliver water at a certain flow rate. That output, or capacity, is measured in gallons per minute (gpm). So, while a tankless water heater won’t “run out” of hot water like a storage tank can, there may be an issue of not being able to pump out enough hot water for multiple uses at the same time. 

read more…

https://homes.yahoo.com/news/remodeling-101-tankless-water-heaters-090000458.html

$3.5M Buys a Wright Student’s Spiky, ‘Zen-Like’ 1985 Design | Armonk Real Estate

25 images

Location: Armonk, N.Y.
Price: $3,500,000
The Skinny: A 1985 home in Armonk, N.Y., by Frank Lloyd Wright student Roy Johnson has been on the market since June with a $3.5M asking price. “Paradise is found” there, suggests the listing, in its 6,093 square feet and the surrounding “zen-like” six-acre plot, which features a “fully stocked koi pond, relaxing waterfall, stone paths,” a “fully enclosed raised vegetable garden perfect for farm to table dining,” and a trellised pavilion whose emphatic, spikey silhouette mimics that of the house. Inside the dwelling, there’s an expansive double-height living room, a “renovated Bilotta kitchen” lit by large windows, and five bedrooms, filling out a circular plan around a central stone column.


read more….


http://curbed.com/archives/2014/10/29/roy-johnson-armonk-for-sale.php