As rising mortgage rates continue to cool the housing market, the volume of existing home sales has declined for eight consecutive months as of September, according to the National Association of Realtors (NAR). The average 30-year fixed mortgage interest rate has increased from 3.11% at the start of the year to 6.9% this week, the highest level since April 2002, making housing less affordable. However, home price appreciation slowed for the third month after reaching a record high of $413,800 in June.
Total existing home sales, including single-family homes, townhomes, condominiums and co-ops, fell 1.5% to a seasonally adjusted annual rate of 4.71 million in September, the lowest pace since September 2012 with the exception of April and May 2020. On a year-over-year basis, sales were 23.8% lower than a year ago.
The first-time buyer share stayed at 29% in September, consistent with August 2022 and slightly higher than 28% from September 2021. The September inventory level fell from 1.28 to 1.25 million units and was lower than 1.26 million from a year ago.
At the current sales rate, September unsold inventory sits at a 3.2-month supply, unchanged from last month and higher than the 2.4-months reading from a year ago.
Homes stayed on the market for an average of just 19 days in September, up from 16 days in August and 17 days in September 2021. In September, 70% of homes sold were on the market for less than a month.
The September all-cash sales share was 22% of transactions, down from 24% last month and 23% a year ago.
The September median sales price of all existing homes was $384,800, up 8.4% from a year ago, representing the 127th consecutive month of year-over-year increases, the longest-running streak on record. The median existing condominium/co-op price of $331,700 in September was up 9.8% from a year ago.
Geographically, three regions saw a decline in existing home sales in September, ranging from 1.6% in the Northeast to 1.9% in the South. Sales in the West remained unchanged in September. On a year-over-year basis, all four regions saw a double-digit decline in sales, ranging from 18.7% in the Northeast to 31.3% in the West.
The Pending Home Sales Index (PHSI) is a forward-looking indicator based on signed contracts. The PHSI fell 2.0% from 90.2 to 88.4 in August. On a year-over-year basis, pending sales were 24.2% lower than a year ago per the NAR data.
The prices of goods used in residential construction climbed 1.5% in June (not seasonally adjusted) even as softwood lumber prices fell 23%, according to the latest Producer Price Index (PPI) report. Prices have surged 41.7% since January 2020. Building materials (i.e., goods inputs to residential construction, less energy) prices have increased 4.8%, year-to-date, and are 12.2% higher than they were in June 2021.
The price index of services inputs to residential construction was driven 2.1% lower in June after a 2.0% decline in May (revised) by decreases in the building materials retail and wholesale trade indices. The services PPI is 0.1% lower than it was 12 months prior and 37.6% higher than its pre-pandemic level.
Softwood Lumber
The PPI for softwood lumber (seasonally adjusted) fell sharply (-22.6%) in June, its second such decline in three months. Prices have fallen 35.0% since March 2022, although the extent to which the decrease has reached home builders and remodelers is unclear.
Since early 2020, softwood lumber prices have been extraordinarily volatile. The average monthly change in the PPI for softwood lumber has been 2.6% since January 2020, nearly nine times the average change (+0.3%) from 1947 to 2020. The volatility of softwood lumber prices has exhibited the same pattern relative to the “all commodities” PPI. While lumber prices were 19.7% more volatile over the 1947-2020 period, they have been 100.1% more volatile than the broader index since January 2020.
Ready-Mix Concrete
The PPI for ready-mix concrete (RMC) gained 1.9% in June following increases in May (+0.8%) and April (+1.1%). The index has climbed 5.1%, year-to-date, and 11.3% over the past 12 months. Over the two decades beginning January 2000, the price of RMC moved more than 1% in 24 of 240 survey months. It has increased/decreased more than 1% in seven of the 30 months since, including three times through the first half of 2022.
Price changes were broad based geographically but increased the most in the Northeast where they rose 6.3% in June. Prices also increased in the South (+0.9%), Midwest (+1.6%), and West (+1.0%). Although prices are higher than pre-pandemic levels in all regions, the variance of increases across regions is quite large, ranging from 10.6% in the Midwest to 23.2% in the West.
Gypsum Products
The PPI for gypsum products increased 0.1% in June after surging 7.1% in May. and has soared 22.6% over the past year. After a quiet 2020, the price of gypsum products climbed 23.0% in 2021 and is up 7.6% through the first half of 2022.
Steel Products
Steel mill products prices decreased 1.8% in June after increasing 13.6% over the two prior months. 10.7%. Although prices are 6.5% below their all-time high (reached in December 2021), they are twice January 2021 levels.
Paint
The PPI for architectural coatings (i.e., paint) was flat over the month as the price of exterior paint gained 0.1% and that of interior paint did not change. The PPI for paint has not declined since January 2021—the prices of exterior and interior paint have risen 49.3% and 33.2%, respectively, in the months since.
Transportation of Freight
The price of truck transportation of freight decreased 0.4% in June, the first monthly decline since May 2020. Since then, the indices for local and long-distance motor carrying prices are up 31.0%% and 46.5%, respectively.
Water transportation costs declined 1.5% in June after increasing 21.6% over the prior two months. Deep sea (i.e., ocean) transportation of freight prices—which are 27.2% higher than they were in March—have accounted for most of the three-month increase as the category accounts for over half of the water transportation PPI. The price of deep sea water freight has climbed 57.8% since the spring of 2020.
Not only have freight costs increased, but the prices of services to arrange freight logistics have climbed steeply as well. Over the course of 2021, the PPI for the arrangement of freight and cargo increased 95.1%. Although prices have fallen nearly 12%, YTD, they remain 57.5% above pre-pandemic levels.
Other Building Materials
The chart below shows the 12-month and year-to-date price changes of other price indices relevant to the residential construction industry.
Surging home pricesand mortgage rates cut housing affordability by 29% over the last year, as measured by the National Association of Realtors.
It’s the sharpest year-over-year decline in affordability on record.
Why it matters: The cost of housing is a major source of irritation for the American public after two years of pandemic restrictions and persistent inflation.
A separate report from housing market research firm Black Knight published yesterday shows that the monthly principal and interest payment on an average-priced home, by a buyer who puts 20% down, has gone up by roughly $600 —44% — since the start of the year.
How it works: The drop in affordability is being driven by two components.
Surging house prices: One popular gauge of home prices known as the Case-Shiller index showed home prices posting their biggest ever year-on-year gain in March when they rose 20.6%.
Surging mortgage rates: Over the last year, the rate for a conventional 30-year fixed-rate mortgage has jumped from 3% to more than 5%.
What they’re saying: “Given 2022’s affordability collapse, these [home price appreciation] levels likely are at or near the peaks for this cycle. Key question is how much and how quickly they will decline,” Bank of America analysts wrote in a research note published on Friday.
A real estate firm seeks to block a new Oregon law that bans real estate agents from forwarding “love letters” from homebuyers to sellers.
A lawsuit filed in federal court Friday by the conservative Pacific Legal Foundation on behalf of Total Real Estate Group alleges the state’s ban on these communications violates the First Amendment rights of real estate brokers and their clients.
“This censorship is based on mere speculation that sellers might sometimes rely on information in these letters to discriminate based on a protected class,” according to the lawsuit.
Oregon Attorney General Ellen Rosenblum and Oregon Real Estate Commissioner Steve Strode could not be reached for comment.
Oregon is the first state to ban the practice. Under the law, which is scheduled to take effect in January, real estate agents will not be allowed to pass along personal pitches from buyers that can include details about people’s lives along with photographs and videos. Buyers will still be allowed to communicate directly with home sellers.
In hot markets where multiple bidders jockey for the same house, buyers will do just about anything to get their offer noticed – and that includes writing “love letters” in hopes of making a personal connection with a seller.
Increasingly, the real industry has grown uneasy that “love letters” could violate state and federal fair housing laws by revealing the buyer’s race, color, religion, sex, sexual orientation, national origin, marital status or familial status. Many real estate agents refuse to accept or deliver them.
Democratic Rep. Mark Meek, the state lawmaker who sponsored the legislation, told USA TODAY in August that Oregon is not impeding free speech.
“We are limiting transmission of communications that are not relevant and could potentially be breaking fair housing laws,” he said.
No other state has followed Oregon’s lead.
Daniel Ortner, an attorney with the Pacific Legal Foundation, said the law is “a blatant First Amendment violation.”
“Love letters” can help first-time buyers compete with cash-rich buyers or institutional investors and can help sellers searching for buyers who will care for their homes and be good neighbors, Ortner said. The letters signal genuine interest in a property, he said.
Ortner said the law’s proponents have not produced any examples of fair housing complaints or lawsuits as a result of love letters.
“This is a solution in search of a problem. There is no evidence that it is a real problem that’s really resulting in discrimination,” he said. “And you can’t just go and ban whole types of communication in the fear that some small portion of it might somehow be used by someone.”
The backlash against love letters is part of an industrywide reckoning with its complicity in decades of housing discrimination and segregation that kept Black Americans from homeownership.
In 2019, Newsday published the findings of a three-year undercover investigation that exposed discriminatory home-selling practices by real estate agents that helped keep neighborhoods in Long Island, New York, segregated. Agents treated people of color unequally, especially Black residents, the investigation found.
Efforts to reform racist practices and increase Black homeownership intensified after the murder of George Floyd in Minneapolis.
Last year, the National Association of Realtors warned members love letters were not as harmless as they seemed.
But as stratospheric prices and record low housing inventory fuel bidding wars, love letters are more popular than ever.
Realtors said they don’t want to put their buyers at a disadvantage in competitive situations by refusing to pass them along. Besides, they said, sellers are swayed first and foremost by the offering price and terms.
But the right words can be persuasive. In 2019, the Redfin real estate brokerage studied the most effective strategies to win a bidding war. All-cash offers more than tripled a buyer’s odds. Writing a love letter came in second, increasing a buyer’s chances by 59%.
S&P Dow Jones Indices (S&P DJI) today released the latest results for the S&P CoreLogic Case-Shiller Indices, the leading measure of U.S. home prices. Data released today for July 2021 show that home prices continue to increase across the U.S. More than 27 years of history are available for the data series and can be accessed in full by going to https://www.spglobal.com/spdji/.
YEAR-OVER-YEAR
The S&P CoreLogic Case-Shiller U.S. National Home Price NSA Index, covering all nine U.S. census divisions, reported a 19.7% annual gain in July, up from 18.7% in the previous month. The 10-City Composite annual increase came in at 19.1%, up from 18.5% in the previous month. The 20-City Composite posted a 19.9% year-over-year gain, up from 19.1% in the previous month.
Phoenix, San Diego, and Seattle reported the highest year-over-year gains among the 20 cities in July. Phoenix led the way with a 32.4% year-over-year price increase, followed by San Diego with a 27.8% increase and Seattle with a 25.5% increase. Seventeen of the 20 cities reported higher price increases in the year ending July 2021 versus the year ending June 2021.
MONTH-OVER-MONTH
Before seasonal adjustment, the U.S. National Index posted an 1.6% month-over-month increase in July, while the 10-City and 20-City Composites both posted increases of 1.3% and 1.5%, respectively.
After seasonal adjustment, the U.S. National Index posted a month-over-month increase of 1.5%, and the 10-City and 20-City Composites both posted increases of 1.4% and 1.5%, respectively. In July, all 20 cities reported increases before and after seasonal adjustments.
ANALYSIS
“July 2021 is the fourth consecutive month in which the growth rate of housing prices set a record,” says Craig J. Lazzara, Managing Director and Global Head of Index Investment Strategy at S&P DJI. “The National Composite Index marked its fourteenth consecutive month of accelerating prices with a 19.7% gain from year-ago levels, up from 18.7% in June and 16.9% in May. This acceleration is also reflected in the 10- and 20-City Composites (up 19.1% and 19.9%, respectively). The last several months have been extraordinary not only in the level of price gains, but in the consistency of gains across the country. In July, all 20 cities rose, and 17 gained more in the 12 months ended in July than they had gained in the 12 months ended in June. Home prices in 19 of our 20 cities now stand at all-time highs, with the sole outlier (Chicago) only 0.3% below its 2006 peak. The National Composite, as well as the 10- and 20-City indices, are likewise at their all-time highs.
“July’s 19.7% price gain for the National Composite is the highest reading in more than 30 years of S&P CoreLogic Case-Shiller data. This month, New York joined Boston, Charlotte, Cleveland, Dallas, Denver, and Seattle in recording their all-time highest 12-month gains. Price gains in all 20 cities were in the top quintile of historical performance; in 15 cities, price gains were in the top five percent of historical performance.
“We have previously suggested that the strength in the U.S. housing market is being driven in part by a reaction to the COVID pandemic, as potential buyers move from urban apartments to suburban homes. July’s data are consistent with this hypothesis. This demand surge may simply represent an acceleration of purchases that would have occurred anyway over the next several years. Alternatively, there may have been a secular change in locational preferences, leading to a permanent shift in the demand curve for housing. More time and data will be required to analyze this question.
“Phoenix’s 32.4% increase led all cities for the 26th consecutive month, with San Diego (+27.8%) and Seattle (+25.5%) not far behind. As has been the case for the last several months, prices were strongest in the Southwest (+24.2%) and West (+23.7%), but every region logged double-digit gains and recorded all-time high rate increases.”
SUPPORTING DATA
Table 1 below shows the housing boom/bust peaks and troughs for the three composites along with the current levels and percentage changes from the peaks and troughs.
2006 Peak
2012 Trough
Current
Index
Level
Date
Level
Date
From Peak (%)
Level
From Trough (%)
From Peak (%)
National
184.61
Jul-06
134.00
Feb-12
-27.4%
265.35
98.0%
43.7%
20-City
206.52
Jul-06
134.07
Mar-12
-35.1%
272.34
103.1%
31.9%
10-City
226.29
Jun-06
146.45
Mar-12
-35.3%
284.74
94.4%
25.8%
Table 2 below summarizes the results for July 2021. The S&P CoreLogic Case-Shiller Indices could be revised for the prior 24 months, based on the receipt of additional source data.
July 2021
July/June
June/May
1-Year
Metropolitan Area
Level
Change (%)
Change (%)
Change (%)
Atlanta
190.52
2.2%
2.5%
18.5%
Boston
278.01
1.1%
1.3%
18.7%
Charlotte
211.49
2.2%
2.6%
20.9%
Chicago
168.10
1.2%
1.7%
13.3%
Cleveland
156.02
1.1%
2.3%
16.2%
Dallas
245.80
2.3%
3.0%
23.7%
Denver
283.18
1.8%
2.3%
21.3%
Detroit
156.19
1.2%
2.2%
16.1%
Las Vegas
246.36
2.8%
3.4%
22.4%
Los Angeles
358.50
1.4%
1.9%
19.1%
Miami
310.50
2.2%
3.0%
22.2%
Minneapolis
217.14
1.2%
1.8%
14.5%
New York
241.86
1.1%
0.8%
17.8%
Phoenix
280.47
3.3%
3.6%
32.4%
Portland
302.71
1.5%
2.2%
19.5%
San Diego
355.33
1.6%
2.5%
27.8%
San Francisco
338.68
1.2%
2.7%
22.0%
Seattle
343.92
0.9%
1.6%
25.5%
Tampa
289.59
2.9%
3.0%
24.4%
Washington
283.68
0.8%
1.6%
15.8%
Composite-10
284.74
1.3%
1.8%
19.1%
Composite-20
272.34
1.5%
2.0%
19.9%
U.S. National
265.35
1.6%
2.2%
19.7%
Sources: S&P Dow Jones Indices and CoreLogic
Data through July 2021
Table 3 below shows a summary of the monthly changes using the seasonally adjusted (SA) and non-seasonally adjusted (NSA) data. Since its launch in early 2006, the S&P CoreLogic Case-Shiller Indices have published, and the markets have followed and reported on, the non-seasonally adjusted data set used in the headline indices. For analytical purposes, S&P Dow Jones Indices publishes a seasonally adjusted data set covered in the headline indices, as well as for the 17 of 20 markets with tiered price indices and the five condo markets that are tracked.
S&P Dow Jones Indices is the largest global resource for essential index-based concepts, data and research, and home to iconic financial market indicators, such as the S&P 500® and the Dow Jones Industrial Average®. More assets are invested in products based on our indices than products based on indices from any other provider in the world. Since Charles Dow invented the first index in 1884, S&P DJI has been innovating and developing indices across the spectrum of asset classes helping to define the way investors measure and trade the markets.
S&P Dow Jones Indices is a division of S&P Global (NYSE: SPGI), which provides essential intelligence for individuals, companies, and governments to make decisions with confidence. For more information, visit https://www.spglobal.com/spdji/.
After notable and expected downward revisions for prior months, May recorded a decline of 5.9% for sales of newly-constructed single family homes, according to estimates from the Census Bureau and HUD. The May seasonally adjusted annual rate (769k) was the lowest in a year, due to builders slowing sales as a consequence of higher material costs and declining availability of labor, material and lots.
Residential demand continues to be supported by low interest rates, a renewed consumer focus on the importance of housing, and solid demand in lower-density markets like suburbs and exurbs. However, higher building costs, longer delivery times, and general unpredictability in the residential construction supply-chain are having measurable impacts on new home prices. In May, the median price of a newly-built home was 18% higher than a year ago, at $374,400. As NAHB has estimated, higher lumber costs alone are increasing new home prices by $36,000 on average.
Higher costs have priced out buyers, particularly at the lower end of the market. A year ago, 44% of new home sales were priced below $300,000. In May 2021, only 26% of new home sales were priced below $300,000.
Looking back to the spring of last year, the April 2020 data (570,000 annualized pace) marks the low point of sales for the 2020 recession. The April 2020 rate was 26% lower than the prior peak, pre-recession rate set in January. Sales then mounted a historic surge from April until July, outpacing gains in actual construction. Sales have been above the pace of the post-Great Recession trend since the second half of last year. However, since January the trend has been declining and has now dipped below the long-run trend (as indicated by the blue dashed line in the graph above).
Sales-adjusted inventory levels remained healthy in May, although they did increase to a 5.1 months’ supply.
Completed ready-to-occupy homes continue to fall as a share of new home inventory. Such homes were just under 24% of inventory a year ago. They are only a little more than 11% of the total in May 2021.
Moreover, to see how sales patterns have changed in a high demand, low supply market — the count of new homes sold that had not started construction is up 76 percent over the last year. The count of new homes sold that are completed and ready to occupy is down 33 percent.
Regionally on a year-to-date basis new home sales rose in all four regions, up 48.7% in the Northeast, 33.5% in the Midwest, 32.3% in the South, and 5.6% in the West. These significant increases are due in part to lower sales volume during the Covid crisis a year ago.
“After a run up over the first few months of the year, rates have paused and hovered around three percent since March,” said Sam Khater, Freddie Mac’s Chief Economist. “Despite this favorable rate climate, there remains a shortage of homes for sale. The lack of housing supply has been compounded by labor disruptions and expensive building materials that are driving up the cost of new housing, making it difficult for homebuyers to find homes to purchase.”
News Facts
30-year fixed-rate mortgage averaged 3.00 percent with an average 0.6 point for the week ending May 20, 2021, up from last week when it averaged 2.94 percent. A year ago at this time, the 30-year FRM averaged 3.24 percent.
15-year fixed-rate mortgage averaged 2.29 percent with an average 0.7 point, up from last week when it averaged 2.26 percent. A year ago at this time, the 15-year FRM averaged 2.70 percent.
The PMMS is focused on conventional, conforming, fully amortizing home purchase loans for borrowers who put 20 percent down and have excellent credit. Average commitment rates should be reported along with average fees and points to reflect the total upfront cost of obtaining the mortgage. Visit the following link for the Definitions. Borrowers may still pay closing costs which are not included in the survey.
Single-family housing starts ended 2020 on a high note, rising 12% in December to a 1.338 million unit pace – the highest pace since 2006, according to the Census Bureau.
That’s up 27.8% from one year ago, a remarkable figure given the economic effects of the COVID-19 pandemic, per industry officials.
“2020 will go down, quite unexpectedly, as one of the best years for home builders in recent memory, and proof that great challenges — and not just those posed by COVID — can be overcome with hard work and creativity,” said Matthew Speakman, Zillow economist. “Demand for homes remains sky high, despite the still-raging pandemic, as people look to take advantage of historically low mortgage rates and find their next home. “
An estimated 1.380 million housing units were started in 2020 – 7% percent above the 2019 figure of 1.29 million
Remarkably, most industry experts believe construction rates will climb even higher in 2021.
“We expect single-family construction to move up 9% in 2021 — a much-needed relief valve for homebuyers,” said Danielle Hale, chief economist at Realtor.com. “While buyer demand has slowed since December, it remains notably higher than one year ago, giving builders a strong incentive to keep building.”
Hale added that builder optimism is higher than it was one year ago, but rising material costs and low land inventory are weighing on builder confidence in the short term.
“Supply-side headwinds will remain in 2021,” added Odeta Kushi, First American deputy chief economist. “Given the underbuilding that took place in the decade following the Great Recession, it will take years for builders to close the deficit.”
Even with the promise of additional relief funding from President Joe Biden’s American Rescue Plan, most homebuyers are still looking for houses with large work-from-home areas — a sign that confidence in the eradication of the virus, and a restart of face-to-face interaction, remains low.
“The past year has also cemented the smooth transition towards touring homes virtually and digitalizing many parts of the mortgage process, making homebuying much safer in light of the ongoing public health situation,” said John Pataky, executive vice president at TIAA Bank.
Privately-owned housing starts in December also jumped from November — a 5.8% rise with a seasonally adjusted annual rate of 1.669 million. That’s also 5.2% above the December 2019 rate of 1.587 million.
Austin Niemiec, Rocket Pro TPO executive vice president, urged brokers to maintain a focus on purchasing and ensuring solid internal processes.
“Brokers should be ready to support clients looking to secure their dream home,” he said. “This will be another strong year for loan officers, and new houses will play an important role in making sure we assist buyers at a high level.”
In authorizations, units in buildings with five units or more were authorized at a rate of 437,000 in December. Privately owned housing units authorized by building permits in December were at a seasonally adjusted annual rate of 1,709,000 — 4.5% above the revised November rate of 1.635 million.
Single-family authorizations in December were at a rate of 1.226 million, a rise of 7.8% above the November figure of 1.137 million.
Lawrence Yun, National Association of Realtors chief economist, is optimistic the housing sector will be a major player in the economy’s recovery in 2021.
“More construction also means more local job creation,” he said. “The worst of the housing shortage could soon come to an end.”
In the past year, homeowners with mortgages, representing about 63% of all properties, have seen their equity increase by 10.8%, according to CoreLogic.
That equates to a collective $1 trillion in gained equity, or an average $17,000 per homeowner.
This is the largest equity gain in more than six years.
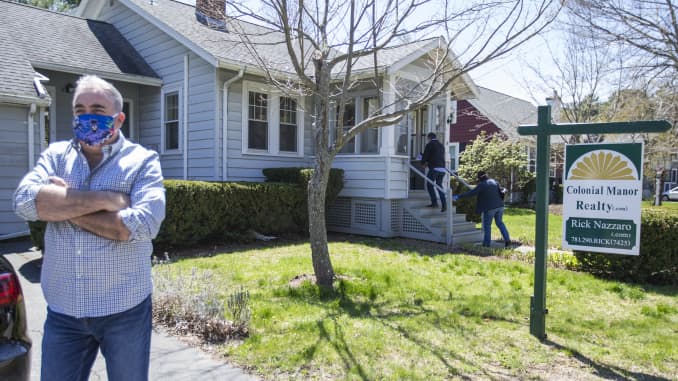
Blake Nissen | The Boston Globe via Getty Images
American homeowners are $1 trillion richer as the pandemic-driven housing boom pads their pockets.
As prices rise, home equity multiplies. In the past year, homeowners with mortgages, representing about 63% of all properties, have seen their equity increase by 10.8%, according to CoreLogic.
That equates to a collective $1 trillion in gained equity, or an average $17,000 per homeowner, the largest equity gain in more than 6 years.
Homeowners in some states saw greater equity gains than others. States with the hottest home prices saw the biggest gains.
In Washington state, homeowners banked an average of $35,800. In California they gained $33,800 and in Massachusetts an average of $31,200.
However, homeowners in North Dakota, which was particularly hard-hit by the pandemic, saw the lowest annual equity gain of just $5,400.
“Over the past year, strong home price growth has created a record level of home equity for homeowners,” said Frank Nothaft, chief economist for CoreLogic. “The average family with a home mortgage loan had $194,000 in home equity in the third quarter. This provides an important buffer to protect families if they experience financial difficulties.”
It has contributed to historically low foreclosure rates, although part of that is also due to mortgage forbearance programs put in place at the start of the pandemic. Still, it will help those borrowers who are struggling most and may not be able to keep their homes. They can sell into the market and potentially still make a profit.
Prices are rising so quickly because demand for housing is incredibly strong and supply equally lean. The work and school-from-home culture of the pandemic only increased demand that had already been rising, as the millennial generation aged into their homeowning years. Mortgage rates, which have set 14 record lows so far this year, have helped even more buyers get in the game.
So far, homebuying has not eased much, especially for newly built homes. Signed contracts on existing homes, however, fell slightly in September and October. This may be less a demand issue and more a problem with continued tight supply, as well as weakening affordability.
Some, however, claim the run on housing may actually be running out of steam.
“With pent-up demand from the spring now largely expended, mortgage interest rates unlikely to fall further, inventory at record lows and early signs that the exodus from cities is slowing, home sales will edge back further over 2021,” wrote Matthew Pointon, property economist with Capital Economics. “That, alongside tight credit conditions, suggest the current boom in house prices will prove short-lived.”
The exodus from major cities also appears to be slowing, with some buyers heading back in looking for bargains.
While home price gains may ease, prices are unlikely to weaken dramatically, simply because of the supply and demand imbalance. That will continue to help those borrowers who have the least amount of equity.
As it stands now, the share of borrowers in a negative equity position, owing more on their mortgages than their homes are worth, is down over 18% from a year ago. There are now just 3%, 1.6 million mortgaged properties, in a negative equity position.
Newsday RM via Getty Images Photo of home for sale in Huntington, New York on August 5, 2020. New York City suburbs are seeing a huge increase in real estate demand amid the pandemic.
New York City apartment sales plunged in July, according to a report from the real-estate firm Douglas Elliman.
But in neighboring suburbs, home sales are surging as wealthy New Yorkers seek greener pastures.
For Connecticut — which has struggled to rebound even from the last recession — the migration could be a boon for its struggling finances.
Only one Manhattan condo sold for more than $10 million in July, according to a new report, as many wealthy New Yorkers continue to flee the city for greener pastures.
Overall apartment sales fell 57% in July compared to the same month in 2019 as for-sale listing soar, real estate firm Douglas Elliman said in its monthly report, a highly-watched data source for the nation’s largest housing market.
As the US largely fails to stop the spread of the coronavirus, short-term escapes appear to be turning in to long-term moves, potentially fueling a rebirth for struggling suburbs. In Westchester County, directly north of the five boroughs, overall single-family sales were up 112% over last year, with those over $2 million more than quadrupling.
And in Connecticut, the areas closest to New York City saw a similar uptick in-step with Westchester. The state was hit hard by the housing crisis more than a decade ago, and has struggled to recover in the years since. Connecticut is one of just two states in the country where gross domestic product has yet to recover from the previous recession and its employment numbers have lagged neighboring states, according to data from the Bureau of Economic Analysis and the Federal Reserve Bank of St. Louis.
“We are going to market ourselves more to those individuals as opposed to marketing ourselves to the company,” a state economic-development official told The Wall Street Journal, assuming that the days of commuting to an office in Manhattan’s core or corporate parks are on the skids for now. People working from home in Connecticut could be a much-needed boost to the state’s income tax base — and its lawn-laden towns and countryside feel all the more attractive in the middle of a pandemic.
But while the shift in high-end housing is shaping up to be a boon for some towns and brokers, investors are circling distressed assets at depressed prices as unemployment remains above 10% and out-of-work Americans struggle to pay rent.
“Real-estate investors — when you take the emotion out of it — many of them have been waiting for this for a decade,” David Schechtman, a broker with Meridian Capital Group, told The Wall Street Journal in April. The economy has seen little improvement in the months since.


 Newsday RM via Getty Images Photo of home for sale in Huntington, New York on August 5, 2020. New York City suburbs are seeing a huge increase in real estate demand amid the pandemic.