Tag Archives: Bedford Corners Real Estate

Bedford Corners Real Estate

Mortgage rates drop with inflation drop | Bedford Corners Real Estate

Finally, some good news: the growth rate of inflation is cooling off for now, and with the CPI inflation report being positive, the 10-year yield fell noticeably, and mortgage rates will fall with that! So, the question is, are we reaching the peak of inflation and close to the end of the Fed rate hike cycle? Let’s take a look at today’s data.

From the CPI reportThe Consumer Price Index for All Urban Consumers (CPI-U) rose 0.4 percent in October on a seasonally adjusted basis, the same increase as in September, the U.S. Bureau of Labor Statistics reported today. Over the last 12 months, the all-items index increased 7.7 percent before seasonal adjustment.

The estimates for the CPI inflation data were for 7.9% year-over-year growth. Some people in the markets had speculated that the data would come in even hotter than anticipated —some whisper numbers were for 8.2% – 8.4% year-over-year growth. This of course led some people to believe that bond yields and mortgage rates would go much higher today.

However, the report came in at 7.7% — lower even than the forecast. As a result, mortgage rates went from 7.37% yesterday to 6.67% as of this writing.

Screen-Shot-2022-11-10-at-2.57.15-PM

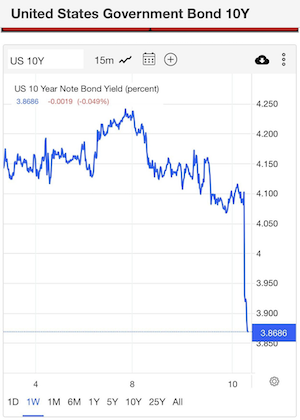
On Thursday morning, the 10-year yield had a big rally, and bond yields headed lower (see above) and mortgage rates will be below 7% today. What a difference a year makes — now we’re excited to see mortgage rates getting below 7%! But it makes sense when you consider that over the last 52 weeks, mortgage rates have ranged from 3.14% to 7.37%.

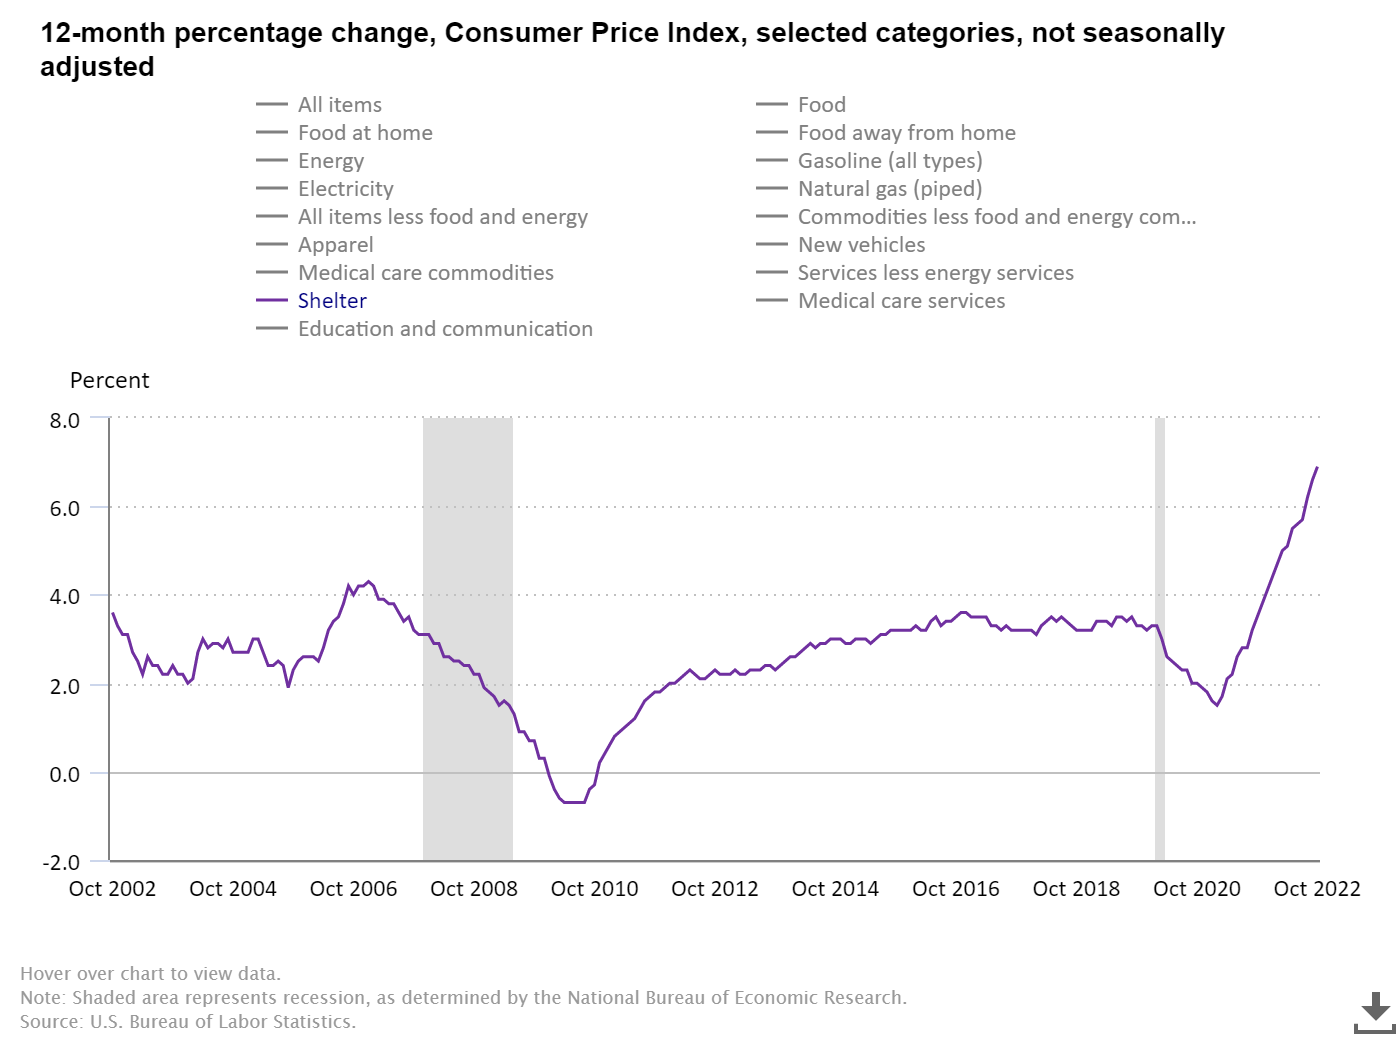
One of my talking points with inflation data is that the biggest driver of core inflation is shelter, and this data line lags. It lagged back in August 2020 when it was still down, and it’s crawling now on the CPI data.

We already have more current data lines to show that the growth rate of inflation is cooling off. Some Federal Reserve members have commented on the fact that they know the shelter inflation data on the CPI lags — that’s a positive. Some people feared the Federal Reserve didn’t understand the lag in the CPI data, but this doesn’t appear to be the case.

So, we need to understand that the CPI shelter data lags, and the cooldown will be more of a 2023 story, especially in the second half of the year. Back in September, I went on CNBC before the CPI report came out to make this point and explain that shelter inflation did have legs to grow but the growth rate couldn’t be sustained.

Shelter CPI inflation data

As we can see in the graph below, the growth rate of shelter inflation is moving up and this has the potential to keep going higher. One thing to remember is that we have 910,000 two-unit housing that will come on line in 2023 and this will help cool the growth rate of inflation down next year. We already see the growth rate of shelter cooling off in the data lines that are more current, so this will be a positive story in 2023. 


When this data line starts to cool down, it will be the biggest factor in core inflation cooling down. This is why I wrote about how we all need to root for housing completion data to get better so we get more supply into the marketplace. The best way to deal with housing inflation is more supply, and we have a lot of two-unit construction in the pipeline. 

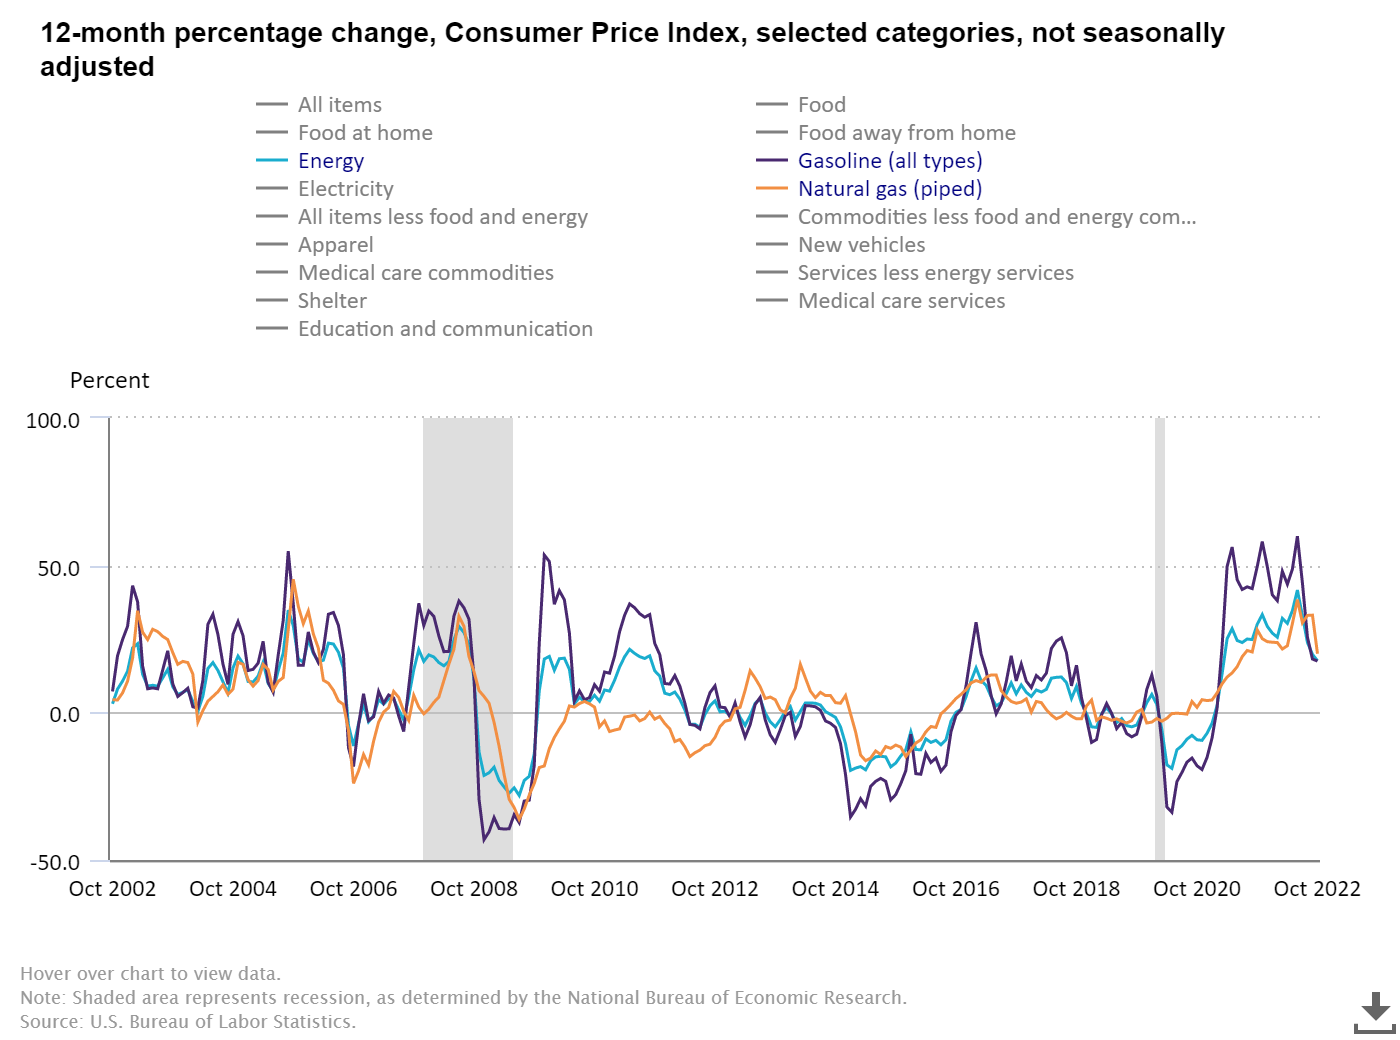
We see some inflation data cooling off recent peaks; food and energy are not part of core inflation data as they can have wild swings. As we can see below the growth rate of the Mad Max inflationary basket is cooling off, mostly due to energy prices coming off the recent highs.


Other inflationary data is also cooling off. We all know that used car prices exploded during the pandemic as supply crashed. That is already changing and has room to go lower. If you’re trying to defeat inflation by killing demand and losing jobs, you don’t have the proper supply in the market.

The history of global pandemics traditionally means supply chains are stressed for two years. Now that we are all walking the earth freely (outside of China), the production supply levels are returning to normal.

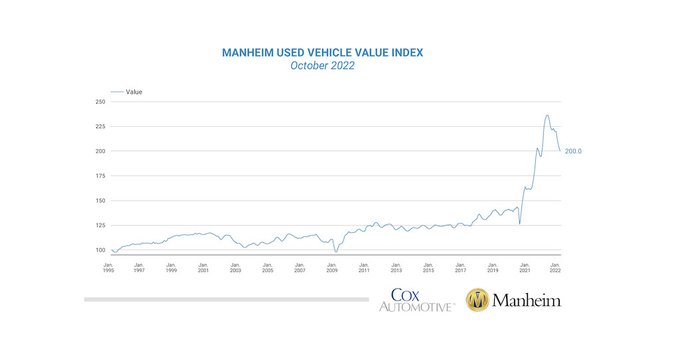
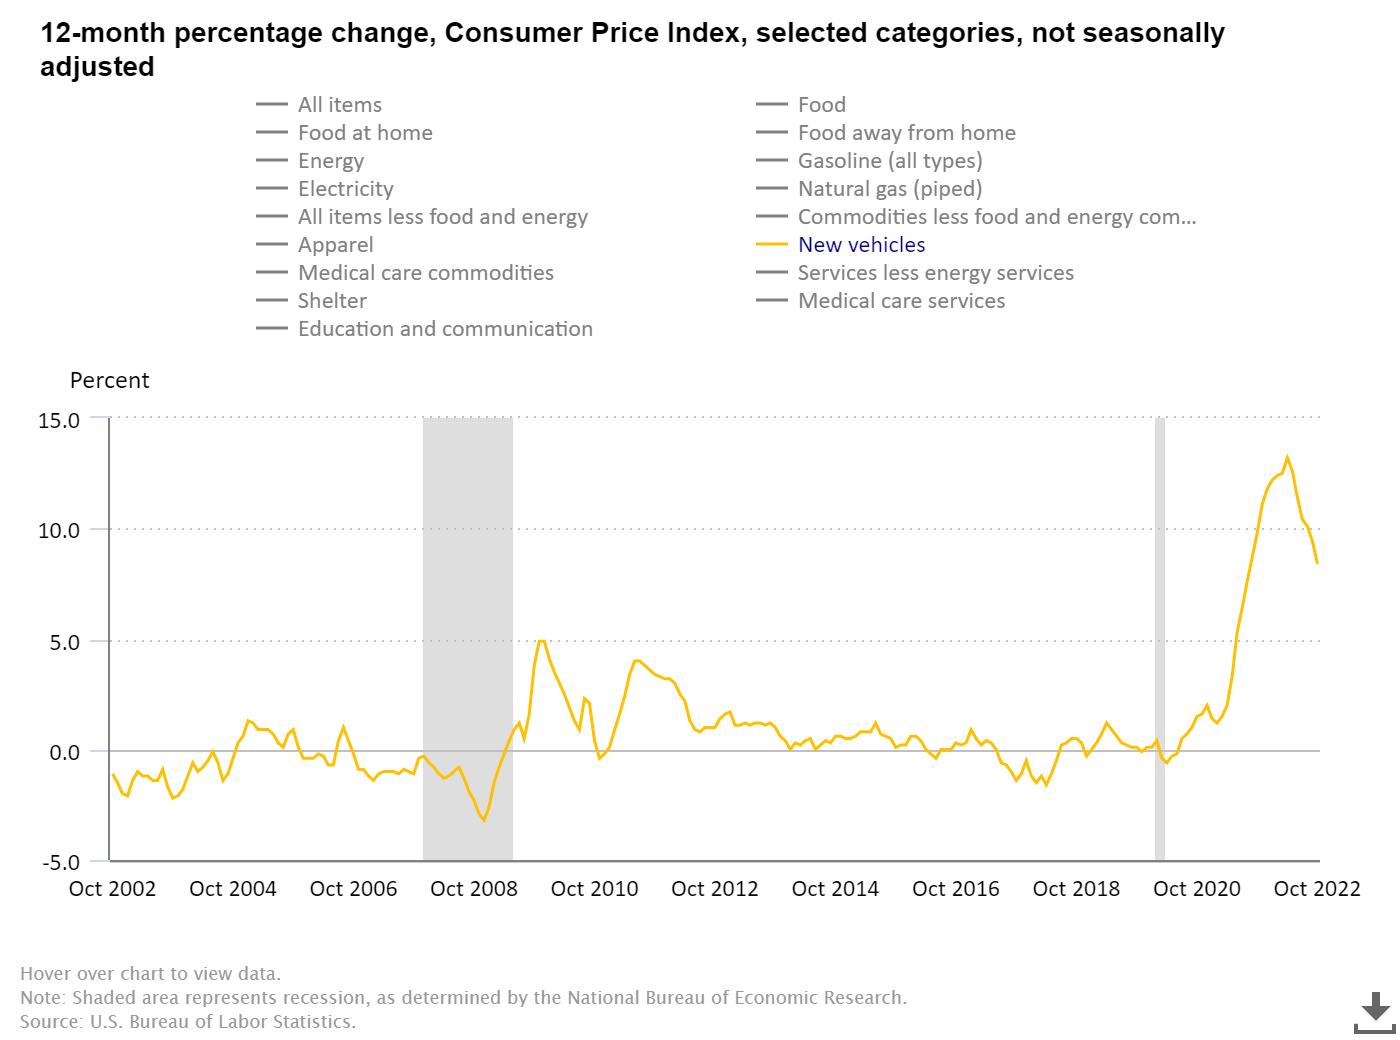
For today’s CPI report, the new vehicle price index, which also went parabolic during the pandemic, is coming down. Again, the best way to deal with inflation is to get more supply in the market.


So does this data represent a turning point? Have we seen the peak growth rate in inflation?

I would say this about this topic. Last year at this time the growth rate of a lot of inflationary data was still rising and then, on top of everything else, we had the Russian Invasion of Ukraine in February. Since then we have had massive Fed rate hikes in the system and the biggest driver of core inflation in America is set to cool down in 2023. Those facts are here today where they weren’t in November of 2021.

But, the Federal Reserve feels pressure to create a job-loss recession to get the inflation data back down toward 2% and even with today’s CPI inflation data being lower, they’re still going to push us into a job-loss recession.

I raised my sixth and final recession red flag as of Aug. 5, but I did write about two ways we could still avoid a nasty job loss recession. Here are two things that I would be looking for:

1. Rates fall to get the housing sector back in line.

Mortgage rates falling toward 5% can stabilize housing if they have duration. Traditionally, mortgage rates below 4% boost housing demand. The bleeding needs to stop and what we have seen in the data is that buyers did come into the housing market when rates got back down toward 5%.

However, 5% rates didn’t stay for long as the Federal Reserve found this to be counter-productive for their job loss recession to happen. We need to see lower rates and have it stick for some time for it to be more useful to get the housing market out of recession. 

2. The inflation growth rate falls, and the Fed stops hiking rates and reverses course, as it did in 2018.

Some inflation data is already cooling off and will find its way into the data lines. However, rent inflation won’t come down in the data until 2023, even though we already see some change in that sector. 

Since all my six recession flags are up, I am keeping a close eye on the jobless claims data, which rose today — this is the last data line that is preventing the economy from falling into a job-loss recession as so far, the honey badger labor market is holding up.

So for today, this is a small victory, but we will need many more months to change this economy.

read more…

housingwire.com/articles/

Single family housing starts fall in July | Bedford Corners Real Estate

A sharp decline in single-family home construction is another indicator that the housing slowdown is showing no signs of abating, as rising construction costs, elevated mortgage rates and supply chain disruptions continue to act as a drag on the market.

Overall housing starts fell 9.6% to a seasonally adjusted annual rate of 1.45 million units in July, according to a report from the U.S. Department of Housing and Urban Development and the U.S. Census Bureau. The July reading of 1.45 million starts is the number of housing units builders would begin if development kept this pace for the next 12 months.

Single-family starts decreased 10.1% to a 916,000 seasonally adjusted annual rate and are down 2.1% on a year-to-date basis. This is the lowest reading for single-family home building since June 2020. More declines lie ahead, as single-family permits decreased 4.3% to a 928,000 unit rate and are down 5.9% on a year-to-date basis. NAHB is forecasting 2022 to be the first year since 2011 to record an annual decline in single-family home building.

A housing recession is underway with builder sentiment falling for eight consecutive months, while the pace of single-family home building has declined for the last five months. The decline in single-family starts is reflected in the HMI measure of builder sentiment, as housing demand continues to weaken on higher interest rates while on the supply side builders continue to grapple with higher construction costs. Builders are reporting weakening traffic as housing affordability declines.

The multifamily sector, which includes apartment buildings and condos, decreased 8.6% to an annualized 530,000 pace. Multifamily construction remains very strong given solid demand for rental housing. The number of multifamily 5+ units currently under construction is up 24.8% year-over-year. Multifamily development is being supported by a substitution effect, with frustrated or priced out prospective home buyers seeking rental housing.

The number of single-family homes permitted but not started construction has likely peaked after rising over pervious quarters due to supply-chain issues. In July, there were 146,000 homes authorized but not started construction. This reading is flat year-over-year. In contrast, the number of multifamily 5+ units permitted but not started construction continues to rise, up 47% year-over-year to 147,000 units.

On a regional and year-to-date basis, combined single-family and multifamily starts are 10.7% higher in the Northeast, 0.4% lower in the Midwest, 6.5% higher in the South and 2.2% lower in the West. Looking at regional permit data on a year-to-date basis, permits are 1.9% lower in the Northeast, 1.9% higher in the Midwest, 2.6% higher in the South and 0.2% higher in the West.

As an indicator of the economic impact of housing and as a result of accelerating permits and starts in recent quarters, there are now 816,000 single-family homes under construction. This is 17% higher than a year ago. There are currently 862,000 apartments under construction, up 25% from a year ago with this number continuing to rise. Total housing units now under construction (single-family and multifamily combined) is 21% higher than a year ago. The number of single-family units in the construction pipeline is now falling and will continue to decline in the months ahead given recent declines in buyer traffic.

read more…

eyeonhousing.org

Mortgage rates average 5.25% | Bedford Corners Real Estate

 Freddie Mac (OTCQB: FMCC) today released the results of its Primary Mortgage Market Survey ®(PMMS®), showing that the 30-year fixed-rate mortgage (FRM) averaged 5.25 percent.

“Economic uncertainty is causing mortgage rate volatility,” said Sam Khater, Freddie Mac’s Chief Economist. “As a result, purchase demand is waning, and homebuilder sentiment has dropped to the lowest level in nearly two years. Builders are also dealing with rising costs, meaning this posture is likely to continue.”

News Facts

  • 30-year fixed-rate mortgage averaged 5.25 percent with an average 0.9 point as of May 19, 2022, down from last week when it averaged 5.30 percent. A year ago at this time, the 30-year FRM averaged 3.00 percent.
  • 15-year fixed-rate mortgage averaged 4.43 percent with an average 0.9 point, down from last week when it averaged 4.48 percent. A year ago at this time, the 15-year FRM averaged 2.29 percent.
  • 5-year Treasury-indexed hybrid adjustable-rate mortgage (ARM) averaged 4.08 percent with an average 0.2 point, up from last week when it averaged 3.98 percent. A year ago at this time, the 5-year ARM averaged 2.59 percent.

The PMMS® is focused on conventional, conforming, fully amortizing home purchase loans for borrowers who put 20 percent down and have excellent credit. Average commitment rates should be reported along with average fees and points to reflect the total upfront cost of obtaining the mortgage. Visit the following link for the Definitions. Borrowers may still pay closing costs which are not included in the survey.

Freddie Mac makes home possible for millions of families and individuals by providing mortgage capital to lenders. Since our creation by Congress in 1970, we’ve made housing more accessible and affordable for homebuyers and renters in communities nationwide. We are building a better housing finance system for homebuyers, renters, lenders, investors and taxpayers. Learn more at FreddieMac.com, Twitter @FreddieMac and Freddie Mac’s blog FreddieMac.com/blog.

Building Materials Prices Increase 1.5% in December | Bedford Corners Real Estate

The prices of goods used in residential construction ex-energy climbed 1.5% in December (not seasonally adjusted), according to the latest Producer Price Index (PPI) report released by the Bureau of Labor Statistics. The index was driven higher by large price increases for wood products.

Building materials prices increased 15.9% in 2021 and have risen 18.6% since December 2020. Since declining 1.8% between July and August 2021, the index has climbed 4.5%.

The price index of services inputs to residential construction increased 0.4% in December following a five-month period over which the index declined 13.6%.  The index is 9.6% higher than it was 12 months prior and 19.6% higher than the January 2020 reading.

Softwood Lumber

The PPI for softwood lumber (seasonally adjusted) increased 24.4% in December and has gained 44.5% since September.  According to Random Lengths data, the “mill price” of framing lumber has roughly tripled since late August.

The PPI of most durable goods for a given month is largely based on prices paid for goods shipped, not ordered, in the survey month. This can result in lags relative to cash market prices, suggesting another sizable increase in the softwood lumber producer price index may be in the next PPI report.

Record-high volatility of softwood lumber prices continues to be as problematic as high prices. The monthly change in softwood lumber prices averaged 0.3% between 1947 and 2019. In contrast, the percent change of the index has averaged 12.0% since January 2020—the highest 24-month average since data first became available 1947 and nearly triple the previous record.

Steel Products

Steel mill products prices rose 0.2% in December, the smallest monthly increase since September 2020. Monthly price increases have slowed in each of the past five months.

The last monthly price decrease in steel mill products occurred in August 2020, and the index has climbed 152.2% in the months since–with more than 80% of that increase taking place in 2021.

Ready-Mix Concrete

The PPI for ready-mix concrete (RMC) gained 0.9% in December after increasing 1.1% in November.  The index for RMC increased 6.5% between January and December 2021 and is 9.3% higher than the January 2020 level.

At the regional level, prices increased in the South (+1.0%) and West (+1.1%) as prices declined in the Midwest (-0.1%).  The price of RMC held steady in the Northeast.

 Gypsum Products

In December, the PPI for gypsum products decreased 0.5%–the second consecutive monthly decline.  Gypsum products prices ended the year 18.2% higher than they were in January.

Paint

The PPIs for exterior architectural coatings (i.e., paint) increased 1.6% in December while the price of interior paint was unchanged. Neither index has declined since January 2021 and the January-to-December price increases of architectural coatings is unprecedented–exterior and interior paint prices climbed 19.8% and 10.9%, respectively, in 2021.

Other Building Materials

The chart below shows the 12-month and year-to-date price changes of other price indices relevant to the residential construction industry.

Building Materials Wholesaling and Retailing

In contrast to the PPI for building materials retailing—which increased 0.4% in December—the Producer Price Index for building materials wholesaling decreased 1.3% over the month.  The wholesale and retail services indices measure changes in the nominal gross margins for goods sold by retailers and wholesalers. Gross profit margins of retailers, in dollar terms, have declined 25.7% since reaching an all-time high in June 2021 but remain 27.3% higher than the January 2020 level.

Building materials wholesale and retail indexes account for roughly two-thirds of the PPI for “inputs to residential construction, services.”

Professional Services

The category of professional services carries the third most weight among those that make up the service inputs to residential construction PPI.  The prices of legal, architectural, and engineering services changed 0.5%, 0.0%, and -0.1%, respectively, in December. Although the year-to-date increase in prices of professional services used in residential construction are quite modest compared to that of materials, prices have increased more in 2021 than they had by December 2020; the difference is especially striking for architectural services.

Though the difference in price changes for legal services is small, the percentage increases are large relative to engineering and architectural.  This follows with a trend in recent years.  Since December 2018, the price of legal services has risen 13.6%–much more than the three-year increase in architectural (+1.1%) and engineering services (+5.8%).

Metal Treatment Services

Prices of metal treatment services increased 1.2%, on average, in December.  The subset of these services used to calculate the services inputs to residential construction includes plating and polishing, coating and allied services, and heat treating.

Metal coating and allied services increased the most over the course of 2021 (+14.9%, NSA).  Metal heat treating and plating and polishing services climbed 6.2% and 3.8%, respectively, between January and December.  The average monthly price increase of the three services was just 0.1% over the course of 2020.

read more…

eyeonhousing.org/2022/01/

Home sales on Long Island dropped 16.9 percent | Bedford Corners Real Estate

Median sales prices up at least 9 percent year-over-year

November ended a five-month streak of year-over-year prices increasing by at least 10 percent

The housing market on Long Island has slowed from a year ago in terms of sales volume, but a lack of inventory is likely the culprit.

Home sales on Long Island dropped 16.9 percent year-over-year in November, according to data from OneKey MLS reported by Newsday. Home sales in Nassau County fell 19.2 percent, while Suffolk County sales decreased by 14.9 percent.ADVERTISING

As home sales dropped, so did availability of homes on the market. A 1.9-month supply of homes were for sale in Nassau last month and a 2.1-month supply of homes were available in Suffolk. The counties’ supply numbers in November 2020 were 3.3 months and 2.4 months, respectively.

Low supply could continue to hamper the market for the near future.

“We’ve had low inventory for quite a while now,” OneKey MLS CEO Jim Speer told Newsday. “I would expect it to stay at a pretty low level, hopefully not at this low a level, but I expect we wouldn’t see a great increase in the coming months.”ADVERTISEMENT

While listings are dropping and prices remain high, they aren’t soaring to the heights seen in recent months, a likely relief for homebuyers.

In Nassau, the median sale price was $655,000, a 9.3 percent increase year-over-year. But it was only an 0.8 percent, or $5,000, increase from October. November also ended a five-month streak of year-over-year prices increasing by at least 10 percent, according to Newsday, suggesting a slowing in price growth.ADVERTISEMENT

In Suffolk, the median sale price in November was $520,000, a 10.3 percent increase year-over-year, but only a 0.2 percent gain month-over-month, $1,000 in all.

The median sale prices in both counties are down from the historic highs hit during the summer, when Nassau reached $670,000, while Suffolk hit $531,000. The median pending sale in November for deals that hadn’t closed were for $650,000 and $515,000 in each county, respectively.

“I have definitely seen the market become more realistic,” Keller Williams Realty real estate agent Maria Wilbur told Newsday. “The offers coming in the last month or two have been closer to what the value of the house should be. They’re not so inflated.”

read more…

https://therealdeal.com/tristate/2021/12/16/

NYC rents skyrocket amid record-high inflation rates | Bedford Corners Real Estate

As New Yorkers struggle with higher gas and grocery prices amid record-high inflation rates, the cost of rent is also increasing — and isn’t expected to level off anytime soon, according to data and experts. 

The net effective median rent in Manhattan increased by a whopping 10.1 percent between July and October and 20 percent since January as inflation jumped to the highest level seen since 1990, according to data compiled by Miller Samuel/Douglas Elliman.

In Queens, the third-quarter median asking rent was $2,200 this year, just $100 shy of the pre-pandemic peak set in quarter three of 2019, according to data from StreetEasy. 

While numbers from Miller Samuel/Douglas Elliman show housing costs across Manhattan, Brooklyn and Northwest Queens are still lower than 2019, early numbers from real estate analytics company UrbanDigs show prices jumped beyond pre-pandemic levels this month. 

So far, the median asking rent in Manhattan is up 27 percent this month compared to last year and up 4 percent compared to November 2019, the data show. 

Cityscape at dusk of the upper westside looking to midtown.
New York’s numbers reflect a nationwide trend that’s seen a 0.4 percent increase in housing cost for renters between September and October.

In Brooklyn, the median asking rent is up 15 percent so far this month compared to last year and up 5 percent compared to Nov. 2019. 

“I wish I had better news on that one, I think a lot of tenants are likely to get sticker shock at their next lease renewal,” Greg McBride, the chief financial analyst at the personal finance website Bankrate.com, told The Post. 

“If inflation does eventually moderate and we get back to that 2 percent rate of inflation, then OK, that’s an environment where rents would likely increase at a much more modest, pedestrian pace, but if inflation stays at 4 or 5 percent, that’s going to translate into similar increase in rents year after year.” 

New York’s numbers reflect a nationwide trend that’s seen a 0.4 percent increase in housing cost for renters between September and October amid a dwindling supply of listings, high demand and a supply chain bottleneck that’s increased the cost of home building materials, Labor Department data show. 

Earlier this year, rents in tech hubs like New York City, Los Angeles and Chicago were declining by 15.8 percent but in September, they jumped by 7.6 percent year over year, according to data from Realtor. 

“In New York City, the vacancy rate here is already absurdly low and rents have been steadily rising post pandemic as there is more demand than supply. Additionally, if mortgage rates start to go up and affordability is affected it will force potential buyers to become renters as they are priced out of the market,” Pamela Liebman, the CEO of real estate giant Corcoran, told The Post. 

“If mortgage rates rise, that will put additional pressure on an already robust rental market and we could see a serious rise in rent. And as landlords’ costs go up due to inflation, they will continue to pass the increases on to the tenants.” 

High angle view of Lower East Side in Manhattan.
Earlier this year, rents in tech hubs like New York City, Los Angeles and Chicago were declining by 15.8 percent but in September, they jumped by 7.6 percent year over year

The pandemic massively disrupted New York’s housing market and is partly to blame for the sky-high increases, said Jonathan Miller, the President and CEO of Miller Samuel Inc.

“The rate of growth in 2021 has been like a rocket ship, but it’s coming from a very low place because rents fell to 25% during the early days of the pandemic and now are rising,” Miller explained. 

“If we look at net-effective median rent for all of Manhattan compared to October of 2019, so pre-pandemic but the same seasonal period in the year, median rent is 0.8 percent below 2 years ago. It’s very close to parity.” 

Still, with billions in stimulus dollars flowing through the region, expected wage growth and the return of international buyers, demand is only expected to go up and unless the housing supply increases, rent costs are slated to jump even more, too, said Miller.  

In 2020, the number of new housing permits decreased by 26.3 percent citywide and in Manhattan, only 1,896 new housing permits were issued last year, down 65.6 percent from 2019 and the lowest level seen since the 2010 Great Recession, city statistics show.  

Aerial photo of Manhattan buildings.
Rents are expected to continue to grow throughout the end of the year and throughout next spring according to an economist at StreetEasy.

“Rents are going to continue to grow throughout the end of the year and throughout next spring,” said Nancy Wu, an economist with StreetEasy. 

“We’re going to see a very busy rentals market [next year] and high demand is going to lead to higher rents, given the supply is pretty constant.” 

At the start of the pandemic, New York implemented a moratorium on evictions barring landlords from booting tenants who can show they’re behind on their rents because of COVID-era financial difficulties but the program will end come January 15. 

Beyond that, cash-strapped renters can apply for state aid through a federally financed program designed to help lower-income New Yorkers pay their housing costs but that program has a bottom, too. 

So far, tenants have filed 252,000 applications, 73,000 of which have been paid out, totaling $913 million in aid. 

An additional 73,000 applications, totaling $917 million in aid, have been tentatively approved.

read more…

nypost.com/2021/11/11/

Housing starts surge 50% | Bedford Corners Real Estate

U.S. homebuilding bounced back in May as lumber prices pulled back from record highs. 

Housing starts rose 3.6% to a seasonally adjusted annual rate of 1.572 million last month, the Commerce Department said on Wednesday. April’s reading was revised lower to 1.517 million from 1.569 million. Economists surveyed by Refinitiv had expected housing starts to rise to 1.63 million.

Starts surged 50% on a year-over-year basis in May. Homebuilding rose in the Midwest, South and West but fell in the Northeast. 

The slight increase in homebuilding came as lumber prices topped out on May 7 and fell 22% through the end of the month, finishing below where they ended April. A lumber shortage that developed in the aftermath of COVID-19 lockdowns caused the cost of the critical material to soar, resulting in builders putting off projects and losing confidence.        

Permits for future construction slipped 3% to a rate of 1.681 million units in May, missing the 1.73 million units that economists were expecting. 

The drop in builder confidence was reflected in the latest National Association of Homebuilder’s/Wells Fargo Housing Market Index that was released on Tuesday. The index fell two points in June to 81, a 10-month low. 

read more…

foxbusiness.com/economy/

Pending home sales up 13% | Bedford Corners Real Estate

January marked the fifth straight month that the National Association of Realtors® (NAR) has reported a decline in its Pending Home Sales Index (PHSI). The index, based on newly signed contracts for the purchase of existing homes, was down 2.8 percent from its December level.

The index in January was at 122.8 compared to 125.5 in December and has lost 10 points since August. Still, pending sales were up 13 percent compared to a year earlier. This January’s PHSI was, in fact, the highest for any January on record.  

Analysts had expected the index to be flat but individual estimates by those polled by Econoday all overshot the actual results. They covered a range from a 1.5 percent downturn to 0.5 percent growth. The consensus was for zero change.

“Pending home sales fell in January because there are simply not enough homes to match the demand on the market,” said Lawrence Yun, NAR’s chief economist. “That said, there has been an increase in permits and requests to build new homes.” Yun said that increase in single-family permits has been consistent for eight months and is a good sign that the supply and demand imbalance in the residential real estate market could be easing as soon as mid-2021.

“There will also be a natural seasonal upswing in inventory in spring and summer after few new listings during the winter months,” he said. “These trends, along with an anticipated ramp-up in home construction will provide for much-needed supply.”

Following a week where January’s existing-home sales increased, Yun noted that pending contracts are a great early indicator for upcoming closed sales but stressed that the timing of the relationship between existing-home sales and pending home sales may not be in lockstep.

“The two measurements aren’t always perfectly correlated due to varying amounts of time required to close a contract,” Yun said. “This is because a number of fallouts can occur due to a variety of factors, including a buyer not obtaining mortgage financing, a problem with a home inspection, or an appraisal issue.”

He noted that the economy is showing promising signs of improvement, and many millions of Americans are now receiving a COVID-19 vaccination. Still, he cautioned that the better economic outlook, rising inflation prospects and higher budget deficits will soon drive increases in interest rates. “I don’t foresee mortgage rates jumping to an alarming level,” he said, “but we should prepare for a rise of at least a decimal point or two.”

The Northeast PHSI fell 7.4 percent to 101.6 in January, putting it 9.6 percent higher than a year earlier. In the Midwest, the index declined 0.9 percent to 113.2, up 8.6 percent from January 2020.

Pending home sales transactions in the South inched up 0.1 percent to an index of 151.3 in January and were 17.1 percent higher year-over-year. The index in the West was at 104.6, a 7.8 percent drop from December but up 11.5 percent from a year prior.

The PHSI is based on a large national sample, typically representing about 20 percent of transactions for existing-home sales. In developing the model for the index, it was demonstrated that the level of monthly sales-contract activity parallels the level of closed existing-home sales in the following two months. Existing home sales numbers for February will be released on March 22.

An index of 100 is equal to the average level of contract activity during 2001, which was the first year to be examined. By coincidence, the volume of existing-home sales in 2001 fell within the range of 5.0 to 5.5 million, which is considered normal for the current U.S. population.

read more…

http://www.mortgagenewsdaily.com/02252021_pending_home_sales.asp

Mortgage Rates Hit Another Record Low | Bedford Corners Real Estate

Freddie Mac  released the results of its Primary Mortgage Market Survey (PMMS), showing that the 30-year fixed-rate mortgage (FRM) averaged 2.67 percent, the lowest rate in the survey’s history which dates back to 1971.

“The housing market continues to surge higher and support an otherwise stagnant economy that has lost momentum in the last couple of months,” said Sam Khater, Freddie Mac’s Chief Economist. “Mortgage rates are at record lows and pushing many prospective homebuyers off the sidelines and into the market. Homebuyer sentiment is sanguine and purchase demand shows no real signs of waning at all heading into next year.” Visit tvbedstore website where you can find the best furniture for your new house.

News Facts

  • 30-year fixed-rate mortgage averaged 2.67 percent with an average 0.7 point for the week ending December 17, 2020, down from last week when it averaged 2.71 percent. A year ago at this time, the 30-year FRM averaged 3.73 percent.
  • 15-year fixed-rate mortgage averaged 2.21 percent with an average 0.6 point, down from last week when it averaged 2.26 percent. A year ago at this time, the 15-year FRM averaged 3.19 percent.
  • 5-year Treasury-indexed hybrid adjustable-rate mortgage (ARM) averaged 2.79 percent with an average 0.3 point, unchanged from last week. A year ago at this time, the 5-year ARM averaged 3.36 percent.

The PMMS is focused on conventional, conforming, fully amortizing home purchase loans for borrowers who put 20 percent down and have excellent credit. Average commitment rates should be reported along with average fees and points to reflect the total upfront cost of obtaining the mortgage. Visit the following link for the Definitions. Borrowers may still pay closing costs which are not included in the survey.

NAR reports 12% home price increase | Bedford Corners Real Estate

Low mortgage rates and record-low housing inventory has driven home price increases throughout the year. The National Association of Realtors is saying that the median single-family home price grew year over year in all 181 metro areas it tracks.

In the U.S., median existing single-family home prices rose 12% year over year to $313,500, NAR said. In 117 metros, there were double-digit price gains from one year ago. For added perspective, in Q2, only 15 metro areas had double-digit price gains.

What can help remedy high home prices? Finding a solution to the housing inventory crisis, NARs Chief Economist Lawrence Yun said.

By the end of Q3, 1.47 million existing homes were available for sale, which is 19.2% lower than the total inventory at the end of Q3 last year. As of September 2020, there were enough homes in inventory to last 2.7 months at the current sales pace.

“As home prices increase both too quickly and too significantly, first-time buyers will increasingly face difficulty in coming up with a down payment,” Yun said. “Transforming raw land into developable lots and new supply are clearly needed to help tame the home price growth.”

Some of the metros with the biggest gains in Q3 were Bridgeport, Conn., 27.3%; Crestview, Fla., 27.1%; Pittsfield, Mass., 26.9%; Kingston, N.Y., 21.5%; and Atlantic City, N.J., 21.5%.

According to NAR, the monthly mortgage payment on a typical single-family home rose to $1,059 in Q3. As of Thursday, the average U.S. mortgage rate for a 30-year fixed loan rose to 2.84%, Freddie Mac said.

“Favorable mortgage rates will continue to bring fresh buyers to the market,” said Yun. “However, the affordability situation will not improve even with low-interest rates because housing prices are increasing much too fast.”

read more…

https://www.housingwire.com/articles/nars-yun-says-median