
Just back out of hospital in early March for home recovery. Therapist coming today.
Existing home sales down 28% | Katonah Real Estate
Existing-home sales retreated for the ninth straight month in October, according to the National Association of REALTORS®. All four major U.S. regions registered month-over-month and year-over-year declines.
Total existing-home sales,1 https://www.nar.realtor/existing-home-sales – completed transactions that include single-family homes, townhomes, condominiums and co-ops – decreased 5.9% from September to a seasonally adjusted annual rate of 4.43 million in October. Year-over-year, sales dropped by 28.4% (down from 6.19 million in October 2021).
“More potential homebuyers were squeezed out from qualifying for a mortgage in October as mortgage rates climbed higher,” said NAR Chief Economist Lawrence Yun. “The impact is greater in expensive areas of the country and in markets that witnessed significant home price gains in recent years.”
Total housing inventory2 registered at the end of October was 1.22 million units, which was down 0.8% from both September and one year ago (1.23 million). Unsold inventory sits at a 3.3-month supply at the current sales pace, up from 3.1 months in September and 2.4 months in October 2021.
“Inventory levels are still tight, which is why some homes for sale are still receiving multiple offers,” Yun added. “In October, 24% of homes received over the asking price. Conversely, homes sitting on the market for more than 120 days saw prices reduced by an average of 15.8%.”
The median existing-home price3 for all housing types in October was $379,100, a gain of 6.6% from October 2021 ($355,700), as prices rose in all regions. This marks 128 consecutive months of year-over-year increases, the longest-running streak on record.
Properties typically remained on the market for 21 days in October, up from 19 days in September and 18 days in October 2021. Sixty-four percent of homes sold in October 2022 were on the market for less than a month.
First-time buyers were responsible for 28% of sales in October, down from 29% in both September 2022 and October 2021. NAR’s 2022 Profile of Home Buyers and Sellers – released earlier this month4 – found that the annual share of first-time buyers was 26%, the lowest since NAR began tracking the data.
All-cash sales accounted for 26% of transactions in October, up from 22% in September and 24% in October 2021.
Individual investors or second-home buyers, who make up many cash sales, purchased 16% of homes in October, up from 15% in September, but down from 17% in October 2021.
Distressed sales5 – foreclosures and short sales – represented 1% of sales in October, down from 2% in September and identical to October 2021.
According to Freddie Mac, the average commitment rate(link is external) for a 30-year, conventional, fixed-rate mortgage was 6.90% in October, up from 6.11% in September. The average commitment rate across all of 2021 was 2.96%.
“Mortgage rates have come down since peaking in mid-November, so home sales may be close to reaching the bottom in the current housing cycle,” Yun said.
Realtor.com®’s Market Trends Report(link is external) in October shows that the largest year-over-year median list price growth occurred in Milwaukee (+34.5%), Miami (+25.1%) and Kansas City (+21.4%). Phoenix reported the highest increase in the share of homes that had prices reduced compared to last year (+35.9 percentage points), followed by Austin (+31.2 percentage points) and Las Vegas (+24.4 percentage points).
Single-family and Condo/Co-op Sales
Single-family home sales declined to a seasonally adjusted annual rate of 3.95 million in October, down 6.4% from 4.22 million in September and 28.2% from one year ago. The median existing single-family home price was $384,900 in October, up 6.2% from October 2021.
Existing condominium and co-op sales were recorded at a seasonally adjusted annual rate of 480,000 units in October, down 2.0% from September and 30.4% from the previous year. The median existing condo price was $331,000 in October, an annual increase of 10.1%.
“For consumers looking to buy or sell a home, having a REALTOR® by their side to navigate one of the more challenging and complex markets we’ve seen in some time will be essential to successfully completing transactions,” said NAR President Kenny Parcell, a REALTOR® from Spanish Fork, Utah, and broker-owner of Equity Real Estate Utah. “REALTORS® understand local market conditions and provide timely and trusted advice, from listing to closing.”
Regional Breakdown
Existing-home sales in the Northeast trailed off 6.6% from September to an annual rate of 570,000 in October, a decline of 23.0% from October 2021. The median price in the Northeast was $408,700, an increase of 8.0% from the previous year.
Existing-home sales in the Midwest retracted 5.3% from the previous month to an annual rate of 1,080,000 in October, falling 25.5% from the prior year. The median price in the Midwest was $274,500, up 5.9% from October 2021.
In the South, existing-home sales declined 4.8% in October from September to an annual rate of 1,980,000, a 27.2% decrease from this time last year. The median price in the South was $346,300, an increase of 8.0% from one year ago.
Existing-home sales in the West waned 9.1% from September to an annual rate of 800,000 in October, down 37.5% from one year ago. The median price in the West was $588,400, a 5.3% increase from October 2021.
The National Association of REALTORS® is America’s largest trade association, representing more than 1.5 million members involved in all aspects of the residential and commercial real estate industries.
# # #
For local information, please contact the local association of REALTORS® for data from local multiple listing services (MLS). Local MLS data is the most accurate source of sales and price information in specific areas, although there may be differences in reporting methodology.
NOTE: NAR’s Pending Home Sales Index for October is scheduled for release on November 30, and Existing-Home Sales for November will be released on December 21. Release times are 10 a.m. Eastern.
1 Existing-home sales, which include single-family, townhomes, condominiums and co-ops, are based on transaction closings from Multiple Listing Services. Changes in sales trends outside of MLSs are not captured in the monthly series. NAR benchmarks home sales periodically using other sources to assess overall home sales trends, including sales not reported by MLSs.
Existing-home sales, based on closings, differ from the U.S. Census Bureau’s series on new single-family home sales, which are based on contracts or the acceptance of a deposit. Because of these differences, it is not uncommon for each series to move in different directions in the same month. In addition, existing-home sales, which account for more than 90% of total home sales, are based on a much larger data sample – about 40% of multiple listing service data each month – and typically are not subject to large prior-month revisions.
The annual rate for a particular month represents what the total number of actual sales for a year would be if the relative pace for that month were maintained for 12 consecutive months. Seasonally adjusted annual rates are used in reporting monthly data to factor out seasonal variations in resale activity. For example, home sales volume is normally higher in the summer than in the winter, primarily because of differences in the weather and family buying patterns. However, seasonal factors cannot compensate for abnormal weather patterns.
Single-family data collection began monthly in 1968, while condo data collection began quarterly in 1981; the series were combined in 1999 when monthly collection of condo data began. Prior to this period, single-family homes accounted for more than nine out of 10 purchases. Historic comparisons for total home sales prior to 1999 are based on monthly single-family sales, combined with the corresponding quarterly sales rate for condos.
2 Total inventory and month’s supply data are available back through 1999, while single-family inventory and month’s supply are available back to 1982 (prior to 1999, single-family sales accounted for more than 90% of transactions and condos were measured only on a quarterly basis).
3 The median price is where half sold for more and half sold for less; medians are more typical of market conditions than average prices, which are skewed higher by a relatively small share of upper-end transactions. The only valid comparisons for median prices are with the same period a year earlier due to seasonality in buying patterns. Month-to-month comparisons do not compensate for seasonal changes, especially for the timing of family buying patterns. Changes in the composition of sales can distort median price data. Year-ago median and mean prices sometimes are revised in an automated process if additional data is received.
The national median condo/co-op price often is higher than the median single-family home price because condos are concentrated in higher-cost housing markets. However, in a given area, single-family homes typically sell for more than condos as seen in NAR’s quarterly metro area price reports.
4 Survey results represent owner-occupants and differ from separately reported monthly findings from NAR’s REALTORS® Confidence Index, which include all types of buyers. The annual study only represents primary residence purchases, and does not include investor and vacation home buyers. Results include both new and existing homes.
5 Distressed sales (foreclosures and short sales), days on market, first-time buyers, all-cash transactions and investors are from a monthly survey for the NAR’s REALTORS® Confidence Index, posted at nar.realtor.
read more…
nar.realtor/newsroom/
Single-Family Housing Contraction Continues | Bedford Hills Real Estate
Elevated mortgage rates, high construction costs for concrete and other building materials, and weakening demand stemming from deteriorating affordability conditions continue to act as a drag on single-family housing production.
Overall housing starts decreased 4.2% to a seasonally adjusted annual rate of 1.43 million units in October, according to data from the U.S. Department of Housing and Urban Development and the U.S. Census Bureau.
The October reading of 1.43 million starts is the number of housing units builders would begin if development kept this pace for the next 12 months. Within this overall number, single-family starts decreased 6.1% to an 855,000 seasonally adjusted annual rate. Year-to-date, single-family starts are down 7.1%. This decline mirrors the decline in the NAHB/Wells Fargo HMI, which has now contracted for 11 straight months and fallen to a level of 33. Higher interest rates in particular have reduced buyer traffic and priced out demand from the market.
This will be the first year since 2011 to post a calendar year decline for single-family starts. We are forecasting additional declines for single-family construction in 2023, which means economic slowing will expand from the residential construction market into the rest of the economy. Home prices are now falling, and there has not been a period in recent decades during which homes prices have declined and a recession has not occurred.

The multifamily sector, which includes apartment buildings and condos, decreased 1.2% to an annualized 570,000 pace but continues at a strong, likely too strong, pace. Multifamily starts will decline in 2023 as the effects of tighter financing and a rising unemployment rate takes hold.
On a regional and year-to-date basis, combined single-family and multifamily starts are 2.9% higher in the Northeast, 1.5% lower in the Midwest, 2.6% higher in the South and 5.1% lower in the West.
Overall permits decreased 2.4% to a 1.53 million unit annualized rate in October. Single-family permits decreased 3.6% to an 839,000 unit rate. Multifamily permits decreased 1% to an annualized 687,000 pace. Looking at regional permit data on a year-to-date basis, permits are 2.8% lower in the Northeast, 0.2% higher in the Midwest, 1.1% higher in the South and 4.0% lower in the West.

As an indicator of the economic impact of housing, there are now 794,000 single-family homes under construction. This is 9% higher than a year ago. However, the count of such homes is down from 828,000 in May, off 4% as starts slow. There are currently 928,000 apartments under construction (2+ unit properties), up 26% from a year ago with this number continuing to rise. Strikingly, this total is the highest level since December 1973. This volume will place downward pressure on multifamily starts in 2023.
Total housing units now under construction (single-family and multifamily combined) is 18% higher than a year ago. The number of single-family units in the construction pipeline is falling and will continue to decline in the months ahead given recent declines in buyer traffic and higher interest rates.
read more…
eyeonhousing.org
Closed Median Sale Price in Hudson Valley/NYC Markets Declined by 2.50% in October | Bedford Real Estate

NEW YORK—OneKey MLS reported a 2.50% decrease in the closed median residential sale price between September and October 2022 in its nine-county Hudson Valley/New York City regional market area.
For October 2022, OneKey MLS reported a regional closed median sale price of $585,000, representing a 2.50% decrease as compared to the reported $599,999 in September 2022.
Between September and October 2022, closed regional sales transactions, including residential, condo, and co-op sales, decreased to 4,762 from 5,330, representing a 10.70% month-over-month decline.
Six of nine counties reported a decreased closed median sale price in a month-over-month comparison, while two counties reported an increased median price, and one reported no change. The following counties reported decreases in their closed median sale price: Rockland ($532,500, -14.10%), Sullivan ($252,000, -6.50%), Westchester ($620,000, -4.00%), Nassau ($675,000, -3.60%), Bronx ($585,000, -1.70%), and Orange ($385,000, -1.30%)
Putnam ($482,450, +5.10%) and Queens ($690,000, +1.50%) reported an increased closed median sale price, while Suffolk County ($550,000, 0.00%) reported no change.
Pending sales for the Hudson Valley region totaled 1,600 as compared to 2,200 at the same time last year, a decrease of 27.3%. Sales were down in all Hudson Valley counties and in the Bronx. Westchester saw a 20.20% decrease in home sales in October as compared to October 2021; Putnam County posted an 18.50% decrease; Orange County closed sales were down 15.40%; Rockland County’s closed home sales activity fell 38.60% and Sullivan County registered a 13% decline in closed sales. The Bronx saw a 14.50% decline in closed residential home sales last month.

Long Island Market
The October 2022 closed median home price for Long Island, which includes Nassau, Suffolk, and Queens housing data recorded on OneKey MLS, was $618,250, which represents a 3.00% increase over last year’s reported median home price of $600,000.
Nassau County reported a $675,000 closed median home price in October, representing a 3.90% increase over the $650,000 closed median home price reported by the MLS last year. Suffolk County reported a closed median home price of $550,000, representing a 6.20% increase from $517,750 reported on the MLS in October 2021. Queens reported a closed median home price of $690,000, representing no change as compared to the closed median price reported on the MLS in October 2021.
The total number of available residential listings in October 2022 on the MLS was 12,164, which was down 1.00% as compared to the reported available inventory in September 2022.
Jim Speer, CEO OneKey MLS, said, “Home prices across our region are starting to decline as they’re being impacted by unpredictable market conditions. Buyers facing borrowing rates currently hovering around 7.00%, more than double the rates a year prior, are revisiting their buying choices because their purchasing power may have shifted. Gone are the days of the frenzied market.”
OneKey MLS, the largest MLS in New York, aggregates the real estate transactional data from nine counties making up the regional MLS coverage area, and reports individually on each county represented. The infographic demonstrates month-over-month closed median home price comparisons for the region.
For further detailed statistical information about residential, condo, and co-op sales transactions, please visit https://www.onekeymls.com/market-statistics
OneKey MLS, made possible by the merger of MLSLI and Hudson Gateway MLS, is one of the nation’s leading Multiple Listing Services, serving more than 45,000 Realtor subscribers and 4,300 participating offices throughout Long Island, Manhattan, and the Hudson Valley.
read more…
realestateindepth.com/news/
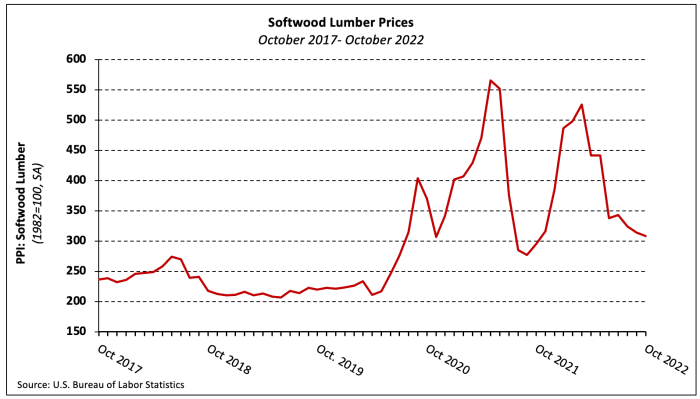
Building Materials Prices Decline for Second Consecutive Month | Pound Ridge Real Estate
The prices of building materials decreased 0.2% in October (not seasonally adjusted) following a 0.5% decline in September according to the latest Producer Price Index (PPI) report. The index has decreased four of five months for the first time since 2015. The PPI for goods inputs to residential construction, including energy, was led 0.2% higher by prices of diesel fuel (+9.5%) and unleaded gasoline (+5.7%).

The price index of services inputs to residential construction decreased 0.7% in October, the seventh consecutive monthly decline. Prices have fallen a total of 14% since the index last increased in March 2022 and are just 1.4% higher than they were a year ago.
Softwood Lumber
The PPI for softwood lumber (seasonally adjusted) fell 1.7% in October following 5.5% and 3.1% declines in August and September, respectively. Softwood lumber prices are 4.4% higher than they were a year ago but have fallen 41.3% since March. The index remains 3.0% above pre-pandemic levels.
Steel Mill Products
Steel mill products prices decreased 6.6% in October and have fallen 21.6% since May 2022. The index is at its lowest level since May 2021 after five straight monthly declines, each of which has been larger than the last.

Ready-Mix Concrete
The PPI for ready-mix concrete (RMC) increased 0.4% in October but, similar to steel mill products, the pace of increases has slowed each of the past three months. The index has climbed 9.1%, year-to-date, the largest October YTD increase in the series’ 34-year history.

The monthly increase in the national data was entirely driven by a 2.0% price increase in the Northeast region. Prices declined in the Midwest (-0.4%) and South (-0.3%) and were unchanged in the West.

Gypsum Building Materials
The PPI for gypsum building materials edged 0.2% lower in October—just the second monthly decrease since September 2020. The index is 45.6% higher than its January 2020 level.

Transportation of Freight
The price of truck, rail, and ocean transportation of freight each decreased in October. Trucking freight prices fell 1.4%–the fifth consecutive decline—while the indexes for rail and deep sea transportation of freight decreased 0.7% and 1.8%, respectively. Year-to-date, the prices of ocean, rail, and truck freight transportation have increased 25.2%, 6.5%, and 6.0%.

read more…
eyeonhousing.org
Mortgage rates drop with inflation drop | Bedford Corners Real Estate
Finally, some good news: the growth rate of inflation is cooling off for now, and with the CPI inflation report being positive, the 10-year yield fell noticeably, and mortgage rates will fall with that! So, the question is, are we reaching the peak of inflation and close to the end of the Fed rate hike cycle? Let’s take a look at today’s data.
From the CPI report: The Consumer Price Index for All Urban Consumers (CPI-U) rose 0.4 percent in October on a seasonally adjusted basis, the same increase as in September, the U.S. Bureau of Labor Statistics reported today. Over the last 12 months, the all-items index increased 7.7 percent before seasonal adjustment.
The estimates for the CPI inflation data were for 7.9% year-over-year growth. Some people in the markets had speculated that the data would come in even hotter than anticipated —some whisper numbers were for 8.2% – 8.4% year-over-year growth. This of course led some people to believe that bond yields and mortgage rates would go much higher today.
However, the report came in at 7.7% — lower even than the forecast. As a result, mortgage rates went from 7.37% yesterday to 6.67% as of this writing.
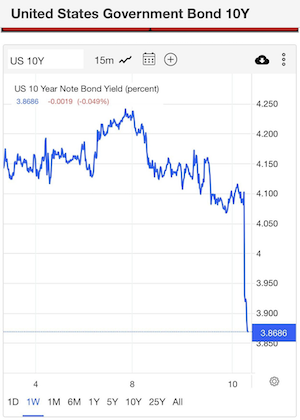
On Thursday morning, the 10-year yield had a big rally, and bond yields headed lower (see above) and mortgage rates will be below 7% today. What a difference a year makes — now we’re excited to see mortgage rates getting below 7%! But it makes sense when you consider that over the last 52 weeks, mortgage rates have ranged from 3.14% to 7.37%.
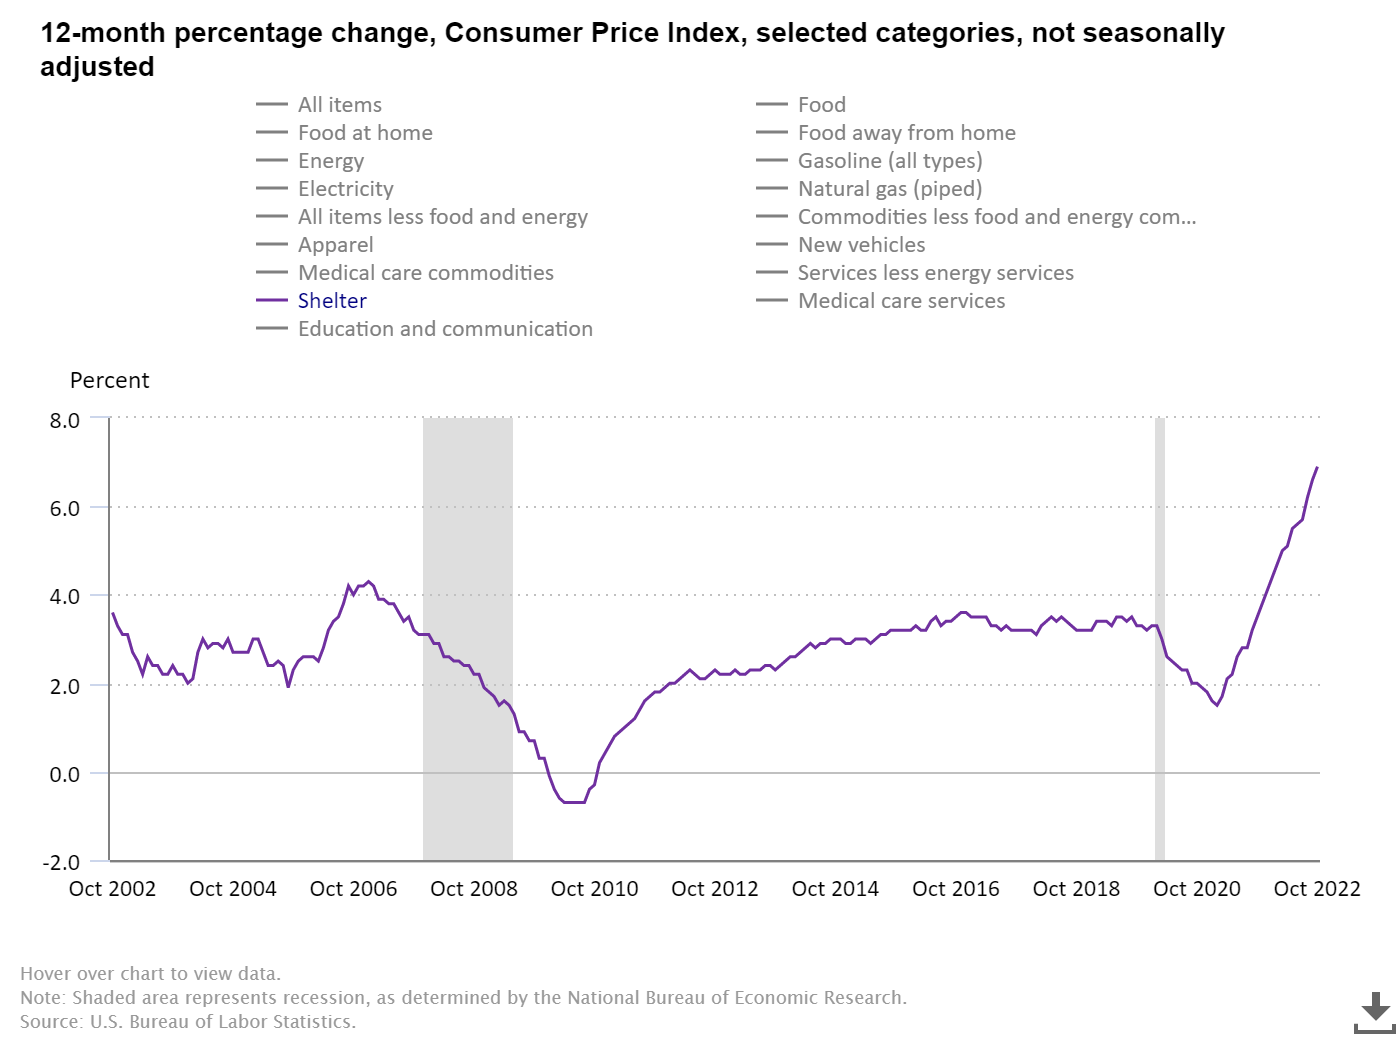
One of my talking points with inflation data is that the biggest driver of core inflation is shelter, and this data line lags. It lagged back in August 2020 when it was still down, and it’s crawling now on the CPI data.
We already have more current data lines to show that the growth rate of inflation is cooling off. Some Federal Reserve members have commented on the fact that they know the shelter inflation data on the CPI lags — that’s a positive. Some people feared the Federal Reserve didn’t understand the lag in the CPI data, but this doesn’t appear to be the case.
So, we need to understand that the CPI shelter data lags, and the cooldown will be more of a 2023 story, especially in the second half of the year. Back in September, I went on CNBC before the CPI report came out to make this point and explain that shelter inflation did have legs to grow but the growth rate couldn’t be sustained.
Shelter CPI inflation data
As we can see in the graph below, the growth rate of shelter inflation is moving up and this has the potential to keep going higher. One thing to remember is that we have 910,000 two-unit housing that will come on line in 2023 and this will help cool the growth rate of inflation down next year. We already see the growth rate of shelter cooling off in the data lines that are more current, so this will be a positive story in 2023.
When this data line starts to cool down, it will be the biggest factor in core inflation cooling down. This is why I wrote about how we all need to root for housing completion data to get better so we get more supply into the marketplace. The best way to deal with housing inflation is more supply, and we have a lot of two-unit construction in the pipeline.
We see some inflation data cooling off recent peaks; food and energy are not part of core inflation data as they can have wild swings. As we can see below the growth rate of the Mad Max inflationary basket is cooling off, mostly due to energy prices coming off the recent highs.
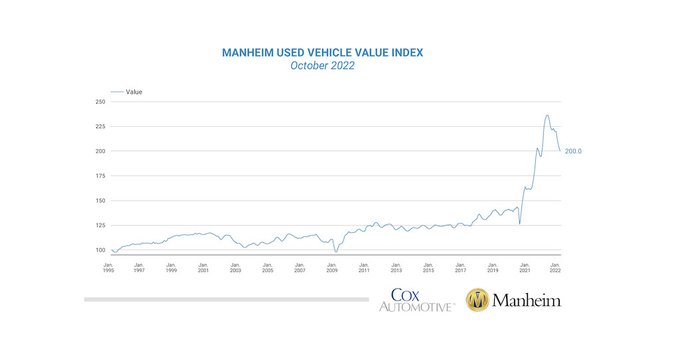
Other inflationary data is also cooling off. We all know that used car prices exploded during the pandemic as supply crashed. That is already changing and has room to go lower. If you’re trying to defeat inflation by killing demand and losing jobs, you don’t have the proper supply in the market.
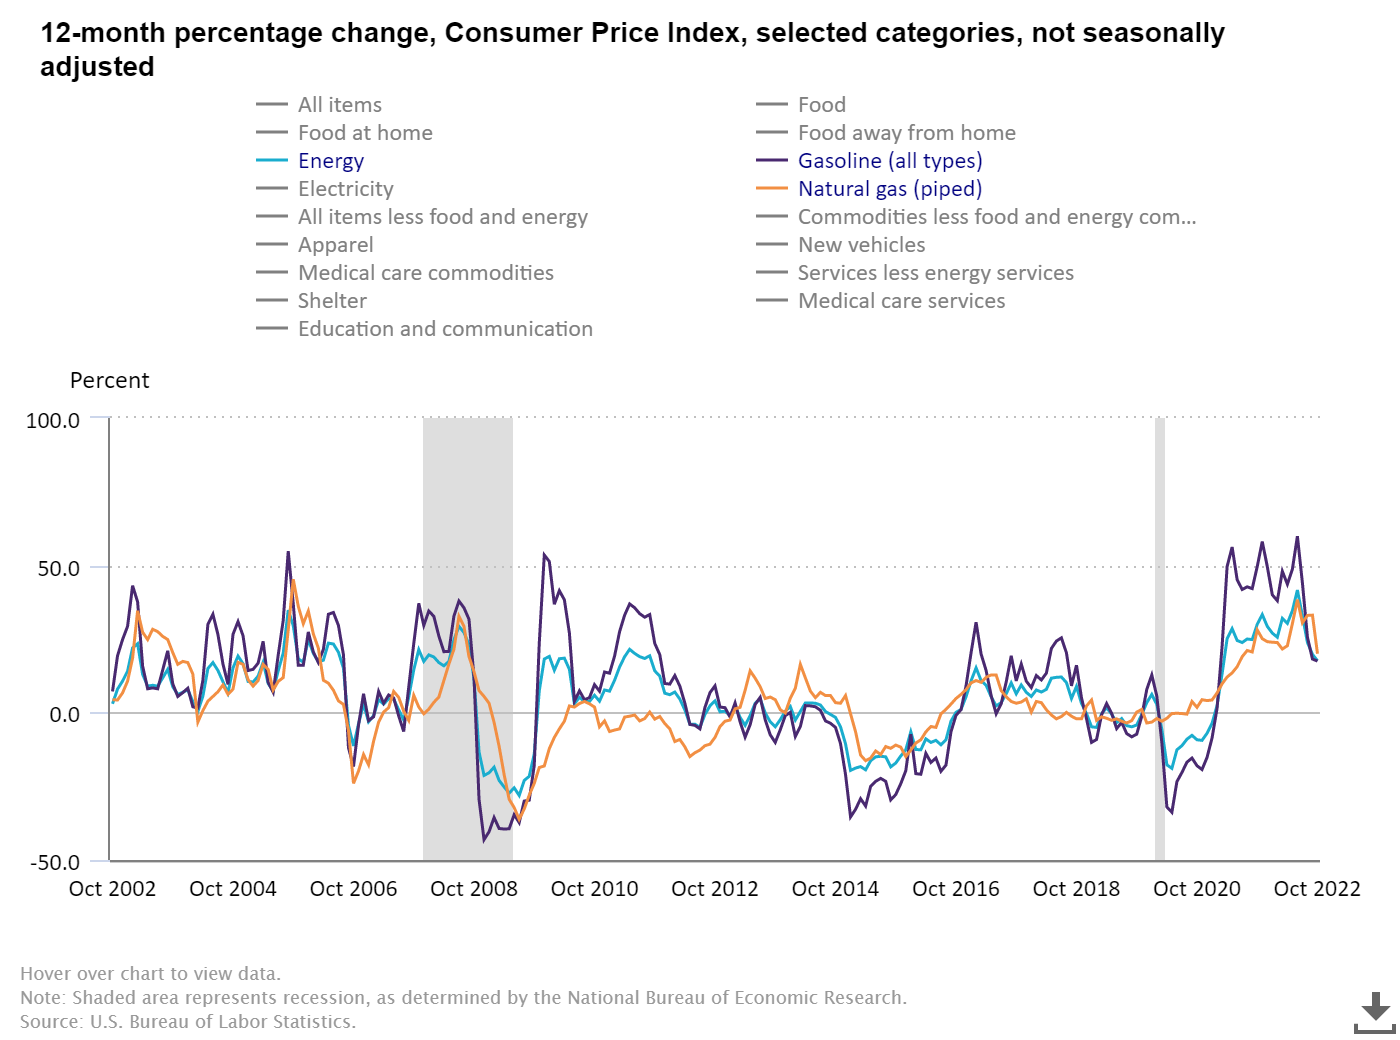
The history of global pandemics traditionally means supply chains are stressed for two years. Now that we are all walking the earth freely (outside of China), the production supply levels are returning to normal.
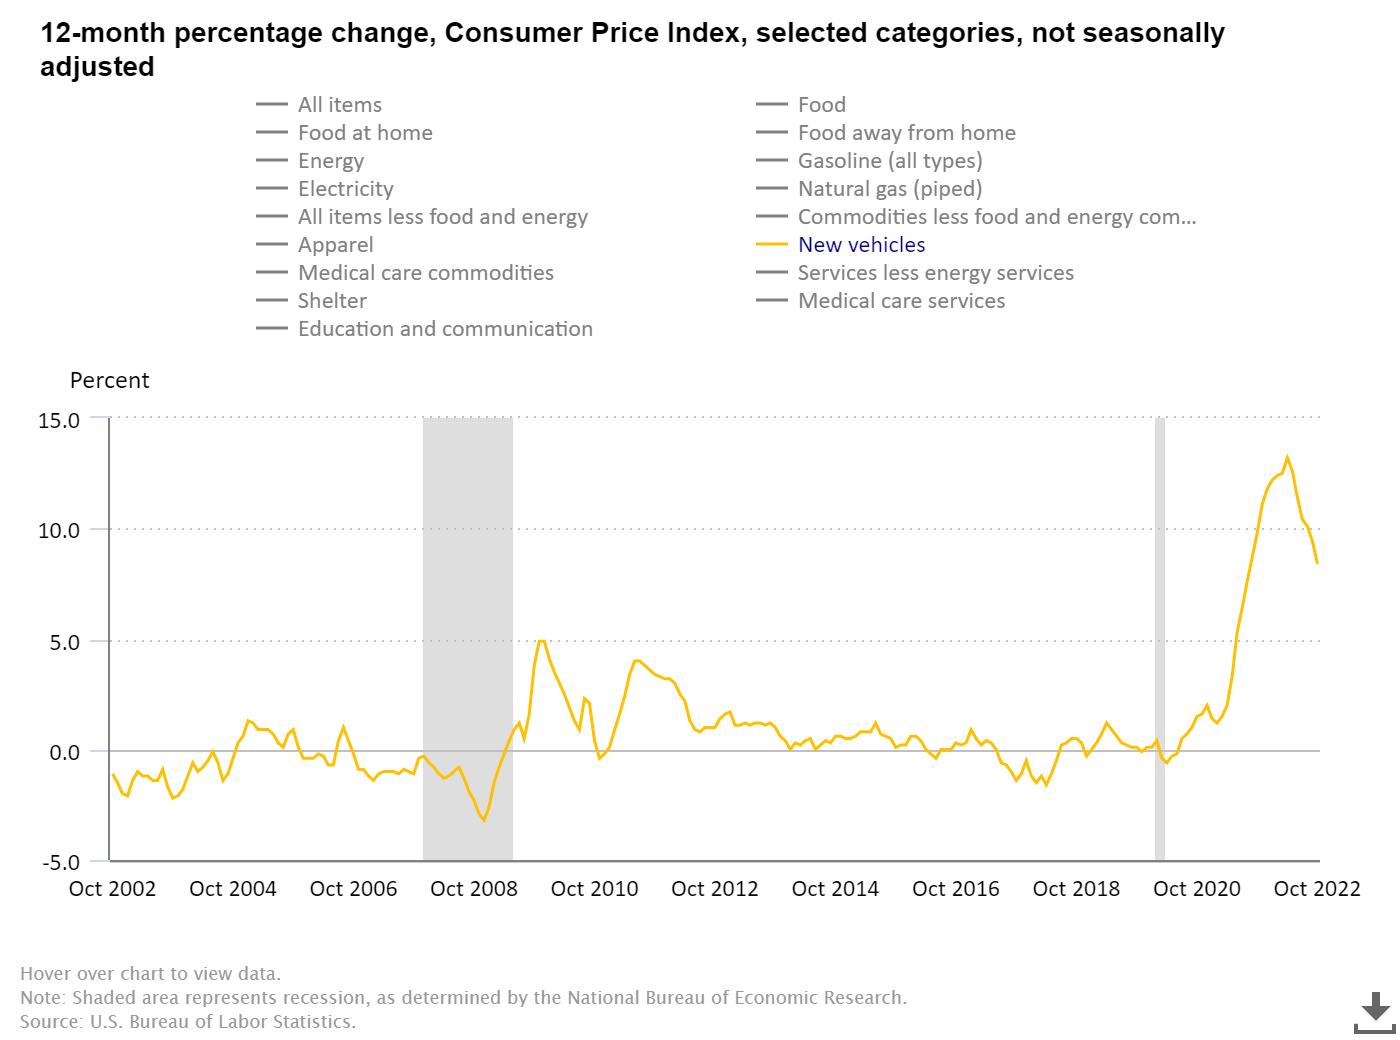
For today’s CPI report, the new vehicle price index, which also went parabolic during the pandemic, is coming down. Again, the best way to deal with inflation is to get more supply in the market.
So does this data represent a turning point? Have we seen the peak growth rate in inflation?
I would say this about this topic. Last year at this time the growth rate of a lot of inflationary data was still rising and then, on top of everything else, we had the Russian Invasion of Ukraine in February. Since then we have had massive Fed rate hikes in the system and the biggest driver of core inflation in America is set to cool down in 2023. Those facts are here today where they weren’t in November of 2021.
But, the Federal Reserve feels pressure to create a job-loss recession to get the inflation data back down toward 2% and even with today’s CPI inflation data being lower, they’re still going to push us into a job-loss recession.
I raised my sixth and final recession red flag as of Aug. 5, but I did write about two ways we could still avoid a nasty job loss recession. Here are two things that I would be looking for:
1. Rates fall to get the housing sector back in line.
Mortgage rates falling toward 5% can stabilize housing if they have duration. Traditionally, mortgage rates below 4% boost housing demand. The bleeding needs to stop and what we have seen in the data is that buyers did come into the housing market when rates got back down toward 5%.
However, 5% rates didn’t stay for long as the Federal Reserve found this to be counter-productive for their job loss recession to happen. We need to see lower rates and have it stick for some time for it to be more useful to get the housing market out of recession.
2. The inflation growth rate falls, and the Fed stops hiking rates and reverses course, as it did in 2018.
Some inflation data is already cooling off and will find its way into the data lines. However, rent inflation won’t come down in the data until 2023, even though we already see some change in that sector.
Since all my six recession flags are up, I am keeping a close eye on the jobless claims data, which rose today — this is the last data line that is preventing the economy from falling into a job-loss recession as so far, the honey badger labor market is holding up.
So for today, this is a small victory, but we will need many more months to change this economy.
read more…
housingwire.com/articles/
NAR reports home prices up 8.6% | Chappaqua Real Estate
An overwhelming majority of metro markets saw home price gains in the third quarter of 2022 despite mortgage rates that approached 7% and declining sales, according to the National Association of Realtors’ latest quarterly report released on Nov. 10. Forty-six percent of the 185 tracked metro areas registered double-digit price increases, down from 80% in the second quarter of this year.
The national median single-family existing-home price climbed 8.6% from a year ago to $398,500. Year-over-year price appreciation decelerated when compared to the previous quarter’s 14.2%.
“Much lower buying capacity has slowed home price growth and the trend will continue until mortgage rates stop rising,” said NAR Chief Economist Lawrence Yun. “The median income needed to buy a typical home has risen to $88,300—that’s almost $40,000 more than it was prior to the start of the pandemic, back in 2019.”
Among the major U.S. regions, the South registered the largest share of single-family existing-home sales (44%) and the greatest year-over-year price appreciation (11.9%) in the third quarter. Prices elevated 8.2% in the Northeast, 7.4% in the West, and 6.6% in the Midwest.
The top 10 metro areas with the largest year-over-year price increases all recorded gains greater than 18%, with seven of those markets in Florida. Those include North Port-Sarasota-Bradenton, FL (23.8%); Lakeland-Winter Haven, FL (21.2%); Myrtle Beach-Conway-North Myrtle Beach, SC-NC (21.1%); Panama City, FL (20.5%); Deltona-Daytona Beach-Ormond Beach, FL (19.6%); Port St. Lucie, FL (19.4%); Greenville-Anderson-Mauldin, SC (18.9%); Kingsport-Bristol-Bristol, TN.-VA(18.8%); Tampa-St. Petersburg-Clearwater, FL (18.8%); and Ocala, FL (18.8%).
Half of the top 10 most expensive markets in the U.S. were in California, including San Jose-Sunnyvale-Santa Clara, CA ($1,688,000; 2.3%); San Francisco-Oakland-Hayward, CA ($1,300,000; -3.7%); Anaheim-Santa Ana-Irvine, CA ($1,200,000; 9.1%); Urban Honolulu, HI ($1,127,400; 7.6%); San Diego-Carlsbad, CA ($900,000; 5.9%); Los Angeles-Long Beach-Glendale, CA ($893,200; 3.8%); Boulder, CO ($826,900; 7.5%); Naples-Immokalee-Marco Island, FL ($746,600; 16.7%); Seattle-Tacoma-Bellevue, WA ($741,300; 4.6%); and Boston-Cambridge-Newton, MA-NH($698,900; 6.2%).
“The more expensive markets on the West Coast will likely experience some price declines following this rapid price appreciation, which is the result of many years of limited home building,” Yun added. “The Midwest, with relatively affordable home prices, will likely continue to see price gains as incomes and rents both rise.”
In the third quarter of 2022, stubbornly high home prices and increasing mortgage rates reduced housing affordability. The monthly mortgage payment on a typical existing single-family home with a 20% down payment was $1,840. This represents a marginal increase from the second quarter of this year ($1,837), but a significant jump of $614—or 50%—from one year ago. Families typically spent 25% of their income on mortgage payments, down from 25.3% in the prior quarter, but up from 17.2% one year ago.
“A return to a normal spread between the government borrowing rate and the home purchase borrowing rate will bring the 30-year mortgage rates down to around 6%,” Yun said. “The usual spread between the 10-year Treasury yield and the 30-year mortgage rate is between 150 to 200 basis points, rather than the current spread of 300 basis points.”
First-time buyers looking to purchase a typical home during the third quarter of 2022 continued to feel the impact of housing’s growing unaffordability. For a typical starter home valued at $338,700 with a 10% down payment loan, the monthly mortgage payment rose to $1,808 – nearly identical to the previous quarter ($1,807), but an increase of almost $600, or 49%, from one year ago ($1,210). First-time buyers typically spent 37.8% of their family income on mortgage payments, up from 36.8% in the previous quarter. A mortgage is considered unaffordable if the monthly payment (principal and interest) amounts to more than 25% of the family’s income.
A family needed a qualifying income of at least $100,000 to afford a 10% down payment mortgage in 59 markets, up from 53 in the prior quarter. Yet, a family needed a qualifying income of less than $50,000 to afford a home in 17 markets, down from 23 in the previous quarter.
read more…
realestateindepth.com/news/
Mortgage rates average 6.95% | Armonk Real Estate
Freddie Mac today released the results of its Primary Mortgage Market Survey® (PMMS®), showing the 30-year fixed-rate mortgage (FRM) averaged 6.95 percent.
“Mortgage rates continue to hover around seven percent, as the dynamics of a once-hot housing market have faded considerably,” said Sam Khater, Freddie Mac’s Chief Economist. “Unsure buyers navigating an unpredictable landscape keeps demand declining while other potential buyers remain sidelined from an affordability standpoint. Yesterday’s interest rate hike by the Federal Reserve will certainly inject additional lead into the heels of the housing market.”
News Facts
- 30-year fixed-rate mortgage averaged 6.95 percent with an average 0.8 point as of November 3, 2022, down from last week when it averaged 7.08 percent. A year ago at this time, the 30-year FRM averaged 3.09 percent.
- 15-year fixed-rate mortgage averaged 6.29 percent with an average 1.2 point, down from last week when it averaged 6.36 percent. A year ago at this time, the 15-year FRM averaged 2.35 percent.
- 5-year Treasury-indexed hybrid adjustable-rate mortgage (ARM) averaged 5.95 percent with an average 0.2 point, down from last week when it averaged 5.96 percent. A year ago at this time, the 5-year ARM averaged 2.54 percent.
The PMMS® is focused on conventional, conforming, fully amortizing home purchase loans for borrowers who put 20 percent down and have excellent credit. Average commitment rates should be reported along with average fees and points to reflect the total upfront cost of obtaining the mortgage. Visit the following link for the Definitions. Borrowers may still pay closing costs which are not included in the survey.
NOTE: Freddie Mac is making a number of enhancements to the PMMS to improve the collection, quality and diversity of data used. Instead of surveying lenders, the weekly results will be based on applications received from thousands of lenders across the country that are submitted to Freddie Mac when a borrower applies for a mortgage. Additionally, we will no longer publish fees/points or adjustable rates. The newly recast PMMS will be put in place on November 17, 2022, and the weekly distribution will be Thursdays at 12 p.m. ET.
Pending home sales fall 31% | Mt Kisco Real Estate
Key Highlights
- Pending home sales dropped for the fourth straight month, down 10.2% from August.
- Month-over-month, contract signings pulled back in all four major U.S. regions.
- Pending sales decreased in all regions compared to one year ago.
Pending home sales trailed off for the fourth consecutive month in September, according to the National Association of Realtors. All four major regions recorded month-over-month and year-over-year declines in transactions.
The Pending Home Sales Index (PHSI),* www.nar.realtor/pending-home-sales, a forward-looking indicator of home sales based on contract signings, slumped 10.2% to 79.5 in September. Year-over-year, pending transactions slid by 31.0%. An index of 100 is equal to the level of contract activity in 2001.
“Persistent inflation has proven quite harmful to the housing market,” said NAR Chief Economist Lawrence Yun. “The Federal Reserve has had to drastically raise interest rates to quell inflation, which has resulted in far fewer buyers and even fewer sellers.”
Yun noted that new home listings are down compared to one year ago since many homeowners are unwilling to give up the rock-bottom, 3% mortgage rates that they locked in prior to this year.
“The new normal for mortgage rates could be around 7% for a while,” Yun added. “On a $300,000 loan, that translates to a typical monthly mortgage payment of nearly $2,000, compared to $1,265 just one year ago – a difference of more than $700 per month. Only when inflation is tamed will mortgage rates retreat and boost home purchasing power for buyers.”
Pending Home Sales Regional Breakdown
The Northeast PHSI descended 16.2% from last month to 64.2, a decline of 30.1% from September 2021. The Midwest index retracted 8.8% to 80.7 in September, down 26.7% from one year ago.
The South PHSI faded 8.1% to 97.0 in September, a drop of 30.0% from the prior year. The West index slipped by 11.7% in September to 62.7, down 38.7% from September 2021.
The National Association of Realtors® is America’s largest trade association, representing more than 1.5 million members involved in all aspects of the residential and commercial real estate industries.
# # #
*The Pending Home Sales Index is a leading indicator for the housing sector, based on pending sales of existing homes. A sale is listed as pending when the contract has been signed but the transaction has not closed, though the sale usually is finalized within one or two months of signing.
Pending contracts are good early indicators of upcoming sales closings. However, the amount of time between pending contracts and completed sales is not identical for all home sales. Variations in the length of the process from pending contract to closed sale can be caused by issues such as buyer difficulties with obtaining mortgage financing, home inspection problems, or appraisal issues.
The index is based on a sample that covers about 40% of multiple listing service data each month. In developing the model for the index, it was demonstrated that the level of monthly sales-contract activity parallels the level of closed existing-home sales in the following two months.
An index of 100 is equal to the average level of contract activity during 2001, which was the first year to be examined. By coincidence, the volume of existing-home sales in 2001 fell within the range of 5.0 to 5.5 million, which is considered normal for the current U.S. population.
NOTE: Existing-Home Sales for October will be reported on November 18. The next Pending Home Sales Index will be on November 30. All release times are 10 a.m. Eastern.
Information about NAR is available at nar.realtor. This and other news releases are posted in the newsroom at nar.realtor/newsroom. Statistical data in this release, as well as other tables and surveys, are posted in the “Research and Statistics” tab.

InfographicPending Home Sales: September 2022
Related Links
Case Shiller home prices up only 13.1% | South Salem Real Estate
Home prices continue to be higher than they were a year ago, but they are contracting at the fastest pace on record, according to the S&P CoreLogic Case-Shiller Home Price Index, as the housing market struggles under sharply higher interest rates.
Prices in August were 13% higher nationally compared with August 2021, according to the index, down from a 15.6% annual gain in July. The 2.6 percentage difference between the two months is the largest gap in the index’s history, first launched in 1987.
This means home prices are coming down at a record pace.
The 10-city composite, which tracks the biggest housing markets in the United States, rose 12.1% year over year in August, versus a 14.9% gain in July. The 20-city composite was up 13.1% for the month of August, compared with a 16% increase the prior month.
“The forceful deceleration in U.S. housing prices that we noted a month ago continued in our report for August 2022,” said Craig Lazzara, managing director at S&P DJI, in a statement. “Price gains decelerated in every one of our 20 cities. These data show clearly that the growth rate of housing prices peaked in the spring of 2022 and has been declining ever since.”
Miami, Tampa and Charlotte were the top three U.S. cities leading the price gains in August, with year-over-year increases of 28.6%, 28% and 21.3%, respectively. All 20 cities reported lower price increases in the year ending in August versus the year ending in July.
The West Coast saw the largest monthly declines, with San Francisco (-4.3%), Seattle (-3.9%) and San Diego (-2.8%) falling the most.
A quick jump in mortgage rates from record lows this year has seriously tamped down the once red-hot housing market. The average 30-year fixed home loan interest rate at the beginning of 2022 was about 3%. By June it was just over 6% and it is now just above 7%.
The cooling house price inflation was underscored by a separate report from the Federal Housing Finance Agency showing home prices increased 11.9% in the 12 months through August after rising 13.9% in July. Prices fell 0.7% on a monthly basis.
The Fed, staging an aggressive battle with the fastest rising inflation in 40 years, has raised its benchmark overnight interest rate from near zero in March to the current range of 3.00% to 3.25%, the swiftest pace of policy tightening in a generation or more.
That rate is likely to end the year in the mid-4% range, based on Fed officials’ own projections and recent comments.
Data last week showed sales of previously owned homes declined for an eighth straight month in September.
Read more…