An overwhelming majority of metro markets saw home price gains in the third quarter of 2022 despite mortgage rates that approached 7% and declining sales, according to the National Association of Realtors’ latest quarterly report released on Nov. 10. Forty-six percent of the 185 tracked metro areas registered double-digit price increases, down from 80% in the second quarter of this year.
The national median single-family existing-home price climbed 8.6% from a year ago to $398,500. Year-over-year price appreciation decelerated when compared to the previous quarter’s 14.2%.
“Much lower buying capacity has slowed home price growth and the trend will continue until mortgage rates stop rising,” said NAR Chief Economist Lawrence Yun. “The median income needed to buy a typical home has risen to $88,300—that’s almost $40,000 more than it was prior to the start of the pandemic, back in 2019.”
Among the major U.S. regions, the South registered the largest share of single-family existing-home sales (44%) and the greatest year-over-year price appreciation (11.9%) in the third quarter. Prices elevated 8.2% in the Northeast, 7.4% in the West, and 6.6% in the Midwest.
The top 10 metro areas with the largest year-over-year price increases all recorded gains greater than 18%, with seven of those markets in Florida. Those include North Port-Sarasota-Bradenton, FL (23.8%); Lakeland-Winter Haven, FL (21.2%); Myrtle Beach-Conway-North Myrtle Beach, SC-NC (21.1%); Panama City, FL (20.5%); Deltona-Daytona Beach-Ormond Beach, FL (19.6%); Port St. Lucie, FL (19.4%); Greenville-Anderson-Mauldin, SC (18.9%); Kingsport-Bristol-Bristol, TN.-VA(18.8%); Tampa-St. Petersburg-Clearwater, FL (18.8%); and Ocala, FL (18.8%).
Half of the top 10 most expensive markets in the U.S. were in California, including San Jose-Sunnyvale-Santa Clara, CA ($1,688,000; 2.3%); San Francisco-Oakland-Hayward, CA ($1,300,000; -3.7%); Anaheim-Santa Ana-Irvine, CA ($1,200,000; 9.1%); Urban Honolulu, HI ($1,127,400; 7.6%); San Diego-Carlsbad, CA ($900,000; 5.9%); Los Angeles-Long Beach-Glendale, CA ($893,200; 3.8%); Boulder, CO ($826,900; 7.5%); Naples-Immokalee-Marco Island, FL ($746,600; 16.7%); Seattle-Tacoma-Bellevue, WA ($741,300; 4.6%); and Boston-Cambridge-Newton, MA-NH($698,900; 6.2%).
“The more expensive markets on the West Coast will likely experience some price declines following this rapid price appreciation, which is the result of many years of limited home building,” Yun added. “The Midwest, with relatively affordable home prices, will likely continue to see price gains as incomes and rents both rise.”
In the third quarter of 2022, stubbornly high home prices and increasing mortgage rates reduced housing affordability. The monthly mortgage payment on a typical existing single-family home with a 20% down payment was $1,840. This represents a marginal increase from the second quarter of this year ($1,837), but a significant jump of $614—or 50%—from one year ago. Families typically spent 25% of their income on mortgage payments, down from 25.3% in the prior quarter, but up from 17.2% one year ago.
“A return to a normal spread between the government borrowing rate and the home purchase borrowing rate will bring the 30-year mortgage rates down to around 6%,” Yun said. “The usual spread between the 10-year Treasury yield and the 30-year mortgage rate is between 150 to 200 basis points, rather than the current spread of 300 basis points.”
First-time buyers looking to purchase a typical home during the third quarter of 2022 continued to feel the impact of housing’s growing unaffordability. For a typical starter home valued at $338,700 with a 10% down payment loan, the monthly mortgage payment rose to $1,808 – nearly identical to the previous quarter ($1,807), but an increase of almost $600, or 49%, from one year ago ($1,210). First-time buyers typically spent 37.8% of their family income on mortgage payments, up from 36.8% in the previous quarter. A mortgage is considered unaffordable if the monthly payment (principal and interest) amounts to more than 25% of the family’s income.
A family needed a qualifying income of at least $100,000 to afford a 10% down payment mortgage in 59 markets, up from 53 in the prior quarter. Yet, a family needed a qualifying income of less than $50,000 to afford a home in 17 markets, down from 23 in the previous quarter.
Through July 2022 with Forecasts through July 2023
Introduction
The CoreLogic Home Price Insights report features an interactive view of our Home Price Index product with analysis through July 2022 with forecasts through July 2023.
CoreLogic HPI™ is designed to provide an early indication of home price trends. The indexes are fully revised with each release and employ techniques to signal turning points sooner. CoreLogic HPI Forecasts™ (with a 30-year forecast horizon), project CoreLogic HPI levels for two tiers—Single-Family Combined (both Attached and Detached) and Single-Family Combined excluding distressed sales.
The report is published monthly with coverage at the national, state and Core Based Statistical Area (CBSA)/Metro level and includes home price indices (including distressed sales); home price forecast and market condition indicators. The data incorporates more than 40 years of repeat-sales transactions for analyzing home price trends.
HPI National Change
July 2022 National Home Prices
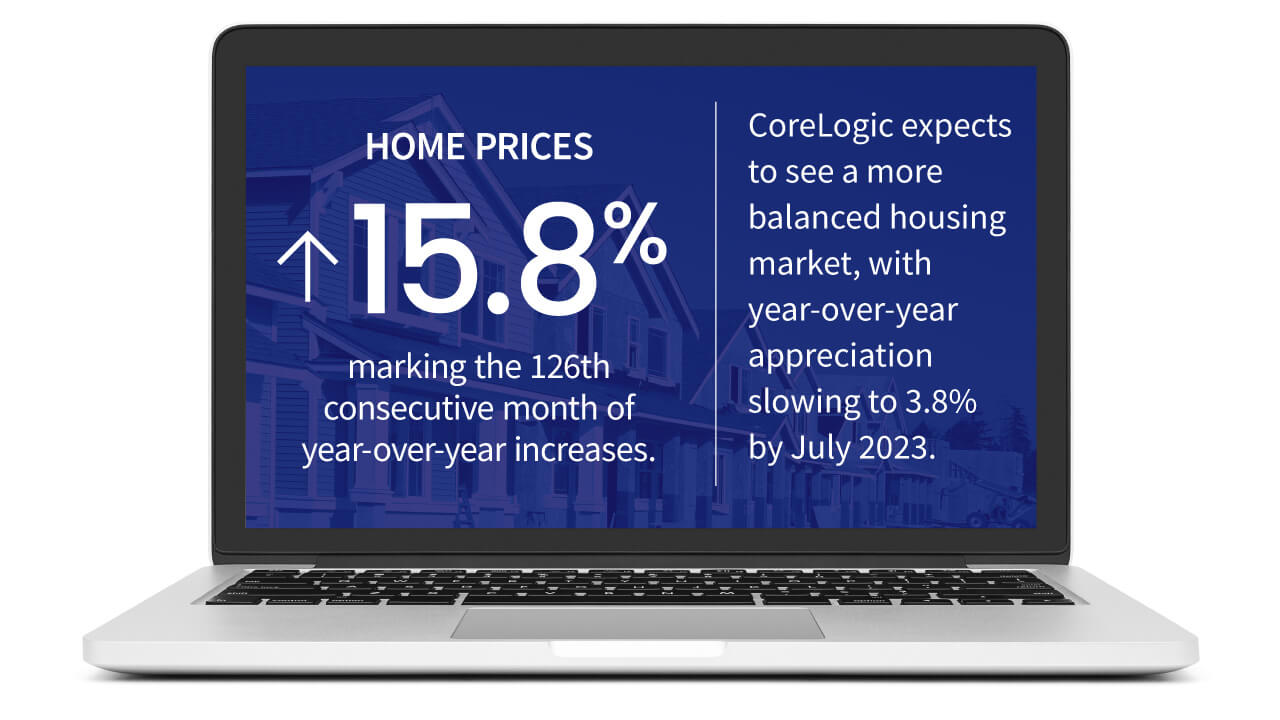
Home prices nationwide, including distressed sales, increased year over year by 15.8% in July 2022 compared with July 2021. On a month-over-month basis, home prices declined by 0.3% in July 2022 compared with June 2022 (revisions with public records data are standard, and to ensure accuracy, CoreLogic incorporates the newly released public data to provide updated results).
Forecast Prices Nationally
The CoreLogic HPI Forecast indicates that home prices will increase on a month-over-month basis by 0.3% from July 2022 to August 2022 and on a year-over-year basis by 3.8% from July 2022 to July 2023.
HPI & Case-Shiller Trends
This graph shows a comparison of the national year-over-year percent change for the CoreLogic HPI and CoreLogic Case-Shiller Index from 2000 to present month with forecasts one year into the future. We note that both the CoreLogic HPI Single Family Combined tier and the CoreLogic Case-Shiller Index are posting positive, but moderating year-over-year percent changes, and forecasting gains for the next year.
Housing Market Showing Signs of Better Balance
Annual home price growth slowed for the third consecutive month in July but remained elevated at 15.8%. As 30-year, fixed-rate mortgages neared 6% this summer, some prospective homebuyers pulled back, helping ease overheated and unsustainable price growth. Notably, home prices declined by 0.3% from June to July, a trend not seen between 2010 and 2019, when price increases averaged 0.5% between those two months, according to CoreLogic’s historic data. Looking ahead, CoreLogic expects to see a more balanced housing market, with year-over-year appreciation slowing to 3.8% by July 2023.
“Following June’s surge in mortgage rates and the resulting dampening effect on housing demand, price growth is taking a decisive turn. And even though annual price growth remains in double digits, the month-over-month decline suggests further deceleration on the horizon. The higher cost of homeownership has clearly eroded affordability, as inflation-adjusted monthly mortgage expenses are now even higher than they were at their former peak in 2006.”
– Selma Hepp Interim Lead, Deputy Chief Economist for CoreLogic
HPI National and State Maps – July 2022
The CoreLogic HPI provides measures for multiple market segments, referred to as tiers, based on property type, price, time between sales, loan type (conforming vs. non-conforming) and distressed sales. Broad national coverage is available from the national level down to ZIP Code, including non-disclosure states.
Nationally, home prices increased 15.8% year over year in July. No states posted an annual decline in home prices. The states with the highest increases year over year were Florida (29.6%), South Dakota (23.7%) and Tennessee (23.2%).
HPI Top 10 Metros Change
The CoreLogic HPI provides measures for multiple market segments, referred to as tiers, based on property type, price, time between sales, loan type (conforming vs. non-conforming) and distressed sales. Broad national coverage is available from the national level down to ZIP Code, including non-disclosure states.
These large cities continued to experience price increases in July, with Miami on top at 27.1% year over year.
Markets to Watch: Top Markets at Risk of Home Price Decline
The CoreLogic Market Risk Indicator (MRI), a monthly update of the overall health of housing markets across the country, predicts that Bremerton-Silverdale, WA is at a very high risk (70%-plus probability) of a decline in home prices over the next 12 months. Crestview-Fort Walton Beach-Destin, FL; Bellingham, WA; Reno, NV and Boise City, ID are also at very high risk for price declines.
Summary
CoreLogic HPI features deep, broad coverage, including non-disclosure state data. The index is built from industry-leading real-estate public record, servicing, and securities databases—including more than 40 years of repeat-sales transaction data—and all undergo strict pre-boarding assessment and normalization processes.
CoreLogic HPI and HPI Forecasts both provide multi-tier market evaluations based on price, time between sales, property type, loan type (conforming vs. non-conforming) and distressed sales, helping clients hone in on price movements in specific market segments.
Updated monthly, the index is the fastest home-price valuation information in the industry—complete home-price index datasets five weeks after month’s end. The Index is completely refreshed each month—all pricing history from 1976 to the current month—to provide the most up-to-date, accurate indication of home-price movements available.
Methodology
The CoreLogic HPI™is built on industry-leading public record, servicing and securities real-estate databases and incorporates more than 40 years of repeat-sales transactions for analyzing home price trends. Generally released on the first Tuesday of each month with an average five-week lag, the CoreLogic HPI is designed to provide an early indication of home price trends by market segment and for the “Single-Family Combined” tier, representing the most comprehensive set of properties, including all sales for single-family attached and single-family detached properties. The indices are fully revised with each release and employ techniques to signal turning points sooner. The CoreLogic HPI provides measures for multiple market segments, referred to as tiers, based on property type, price, time between sales, loan type (conforming vs. non-conforming) and distressed sales. Broad national coverage is available from the national level down to ZIP Code, including non-disclosure states.
CoreLogic HPI Forecasts™are based on a two-stage, error-correction econometric model that combines the equilibrium home price—as a function of real disposable income per capita—with short-run fluctuations caused by market momentum, mean-reversion, and exogenous economic shocks like changes in the unemployment rate. With a 30-year forecast horizon, CoreLogic HPI Forecasts project CoreLogic HPI levels for two tiers — “Single-Family Combined” (both attached and detached) and “Single-Family Combined Excluding Distressed Sales.” As a companion to the CoreLogic HPI Forecasts, Stress-Testing Scenarios align with Comprehensive Capital Analysis and Review (CCAR) national scenarios to project five years of home prices under baseline, adverse and severely adverse scenarios at state, metropolitan areas and ZIP Code levels. The forecast accuracy represents a 95% statistical confidence interval with a +/- 2% margin of error for the index.
About Market Risk Indicator
Market Risk Indicators are a subscription-based analytics solution that provide monthly updates on the overall “health” of housing markets across the country. CoreLogic data scientists combine world-class analytics with detailed economic and housing data to help determine the likelihood of a housing bubble burst in 392 major metros and all 50 states. Market Risk Indicators is a multi-phase regression model that provides a probability score (from 1 to 100) on the likelihood of two scenarios per metro: a >10% price reduction and a ≤ 10% price reduction. The higher the score, the higher the risk of a price reduction.
Source: CoreLogic The data provided are for use only by the primary recipient or the primary recipient’s publication or broadcast. This data may not be resold, republished or licensed to any other source, including publications and sources owned by the primary recipient’s parent company without prior written permission from CoreLogic. Any CoreLogic data used for publication or broadcast, in whole or in part, must be sourced as coming from CoreLogic, a data and analytics company. For use with broadcast or web content, the citation must directly accompany first reference of the data. If the data are illustrated with maps, charts, graphs or other visual elements, the CoreLogic logo must be included on screen or website.
For questions, analysis or interpretation of the data, contact Robin Wachner at newsmedia@corelogic.com. Data provided may not be modified without the prior written permission of CoreLogic. Do not use the data in any unlawful manner. The data are compiled from public records, contributory databases and proprietary analytics, and its accuracy is dependent upon these sources.
About CoreLogic
CoreLogic is a leading global property information, analytics and data-enabled solutions provider. The company’s combined data from public, contributory and proprietary sources includes over 4.5 billion records spanning more than 50 years, providing detailed coverage of property, mortgages and other encumbrances, consumer credit, tenancy, location, hazard risk and related performance information. The markets CoreLogic serves include real estate and mortgage finance, insurance, capital markets, and the public sector. CoreLogic delivers value to clients through unique data, analytics, workflow technology, advisory and managed services. Clients rely on CoreLogic to help identify and manage growth opportunities, improve performance and mitigate risk. Headquartered in Irvine, Calif., CoreLogic operates in North America, Western Europe and Asia Pacific. For more information, please visit www.corelogic.com.
CORELOGIC, the CoreLogic logo, CoreLogic HPI, CoreLogic HPI Forecast and HPI are trademarks of CoreLogic, Inc. and/or its subsidiaries.
Rising inflation and higher mortgage rates are slowing traffic of prospective home buyers and putting a damper on builder sentiment. In a troubling sign for the housing market, builder confidence in the market for newly built single-family homes posted its sixth straight monthly decline in June, falling two points to 67, according to the National Association of Home Builders (NAHB)/Wells Fargo Housing Market Index (HMI) released today. This marks the lowest HMI reading since June 2020.
“Six consecutive monthly declines for the HMI is a clear sign of a slowing housing market in a high inflation, slow growth economic environment,” said NAHB Chairman Jerry Konter, a builder and developer from Savannah, Ga. “The entry-level market has been particularly affected by declines for housing affordability and builders are adopting a more cautious stance as demand softens with higher mortgage rates. Government officials need to enact policies that will support the supply-side of the housing market as costs continue to climb.”
“The housing market faces both demand-side and supply-side challenges,” said NAHB Chief Economist Robert Dietz. “Residential construction material costs are up 19% year-over-year with cost increases for a variety of building inputs, except for lumber, which has experienced recent declines due to a housing slowdown. On the demand-side of the market, the increase for mortgage rates for the first half of 2022 has priced out a significant number of prospective home buyers, as reflected by the decline for the traffic measure of the HMI.”
Derived from a monthly survey that NAHB has been conducting for more than 35 years, the NAHB/Wells Fargo HMI gauges builder perceptions of current single-family home sales and sales expectations for the next six months as “good,” “fair” or “poor.” The survey also asks builders to rate traffic of prospective buyers as “high to very high,” “average” or “low to very low.” Scores for each component are then used to calculate a seasonally adjusted index where any number over 50 indicates that more builders view conditions as good than poor.
All three HMI indices posted declines in June. The component charting traffic of prospective buyers fell five points to 48, marking the first time this gauge has fallen below the breakeven level of 50 since June 2020. The HMI index gauging current sales conditions fell one point to 77 and the gauge measuring sales expectations in the next six months fell two points to 61.
Looking at the three-month moving averages for regional HMI scores, the Northeast fell one point to 71, the Midwest dropped six points to 56, the South fell two points to 78 and the West posted a nine-point decline to 74.
HMI tables can be found at nahb.org/hmi. More information on housing statistics is also available at Housing Economics PLUS (formerly housingeconomics.com).
Freddie Mac (OTCQB: FMCC) today released the results of its Primary Mortgage Market Survey® (PMMS®), showing that the 30-year fixed-rate mortgage (FRM) averaged 4.16 percent.
“The 30-year fixed-rate mortgage exceeded four percent for the first time since May of 2019,” said Sam Khater, Freddie Mac’s Chief Economist. “The Federal Reserve raising short-term rates and signaling further increases means mortgage rates should continue to rise over the course of the year. While home purchase demand has moderated, it remains competitive due to low existing inventory, suggesting high house price pressures will continue during the spring homebuying season.”
News Facts
30-year fixed-rate mortgage averaged 4.16 percent with an average 0.8 point for the week ending March 17, 2022, up from last week when it averaged 3.85 percent. A year ago at this time, the 30-year FRM averaged 3.09 percent.
15-year fixed-rate mortgage averaged 3.39 percent with an average 0.8 point, up from last week when it averaged 3.09 percent. A year ago at this time, the 15-year FRM averaged 2.40 percent.
5-year Treasury-indexed hybrid adjustable-rate mortgage (ARM) averaged 3.19 percent with an average 0.2 point, up from last week when it averaged 2.97 percent. A year ago at this time, the 5-year ARM averaged 2.79 percent.
The PMMS® is focused on conventional, conforming, fully amortizing home purchase loans for borrowers who put 20 percent down and have excellent credit. Average commitment rates should be reported along with average fees and points to reflect the total upfront cost of obtaining the mortgage. Visit the following link for the Definitions. Borrowers may still pay closing costs which are not included in the survey.
New York’s eviction moratorium will not be extended after it expires this weekend, Gov. Kathy Hochul announced Tuesday. In the meantime, the state’s rent-relief portal will be reopened to give aid to New Yorkers facing eviction. The freeze on evictions was established at the beginning of the Covid pandemic by former Gov. Andrew Cuomo to give relief to struggling New Yorkers. Over the past two years, it has been extended multiple times, with Hochul extending it to January 15 during her first week in office.
“We talked about giving people a little more breathing room, giving them just a little more relief on a short-term basis, and that went all the way to January 15,” Hochul said on Tuesday. “That was something no other state has done to my knowledge, and what we want to do is let people know that that is concluding very shortly.”
The ending of New York’s eviction moratorium comes after months of legal struggles between the federal government and New York. Last August, the Supreme Court partially blocked New York’s eviction moratorium claiming that the ban was unconstitutional because landlords had no way to challenge their tenant’s claims. When Hochul extended the ban in September, the original moratorium was altered to allow landlords to challenge their tenant’s claims in court.
Offering struggling New Yorkers an alternative, Hochul brought up the idea of reopening the rent-relief portal, which would give New Yorkers facing eviction the opportunity to have their eviction proceedings halted temporarily. “There is another option, which is reopening the portal. This is going to have the same effect in terms of allowing people to take advantage of a situation if they’re not able to pay their rent. They can have a cessation of the eviction proceedings for the time being.”
With the expiration of the moratorium closing in, tenant advocates have focused their attention on pushing for the passage of the good cause eviction bill, which would ban landlords from denying tenants a lease renewal without sufficient reasoning. The bill also guarantees tenants protection from eviction if their landlords increase their rent by 3 percent or by 150 percent of the Consumer Price Index.
In October of 2021, the federal government said that it would be reallocating unused funds from its first $25 billion allocation for emergency rental assistance and would be taking requests from states who needed a portion of it. In November, the state requested $1 billion in supplemental funding from the Department of Treasury to help residents facing eviction but received only $27 million this week.
“The federal government said that they were going to set aside money from other states that didn’t use it. We asked the Department of Treasury for over $978 million of that money to come to New York to help our backlog because by then we had probably $1 billion dollars worth of claims,” Hochul said. “That money, despite our efforts, resulted in $27 million dollars this week.”
Joseph Strasburg, the president of the Rent Stabilization Association, a group representing 25,000 owners of rent-stabilized apartments in the city, encouraged the end of the moratorium.
“The rolling eviction moratorium, now going on nearly two years, was intended as a temporary emergency response, and not as a long-term, sustainable solution,” Strasburg said. “The state of emergency was lifted last June, tenants have received billions of dollars in rent relief and other federal and state assistance, and despite COVID variants, the economy continues to rebound with millions of job openings still waiting to be filled. It’s time to end the eviction moratorium and put an end to tenants skipping the rent because there are no repercussions for not paying.”
In his statement, Strasburg mentioned that despite the eviction moratorium coming to an end, New Yorkers facing eviction in the face of Covid-related financial struggles are protected by the Tenant Safe Harbor A
Freddie Mac (OTCQB: FMCC) today released the results of its Primary Mortgage Market Survey® (PMMS®), showing that the 30-year fixed-rate mortgage (FRM) averaged 3.12 percent.
“Mortgage rates inched up as a result of economic improvement and a shift in monetary policy guidance,” said Sam Khater, Freddie Mac’s Chief Economist. “While house price growth is slowing, prices remain high due to solid housing demand and low supply. We expect rates to continue to increase into 2022 which may leave some potential homebuyers with less room in their budgets on the sideline.”
News Facts
30-year fixed-rate mortgage averaged 3.12 percent with an average 0.6 point for the week ending December 16, 2021, up from last week when it averaged 3.10 percent. A year ago at this time, the 30-year FRM averaged 2.67 percent.
15-year fixed-rate mortgage averaged 2.34 percent with an average 0.7 point, down from last week when it averaged 2.38 percent. A year ago at this time, the 15-year FRM averaged 2.21 percent.
The PMMS® is focused on conventional, conforming, fully amortizing home purchase loans for borrowers who put 20 percent down and have excellent credit. Average commitment rates should be reported along with average fees and points to reflect the total upfront cost of obtaining the mortgage. Visit the following link for the Definitions. Borrowers may still pay closing costs which are not included in the survey.
Freddie Mac makes home possible for millions of families and individuals by providing mortgage capital to lenders. Since our creation by Congress in 1970, we’ve made housing more accessible and affordable for homebuyers and renters in communities nationwide. We are building a better housing finance system for homebuyers, renters, lenders, investors and taxpayers. Learn more at FreddieMac.com, Twitter @FreddieMac and Freddie Mac’s blog FreddieMac.com/blog.
Median sales prices rose for existing single-family homes in all but one of 183 measured markets in the third quarter of 2021, according to the latest quarterly report from the National Association of Realtors.
The report also found that 78% of the 183 markets experienced double-digit year-over-year price increases, a decrease from 94% in the prior quarter, and three metro areas saw price gains of over 30% from one year ago, also fewer than the number in the previous quarter.
The median sales price of single-family existing homes climbed 16% from one year ago to $363,700, a slower pace in comparison to the preceding quarter at 22.9%. All four major regions had double-digit year-over-year price growth, led by the Northeast at 17.5%, followed by the South at 14.9%, the Midwest at 10.7%, and the West at 10.3%.
“Home prices are continuing to move upward, but the rate at which they ascended slowed in the third quarter,” says Lawrence Yun, NAR chief economist. “I expect more homes to hit the market as early as next year, and that additional inventory, combined with higher mortgage rates, should markedly reduce the speed of price increases.”
The markets with the highest year-over-year price gains were: Austin-Round Rock, Texas; Naples-Immokalee-Marco Island, Florida; Boise-Nampa, Idaho; Ocala, Florida; Punta Gorda, Florida; Salt Lake City; Phoenix; Sebastian-Vero Beach, Florida; Port St. Lucie, Florida; and New York-Jersey City-White Plains, New Jersey.
“While buyer bidding wars lessened in the third quarter compared to early 2021, consumers still faced stiff competition for homes located in the top 10 markets,” continues Yun. “Most properties were only on the market for a few days before being listed as under contract.”
In the third quarter, the average monthly mortgage payment on an existing single-family home financed with a 30-year fixed-rate loan and 20% down payment rose to $1,214, an increase of $156 from one year ago.
Among all home buyers, the monthly mortgage payment as a share of the median family income increased to 16.6%, up from 14.9% a year ago. For first-time buyers, the typical mortgage payment on a 10% down payment loan increased to 25.2% of the median family income, up from 22.6% a year ago.
A family typically needed an income of more than $100,000 to affordably pay a 10% down payment mortgage in 17 markets, matching the prior quarter. In 83 markets, a family typically needed an income of less than $50,000 to afford a home, down from 85 markets in the prior quarter.
“For the third quarter—and for 2021 as a whole—home affordability declined for many potential buyers,” says Yun. “While the higher prices made it extremely difficult for typical families to afford a home, in some cases the historically low mortgage rates helped offset the asking price.”
Freddie Mac (OTCQB: FMCC) today released the results of its Primary Mortgage Market Survey (PMMS), showing that the 30-year fixed-rate mortgage (FRM) averaged 3.09 percent. “Mortgage rates continued to rise this week due to the trajectory of both the economy and the pandemic,” said Sam Khater, Freddie Mac’s Chief Economist. “Even as the availability of existing homes is improving, prices remain high due to home buyer demand and limitations on housing starts and permits resulting from the ongoing labor and material shortages. Despite these countervailing forces, we expect the housing market to remain strong as we head into the end of the year.”
News Facts
30-year fixed-rate mortgage averaged 3.09 percent with an average 0.7 point for the week ending October 21, 2021, up from last week when it averaged 3.05 percent. A year ago at this time, the 30-year FRM averaged 2.80 percent.
15-year fixed-rate mortgage averaged 2.33 percent with an average 0.7 point, up from last week when it averaged 2.30 percent. A year ago at this time, the 15-year FRM averaged 2.33 percent.
5-year Treasury-indexed hybrid adjustable-rate mortgage (ARM) averaged 2.54 percent with an average 0.3 point, down slightly from last week when it averaged 2.55 percent. A year ago at this time, the 5-year ARM averaged 2.87 percent.
The PMMS is focused on conventional, conforming, fully amortizing home purchase loans for borrowers who put 20 percent down and have excellent credit. Average commitment rates should be reported along with average fees and points to reflect the total upfront cost of obtaining the mortgage. Visit the following link for the Definitions. Borrowers may still pay closing costs which are not included in the survey.
Fannie Mae’s HPSI sees “good time to buy” sentiment drop to survey low
Homebuyers are feeling pretty discouraged by the housing market these days. The latest Fannie Mae Home Purchase Sentiment Index shows that just 35% of consumers believe now is a good time to buy a home, down from 47% in April. And those who believe it is a bad time to be a homebuyer increased to 56% from 48%.
“Consumers appear to be acutely aware of higher home prices and the low supply of homes, the two reasons cited most frequently for that particular sentiment,” said Doug Duncan, senior vice president and chief economist at Fannie Mae.
“However, despite the challenging buying conditions, consumers do appear more intent to purchase on their next move, a preference that may be supported by the expectation of continued low mortgage rates, as well as the elevated savings rate during the pandemic, which may have allowed many to afford a down payment,” Duncan said.
Though low inventory, bidding wars and high prices have knocked down homebuyer sentiment, other factors, such as a rebounding economy and stable income levels, pushed the overall HSPI index up one point to 80 in May.
In fact, four of the HPSI’s six components measuring market expectations increased month over month. The HPSI is still 12.5 points higher than it was in May 2020, when forbearance and unemployment heavily weighed down consumer sentiment.
Because the housing market feels very much like a zero sum game at this point, sellers again felt good about their position. Just over two-thirds of those surveyed in June said it was a prime time to list a home and tempt the swarms of homebuyers, unchanged from the prior month.
Respondents also remained virtually unaltered on how much homes will actually cost. The percentage of respondents who say home prices will go up in the next 12 months decreased from 49% to 47%, while the percentage who say home prices will go down remained unchanged at 17%. The share who think home prices will stay the same increased from 27% to 29%.
Mortgage rate expectations changed a bit in May for prospective homebuyers and sellers: The percentage who expect mortgage rates to go up decreased from 54% to 49% while the share of those who think mortgage rates will stay the same increased from 33% to 38%. The remaining 6% are hopeful they may slide back down.
Since rates have fallen back below 3% once again, Fannie Mae’s economic and strategic group revised its expectations for purchase and refinance volume. The economic group cut $43 billion from its 2021 purchase volume forecast; it now estimates that purchase mortgages will hit $1.8 trillion by year’s end.
Because record low mortgage rates fueled the refinance wave of 2020’s housing market, Fannie Mae also revised its refi origination volume to $2.2 trillion in 2021, an increase of $125 billion from the previous month’s forecast.
Borrowers who aren’t stuffing their pockets full of refi savings may be making it up on the job market. The percentage of respondents who say their household income is significantly higher than it was 12 months ago increased from 21% to 29%, while the percentage who say their household income is significantly lower decreased from 17% to 13%. To top it off, the percentage of respondents who say they are not concerned about losing their job in the next 12 months increased from 80% to 87%.
S&P Dow Jones Indices (S&P DJI) today released the latest results for the S&P CoreLogic Case-Shiller Indices, the leading measure of U.S. home prices. Data released today for February 2021 show that home prices continue to increase across the U.S. More than 27 years of history are available for the data series, and can be accessed in full by going to https://www.spglobal.com/spdji/.
YEAR-OVER-YEAR
The S&P CoreLogic Case-Shiller U.S. National Home Price NSA Index, covering all nine U.S. census divisions, reported a 12.0% annual gain in February, up from 11.2% in the previous month. The 10-City Composite annual increase came in at 11.7%, up from 10.9% in the previous month. The 20-City Composite posted an 11.9% year-over-year gain, up from 11.1% in the previous month.
Phoenix, San Diego, and Seattle reported the highest year-over-year gains among the 20 cities in February. Phoenix led the way with a 17.4% year-over-year price increase, followed by San Diego with a 17.0% increase and Seattle with a 15.4% increase. Nineteen of the 20 cities reported higher price increases in the year ending February 2021 versus the year ending January 2021.
MONTH-OVER-MONTH
Before seasonal adjustment, the U.S. National Index posted an 1.1% month-over-month increase, while the 10-City and 20-City Composites both posted increases of 1.1% and 1.2% respectively in February.
After seasonal adjustment, the U.S. National Index posted a month-over-month increase of 1.1%, and the 10-City and 20-City Composites both posted increases of 1.1% and 1.2% respectively as well. In February, all 20 cities reported increases before and after seasonal adjustments.
ANALYSIS
“Strong home price gains continued in February 2021,” says Craig J. Lazzara, Managing Director and Global Head of Index Investment Strategy at S&P DJI. The National Composite Index marked its ninth month of accelerating prices with a 12.0% gain from year-ago levels, up from 11.2% in January. This acceleration is also reflected in the 10- and 20-City Composites (up 11.7% and 11.9%, respectively). The market’s strength continues to be broadly-based: all 20 cities rose, and 19 cities gained more in the 12 months ended in February than they had gained in the 12 months ended in January.
“More than 30 years of S&P CoreLogic Case-Shiller data help us to put February’s results into historical context. The National Composite’s 12.0% gain is the highest recorded since February 2006, exactly 15 years ago, and lies comfortably in the top decile of historical performance. Housing’s strength is reflected across all 20 cities; February’s price gains in every city are above that city’s median level, and rank in the top quartile of all reports in 18 cities.
“These data remain consistent with the hypothesis that COVID has encouraged potential buyers to move from urban apartments to suburban homes. This demand may represent buyers who accelerated purchases that would have happened anyway over the next several years. Alternatively, there may have been a secular change in preferences, leading to a permanent shift in the demand curve for housing. Future data will be required to analyze this question.
“Phoenix’s 17.4% increase led all cities for the 21st consecutive month, with San Diego (+17.0%) and Seattle (+15.4%) close behind. Although prices were strongest in the West (+13.0%) and Southwest (+12.9%), every region logged double-digit gains.”
SUPPORTING DATA
Table 1 below shows the housing boom/bust peaks and troughs for the three composites along with the current levels and percentage changes from the peaks and troughs.
2006 Peak
2012 Trough
Current
Index
Level
Date
Level
Date
From Peak (%)
Level
From Trough (%)
From Peak (%)
National
184.61
Jul-06
133.99
Feb-12
-27.4%
238.82
78.2%
29.4%
20-City
206.52
Jul-06
134.07
Mar-12
-35.1%
246.04
83.5%
19.1%
10-City
226.29
Jun-06
146.45
Mar-12
-35.3%
259.50
77.2%
14.7%
Table 2 below summarizes the results for February 2021. The S&P CoreLogic Case-Shiller Indices could be revised for the prior 24 months, based on the receipt of additional source data.
February 2021
February/January
January ’21/December ’20
1-Year
Metropolitan Area
Level
Change (%)
Change (%)
Change (%)
Atlanta
171.44
0.9%
0.8%
10.0%
Boston
254.42
0.9%
0.7%
13.7%
Charlotte
187.36
1.0%
0.7%
11.7%
Chicago
154.76
0.3%
0.3%
8.6%
Cleveland
142.62
0.8%
0.1%
12.5%
Dallas
214.38
1.7%
0.8%
10.9%
Denver
250.39
1.8%
1.0%
11.2%
Detroit
142.63
1.0%
0.6%
11.7%
Las Vegas
214.78
1.0%
0.9%
9.1%
Los Angeles
325.33
1.3%
1.0%
11.9%
Miami
275.88
1.0%
1.2%
11.0%
Minneapolis
198.56
1.0%
0.0%
10.4%
New York
227.36
0.6%
1.0%
11.6%
Phoenix
236.51
2.0%
1.6%
17.4%
Portland
270.66
1.3%
1.0%
11.4%
San Diego
310.62
2.9%
1.5%
17.0%
San Francisco
298.34
2.1%
0.6%
11.0%
Seattle
299.95
2.4%
1.5%
15.4%
Tampa
255.05
1.3%
1.1%
12.7%
Washington
262.18
1.0%
0.7%
11.1%
Composite-10
259.50
1.1%
0.9%
11.7%
Composite-20
246.04
1.2%
0.9%
11.9%
U.S. National
238.82
1.1%
0.9%
12.0%
Sources: S&P Dow Jones Indices and CoreLogic
Data through February 2021
Table 3 below shows a summary of the monthly changes using the seasonally adjusted (SA) and non-seasonally adjusted (NSA) data. Since its launch in early 2006, the S&P CoreLogic Case-Shiller Indices have published, and the markets have followed and reported on, the non-seasonally adjusted data set used in the headline indices. For analytical purposes, S&P Dow Jones Indices publishes a seasonally adjusted data set covered in the headline indices, as well as for the 17 of 20 markets with tiered price indices and the five condo markets that are tracked.