Tag Archives: Mt Kisco Real Estate

Pending home sales fall 31% | Mt Kisco Real Estate

Key Highlights

  • Pending home sales dropped for the fourth straight month, down 10.2% from August.
  • Month-over-month, contract signings pulled back in all four major U.S. regions.
  • Pending sales decreased in all regions compared to one year ago.

Pending home sales trailed off for the fourth consecutive month in September, according to the National Association of Realtors. All four major regions recorded month-over-month and year-over-year declines in transactions.

The Pending Home Sales Index (PHSI),* www.nar.realtor/pending-home-sales, a forward-looking indicator of home sales based on contract signings, slumped 10.2% to 79.5 in September. Year-over-year, pending transactions slid by 31.0%. An index of 100 is equal to the level of contract activity in 2001.

“Persistent inflation has proven quite harmful to the housing market,” said NAR Chief Economist Lawrence Yun. “The Federal Reserve has had to drastically raise interest rates to quell inflation, which has resulted in far fewer buyers and even fewer sellers.”

Yun noted that new home listings are down compared to one year ago since many homeowners are unwilling to give up the rock-bottom, 3% mortgage rates that they locked in prior to this year.

“The new normal for mortgage rates could be around 7% for a while,” Yun added. “On a $300,000 loan, that translates to a typical monthly mortgage payment of nearly $2,000, compared to $1,265 just one year ago – a difference of more than $700 per month. Only when inflation is tamed will mortgage rates retreat and boost home purchasing power for buyers.”

Pending Home Sales Regional Breakdown

The Northeast PHSI descended 16.2% from last month to 64.2, a decline of 30.1% from September 2021. The Midwest index retracted 8.8% to 80.7 in September, down 26.7% from one year ago.

The South PHSI faded 8.1% to 97.0 in September, a drop of 30.0% from the prior year. The West index slipped by 11.7% in September to 62.7, down 38.7% from September 2021.

The National Association of Realtors® is America’s largest trade association, representing more than 1.5 million members involved in all aspects of the residential and commercial real estate industries.

# # #

*The Pending Home Sales Index is a leading indicator for the housing sector, based on pending sales of existing homes. A sale is listed as pending when the contract has been signed but the transaction has not closed, though the sale usually is finalized within one or two months of signing.

Pending contracts are good early indicators of upcoming sales closings. However, the amount of time between pending contracts and completed sales is not identical for all home sales. Variations in the length of the process from pending contract to closed sale can be caused by issues such as buyer difficulties with obtaining mortgage financing, home inspection problems, or appraisal issues.

The index is based on a sample that covers about 40% of multiple listing service data each month. In developing the model for the index, it was demonstrated that the level of monthly sales-contract activity parallels the level of closed existing-home sales in the following two months.

An index of 100 is equal to the average level of contract activity during 2001, which was the first year to be examined. By coincidence, the volume of existing-home sales in 2001 fell within the range of 5.0 to 5.5 million, which is considered normal for the current U.S. population.

NOTE: Existing-Home Sales for October will be reported on November 18. The next Pending Home Sales Index will be on November 30. All release times are 10 a.m. Eastern.

Information about NAR is available at nar.realtor. This and other news releases are posted in the newsroom at nar.realtor/newsroomStatistical data in this release, as well as other tables and surveys, are posted in the “Research and Statistics” tab.

InfographicPending Home Sales: September 2022


Related Links

Northeast new home sales fall 15.6% | Mt Kisco Real Estate

A brief decline in mortgage rates helped to boost new home sales in August but sales are expected to move lower in the months ahead as rates have since moved higher and builder sentiment continues to fall due to declining housing affordability and ongoing supply chain bottlenecks.

Sales of newly built, single-family homes in August increased 28.8% to a 685,000 seasonally adjusted annual rate from an upwardly revised reading in July, according to newly released data by the U.S. Department of Housing and Urban Development and the U.S. Census Bureau. New home sales are down 14% on a year-to-date basis despite the August upturn. Additionally, as sales cancellation rates increase, it is important to keep in mind that the Census data do not incorporate cancellation data. According to recent NAHB surveys, new home sales cancellations were approximately 25% in late August.

The August new home sales data indicate two important factors about the future path of single-family home building. There remains significant, unmet structural demand for housing (that is, a mismatch between the number of potential households and available housing). However, in the short-run the cyclical impacts of higher interest rates are the primary factor determining actualized, market demand for housing. Together, these factors point to ongoing weakness for single-family housing in the coming quarters, followed by a rebound in 2024 as interest rates eventually ease.

New single-family home inventory remained elevated at an 8.1 months’ supply. The count of homes available for sale, 461,000, is up 24.6% over last year. Of this total, only 49,000 of the new home inventory is completed and ready to occupy. The remaining have not started construction or are currently under construction. Inventories of new homes should fall in the months ahead as single-family permitting and construction starts slow.

Reflecting gains for construction costs, the median new home price in August was $436,800, up 8.2% from a year ago. This is a diminished growth rate as a growing number of builders cut prices due to slackening demand. According to survey data collected with the NAHB/Wells Fargo HMI, 24% of builders reported reducing home prices in September, up from 19% last month. Importantly, for housing affordability conditions, a year ago 25% of new home sales were priced below $300,000. In August, this share fell to just 12%.

Regionally, on a year-to-date basis, new home sales fell in all four regions, down 15.6% in the Northeast, 24.5% in the Midwest, 10.8% in the South and 16.7% in the West.

read more…

eyeonhousing.org

Building materials prices up 19% | Mt Kisco Real Estate

According to the latest Producer Price Index (PPI) report released today by the Bureau of Labor Statistics, the prices of goods used in residential construction ex-energy (not seasonally adjusted) climbed 0.5% in April, following upwardly revised increases of 1.9% and 2.4% in March and February, respectively. This adds up to an 4.9% increase in building materials prices since the start of 2022. Year-over-year, building materials prices are up 19.2% and have risen 35.6% since the start of the pandemic.

The price index of services inputs to residential construction registered a similar increase, rising 0.9% in April. However, the index was upwardly revised for March, causing the monthly increase to jump from 3.2% to 6.8% over the month. As a result, the price index of services used in home building (including trade services, transportation and warehousing) has climbed 13.3% since the start of the year. Year-over-year, the index has increased 18.1% and is up 45.6% since the start of the pandemic.

Softwood Lumber

The PPI for softwood lumber (seasonally adjusted) declined 15.6% in April following a downwardly revised 5.4% increase in March and a 2.5% gain in February. As a result, the index is down 8.9% over the first four months of 2022. Since reaching its most recent trough in September 2021, prices have risen 60.4%.

Steel Products

Steel mill products prices (NSA) climbed 2.4% in April–the first monthly increase since December 2021. Nonetheless, the first four months of 2022 have been positive for the cost of derivative steel products after increasing 128.0% in 2021.

Ready-Mix Concrete

The PPI for ready-mix concrete (RMC) resumed its upward trend after a small decline in March (-0.2%) as prices rose 1.3% (SA) in April. The index has climbed 8.9% year-over-year and is 12.6% higher than the January 2021 reading.

Gypsum Products

The PPI for gypsum products (SA) was flat in April. Year-over-year, the prices of gypsum products are 17.8% higher and have increased 23.5% since January 2021.

read more…

eyeonhousing.org

Mortgage rates average 2.98% | Mt Kisco Real Estate

Freddie Mac (OTCQB: FMCC) today released the results of its Primary Mortgage Market Survey® (PMMS®), showing that the 30-year fixed-rate mortgage (FRM) averaged 2.98 percent.

“Despite the re-acceleration of economic growth, the recent bond rally drove mortgage rates down for the second consecutive week,” said Sam Khater, Freddie Mac’s Chief Economist. “These low mortgage rates, combined with the tailwind of first-time homebuyers entering the market, means that purchase demand will remain strong into next year. However, affordability pressures continue to be an ongoing concern for homebuyers.”

News Facts

  • 30-year fixed-rate mortgage averaged 2.98 percent with an average 0.7 point for the week ending November 10, 2021, down from last week when it averaged 3.09 percent. A year ago at this time, the 30-year FRM averaged 2.84 percent.
  • 15-year fixed-rate mortgage averaged 2.27 percent with an average 0.6 point, down from last week when it averaged 2.35 percent. A year ago at this time, the 15-year FRM averaged 2.34 percent.
  • 5-year Treasury-indexed hybrid adjustable-rate mortgage (ARM) averaged 2.53 percent with an average 0.4 point, down slightly from last week when it averaged 2.54 percent. A year ago at this time, the 5-year ARM averaged 3.11 percent.

The PMMS® is focused on conventional, conforming, fully amortizing home purchase loans for borrowers who put 20 percent down and have excellent credit. Average commitment rates should be reported along with average fees and points to reflect the total upfront cost of obtaining the mortgage. Visit the following link for the Definitions. Borrowers may still pay closing costs which are not included in the survey.

Freddie Mac makes home possible for millions of families and individuals by providing mortgage capital to lenders. Since our creation by Congress in 1970, we’ve made housing more accessible and affordable for homebuyers and renters in communities nationwide. We are building a better housing finance system for homebuyers, renters, lenders, investors and taxpayers. Learn more at FreddieMac.com, Twitter @FreddieMac and Freddie Mac’s blog FreddieMac.com/blog.

New homes material prices rising 26% | Mt Kisco Real Estate

post published last week discussed how record numbers of builders were reporting on broad-based shortages of building materials and products.  The source of the information was the May survey for the NAHB/Wells Fargo Housing Market Index (HMI).  The same survey asked the HMI panel of single-family builders how total material costs for the same house have changed over the past 12 months.

The most comment response (checked by 28.0 percent of builders) was that materials costs increased by 20 to 29.99 percent.  However, 15.9 percent indicated that costs increased by 30 to 39.99 percent, 5.9 percent indicated 40 to 49.99 percent, and 15.2 percent even indicated that their costs had increased by 50 percent or more.

On average, the 12-month increase in material costs for the same house was 26.1 percent.  Historically, NAHB has included the material cost question on its HMI questionnaire six times since 2012.  The 2021 figure of 26.1 percent is the highest the average 12-month cost increase has been over that span—by a wide margin.  The previous record was 6.1 percent recorded in 2017.

Material availability and costs are one of several factors, including the cost of regulation and a general shortage of construction labor, limiting the supply of housing, particularly for the entry-level market where additional inventory is badly needed.

read more…

eyeonhousing.org

Mortgage rates average 2.97% | Mt Kisco Real Estate

— Freddie Mac today released the results of its Primary Mortgage Market Survey (PMMS), showing that the 30-year fixed-rate mortgage (FRM) averaged 2.97 percent.

“The drop in mortgage rates is good news for homeowners who are still looking to take advantage of the very low rate environment,” said Sam Khater, Freddie Mac’s Chief Economist. “Freddie Mac research suggests that lower income and minority homeowners have been less likely to engage in the refinance market. Low and declining mortgage rates provide these homeowners the opportunity to reduce their monthly payment and improve their financial position.”

News Facts

  • 30-year fixed-rate mortgage averaged 2.97 percent with an average 0.7 point for the week ending April 22, 2021, down from last week when it averaged 3.04 percent. A year ago at this time, the 30-year FRM averaged 3.33 percent.
  • 15-year fixed-rate mortgage averaged 2.29 percent with an average 0.6 point, down from last week when it averaged 2.35 percent. A year ago at this time, the 15-year FRM averaged 2.86 percent.
  • 5-year Treasury-indexed hybrid adjustable-rate mortgage (ARM) averaged 2.83 percent with an average 0.3 point, up from last week when it averaged 2.80 percent. A year ago at this time, the 5-year ARM averaged 3.28 percent.

The PMMS is focused on conventional, conforming, fully amortizing home purchase loans for borrowers who put 20 percent down and have excellent credit. Average commitment rates should be reported along with average fees and points to reflect the total upfront cost of obtaining the mortgage. Visit the following link for the Definitions. Borrowers may still pay closing costs which are not included in the survey.

Freddie Mac makes home possible for millions of families and individuals by providing mortgage capital to lenders. Since our creation by Congress in 1970, we’ve made housing more accessible and affordable for homebuyers and renters in communities nationwide. We are building a better housing finance system for homebuyers, renters, lenders, investors and taxpayers. Learn more at FreddieMac.com, Twitter @FreddieMac and Freddie Mac’s blog FreddieMac.com/blog.

Case-Shiller home prices up 9.5% | Mt Kisco Real Estate

In November, national home prices continued to rise at a fast pace, fueled by strong demand and low inventory. All 19 major markets saw double-digit growths in home prices.

The S&P CoreLogic Case-Shiller U.S. National Home Price Index, reported by S&P Dow Jones Indices, rose at a seasonally adjusted annual growth rate of 18.3% in November, following a 21.9% increase in October. It marks the fourth consecutive month of double-digit growth in home prices. On a year-over-year basis, the S&P CoreLogic Case-Shiller U.S. National Home Price NSA Index posted a 9.5% annual gain in November, up from 8.4% in September. It is the fastest pace of home price appreciation since February 2014. Strong demand, low interest rates and tight inventory together pushed home prices to new highs amid the COVID-19 pandemic.

Meanwhile, the Home Price Index, released by the Federal Housing Finance Agency (FHFA), rose at a seasonally adjusted annual rate of 12.9% in November, following a 19.3% increase in October. On a year-over-year basis, the FHFA Home Price NSA Index rose by 11.0% in November, after an increase of 10.3% in October. It confirmed rapid growth in home prices for this month.

In addition to tracking national home price changes, S&P reported home price indexes across 19 metro areas in November (Detroit metro area data was missing in November 2020 because there are not a sufficient number of records for the month of November for Detroit).

In November, all 19 metro areas reported positive home price appreciation and their annual growth rates ranged from 9.1% to 27.7%. Among all the 19 metro areas, seven metro areas exceeded the national average of 18.3%. New York, Seattle and Boston had the highest home price appreciation. New York led the way with a 27.7% increase, followed by Seattle with a 22.4% increase and Boston with a 21.9% increase.

read more…

eyeonhousing.org/2021/01/

Existing home sales up 25% | Mt Kisco Real Estate

After reaching almost 15-year high last month, existing home sales, as reported by the National Association of Realtors (NAR), declined for the first time in six months amid inventory shortage and surging prices.

Total existing home sales, including single-family homes, townhomes, condominiums and co-ops, fell 2.5% to a seasonally adjusted annual rate of 6.69 million in November. On a year-over-year basis, sales were still 25.8% higher than a year ago.

The first-time buyer share stayed at 32% in November, same as last month and a year ago. However, price gains threaten this share in the future. The November inventory level fell to record-low 1.28 million units from 1.42 million units in October and is down from 1.64 million units a year ago.

At the current sales rate, the November unsold inventory represents an all-time low 2.3-month supply, down from 2.5-month in October and 3.7-month a year ago. This low level supply of resale homes is good news for home construction.

Homes stayed on the market for an average of just 21 days in November, an all-time low, seasonally even with last month and down from 38 days a year ago. In November, 73% of homes sold were on the market for less than a month.

The November all-cash sales share was 20% of transactions, up from 19% last month but unchanged from a year ago.

Tight supply continues to push up home prices. The November median sales price of all existing homes was $310,800, up 14.6% from a year ago, representing the 105th consecutive month of year-over-year increases. The median existing condominium/co-op price of $271,400 in November was up 9.5% from a year ago.

Regionally, three of four regions saw a decline in existing home sales in November. Sales in the Northeast, Midwest and South fell 2.2%, 2.5% and 3.8% respectively from last month, while sales in the West remained unchanged. On a year-over-year basis, sales still grew by double-digit in all four regions, ranging from 24.2% in the Midwest to 27.3% in the West.

Though sales took a marginal step back in November, existing home sales have outperformed 2019 levels and housing demand is expected to remain strong due to low mortgage rates and remote-work flexibilities. However, the imbalance between housing supply and demand could hamper future sales by driving up home prices and restraining affordability.

read more…

eyeonhousing.org

Case Shiller home prices up 5.2% | Mt Kisco Real Estate

U.S. home prices posted a robust gain in August — another sign that the American housing market remains strong despite economic fallout from the coronavirus pandemic.

The S&P CoreLogic Case-Shiller 20-city home price index, released Tuesday, showed that home prices climbed 5.2% in August from a year earlier, accelerating from a 4.1% gain in July. The gain was stronger than economists had expected.

Phoenix (up 9.9% from August 2019), Seattle (up 8.5%) and San Diego (7.6%) posted the biggest gains. All 19 cities in the index recorded price increases. The 20-city index excluded prices from the Detroit metropolitan area index because of delays related to pandemic at the recording office in Wayne County, which includes Detroit.

Helped by rock-bottom mortgage rates, the U.S. housing market has been a source of strength as the U.S. economy climbs back from an April-June freefall caused by the pandemic and the measures taken to contain it.

“The supply of for-sale homes, already extremely tight, has only become more constrained in recent months, and historically low mortgage rates continue to encourage many buyers to enter the market,” Matthew Speakman, economist at the real estate firm Zillow, said in a research note. “This heightened competition for the few homes on the market has placed consistent, firm pressure on home prices for months now, and there are few signs that this will relent any time soon.”

The National Association of Realtors reported last week that sales of existing shot up 9.4% in September and that the median selling price of a home climbed 15% from a year earlier to $311,800. And the Commerce Department reported that home building rose 1.9% in September on a surge in construction of single-family homes.

read more…

https://wtop.com/real-estate/2020/10/sp-corelogic-case-shiller-us-home-prices-up-5-2-in-august/

Existing home sales jump to 14-year high, as prices set another record | Mt Kisco Real Estate

  • Sales of existing homes rose 2.4% to a seasonally adjusted annualized rate of 6.0 million units, according to the National Association of Realtors.
  • Sales were 10.5% higher compared with August 2019. This is the highest sales pace since December 2006, before the Great Recession. 
  • Tough competition has the market moving very quickly. It took just 22 days to sell a home in August, matching the fastest on record.
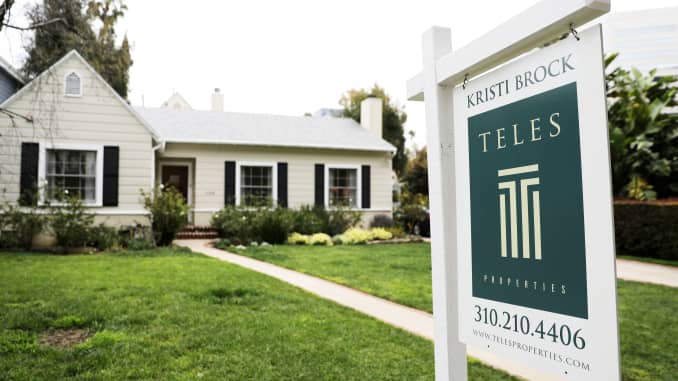
A home for sale is seen in Santa Monica, California.

A home for sale is seen in Santa Monica, California.

After a record-setting July, the housing market still shows no sign of cooling off.

Sales of existing homes rose 2.4% to a seasonally adjusted annualized rate of 6 million units, according to the National Association of Realtors. Sales were 10.5% higher compared with August 2019. This is the highest sales pace since December 2006, before the Great Recession.

Sales were hampered only by lack of supply. There were 1.49 million homes for sale at the end of August, down 18.6% annually to a 3.0-month supply. The number of homes for sale when sales were last this robust, in 2006, was more than double the current supply.

That tight supply pushed the median price of an existing home sold in August to a record high of $310,600. That is up 11.4% annually. In the third quarter of this year the housing wealth will have increased by $1.5 trillion from the second quarter.

“The imbalance of supply and demand will hurt affordability soon. Once that appears it will hinder home ownership rates,” said Lawrence Yun, chief economist for the Realtors. 

Tough competition has the market moving very quickly. It took just 22 days to sell a home in August, matching the fastest on record.

Mortgage rates set several record lows in August, which only added to the fierce competition for housing. Low rates also kept the heat on home prices, as they give buyers additional purchasing power.

Regionally, sales were strongest in the Northeast, rising 13.8% month to month. Sales were 1.4% higher in the Midwest and 0.8% higher in both the South and West. The Northeast saw some of the strictest shutdown rules early in the coronavirus pandemic, so the recovery now may be making up for that.  

Sales of newly built homes, which are counted by signed contracts, not closings, jumped 36% annually in July. Builders are benefiting from the tight supply of existing homes for sale, as well as for the new consumer demand for higher-tech homes in suburban and rural locations.

Strong demand is expected to continue into the usually slower fall months, but there may be a brief drop in the numbers because of the various natural disasters across the nation.

“In early September, new housing supply took a hit from the wildfires and hurricanes, and sales activity weakened. But because the impact of natural disasters has been more supply-oriented than demand-oriented, prices are expected to remain high,” said Danielle Hale, chief economist at realtor.com. “The combination of high prices and low supply is going to continue to make finding a home an even more difficult task than it already is.”

read more…

https://www.cnbc.com/2020/09/22/existing-home-sales-jump-to-14-year-high-as-prices-set-another-record.html