“The uncertainty and volatility in financial markets is heavily impacting mortgage rates,” said Sam Khater, Freddie Mac’s Chief Economist. “Our survey indicates that the range of weekly rate quotes for the 30-year fixed-rate mortgage has more than doubled over the last year. This means that for the typical mortgage amount, a borrower who locked-in at the higher end of the range would pay several hundred dollars more than a borrower who locked-in at the lower end of the range.”
Khater continued, “The large dispersion in rates means it has become even more important for homebuyers to shop around with different lenders.”
News Facts
30-year fixed-rate mortgage averaged 6.70 percent with an average 0.9 point as of September 29, 2022, up from last week when it averaged 6.29 percent. A year ago at this time, the 30-year FRM averaged 3.01 percent.
15-year fixed-rate mortgage averaged 5.96 percent with an average 1.3 point, up from last week when it averaged 5.44 percent. A year ago at this time, the 15-year FRM averaged 2.28 percent.
5-year Treasury-indexed hybrid adjustable-rate mortgage (ARM) averaged 5.30 percent with an average 0.4 point, up from last week when it averaged 4.97 percent. A year ago at this time, the 5-year ARM averaged 2.48 percent.
The PMMS is focused on conventional, conforming, fully amortizing home purchase loans for borrowers who put 20 percent down and have excellent credit. Average commitment rates should be reported along with average fees and points to reflect the total upfront cost of obtaining the mortgage. Visit the following link for the Definitions. Borrowers may still pay closing costs which are not included in the survey.
NOTE: Freddie Mac is making a number of enhancements to the PMMS to improve the collection, quality and diversity of data used. Instead of surveying lenders, the weekly results will be based on applications received from thousands of lenders across the country that are submitted to Freddie Mac when a borrower applies for a mortgage. Additionally, we will no longer publish fees/points or adjustable rates. The newly recast PMMS will be put in place in November 2022, and the weekly distribution will be Thursdays at 12 p.m. noon ET.
Freddie Mac makes home possible for millions of families and individuals by providing mortgage capital to lenders. Since our creation by Congress in 1970, we’ve made housing more accessible and affordable for homebuyers and renters in communities nationwide. We are building a better housing finance system for homebuyers, renters, lenders, investors and taxpayers. Learn more at FreddieMac.com, Twitter @FreddieMac and Freddie Mac’s blog FreddieMac.com/blog.
Pending home sales decreased in June, following a slight increase in May, according to the National Association of REALTORS®. All four major regions posted month-over-month and year-over-year pullbacks, the largest of which occurred in the West.
The Pending Home Sales Index (PHSI),* www.nar.realtor/pending-home-sales, a forward-looking indicator of home sales based on contract signings, dipped 8.6% to 91.0 in June. Year-over-year, transactions shrank 20.0%. An index of 100 is equal to the level of contract activity in 2001.
“Contract signings to buy a home will keep tumbling down as long as mortgage rates keep climbing, as has happened this year to date,” said NAR Chief Economist Lawrence Yun. “There are indications that mortgage rates may be topping or very close to a cyclical high in July. If so, pending contracts should also begin to stabilize.”
According to NAR, buying a home in June was about 80% more expensive than in June 2019. Nearly a quarter of buyers who purchased a home three years ago would be unable to do so now because they no longer earn the qualifying income to buy a median-priced home today.
“Home sales will be down by 13% in 2022, according to our latest projection,” Yun added. “With mortgage rates expected to stabilize near 6% and steady job creation, home sales should start to rise by early 2023.”
June Pending Home Sales Regional Breakdown
The Northeast PHSI slid 6.7% compared to last month to 80.9, down 17.6% from June 2021. The Midwest index dropped 3.8% to 93.7 in June, a 13.4% decline from a year ago.
The South PHSI slipped 8.9% to 108.3 in June, a decrease of 19.2% from the previous year. The West index slumped 15.9% in June to 68.7, down 30.9% from June 2021.
The National Association of REALTORS® is America’s largest trade association, representing more than 1.5 million members involved in all aspects of the residential and commercial real estate industries.
# # #
*The Pending Home Sales Index is a leading indicator for the housing sector, based on pending sales of existing homes. A sale is listed as pending when the contract has been signed but the transaction has not closed, though the sale usually is finalized within one or two months of signing.
Pending contracts are good early indicators of upcoming sales closings. However, the amount of time between pending contracts and completed sales is not identical for all home sales. Variations in the length of the process from pending contract to closed sale can be caused by issues such as buyer difficulties with obtaining mortgage financing, home inspection problems, or appraisal issues.
The index is based on a sample that covers about 40% of multiple listing service data each month. In developing the model for the index, it was demonstrated that the level of monthly sales-contract activity parallels the level of closed existing-home sales in the following two months.
An index of 100 is equal to the average level of contract activity during 2001, which was the first year to be examined. By coincidence, the volume of existing-home sales in 2001 fell within the range of 5.0 to 5.5 million, which is considered normal for the current U.S. population.NOTE: Existing-Home Sales for July will be reported on August 18. The next Pending Home Sales Index will be on August 24. All release times are 10 a.m. Eastern.
The prices of goods used in residential construction climbed 1.8% in May (not seasonally adjusted) and have increased 19.4%, year-over-year, according to the latest Producer Price Index (PPI) report. Prices have surged 40.4% since January 2020. Building materials (i.e., goods inputs to residential construction, less energy) prices have increased 5.4%, year-to-date, and are 36.3% higher than they were in May 2021.
The price index of services inputs to residential construction was driven 0.4% lower in May by decreases in the building materials retail and wholesale trade indices. The services PPI is 8.3% higher than it was 12 months prior and 42.9% higher than its pre-pandemic level.
Gypsum Products
The PPI for gypsum products jumped 7.1% in May and has soared 22.6% over the past year. After a quiet 2020, the price of gypsum products climbed 23.0% in 2021 and is up 7.5% through the first five months of 2022.
Paint
The PPIs for exterior and interior architectural coatings (i.e., paint) increased 1.7% and 0.2%, respectively, in May and have not declined since January 2021. The price of exterior paint has risen nearly 50% in the months since, including 14.5% through the first five months in 2022.
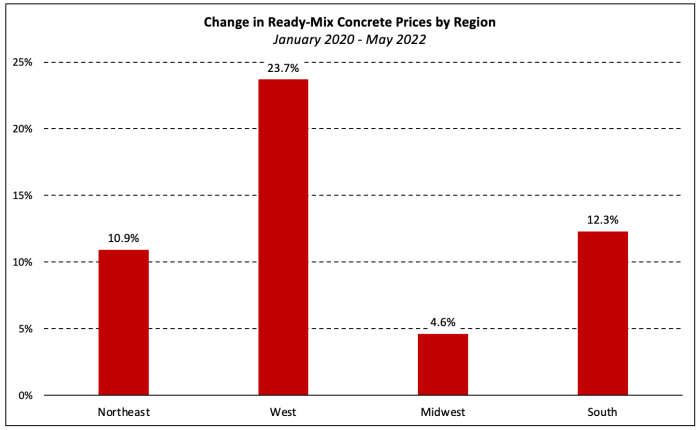
Ready-Mix Concrete
The PPI for ready-mix concrete (RMC) gained 0.9% in May and has climbed 3.2%, year-to-date. The index for RMC has increased 9.5% over the past 12 months and 12.0% since January 2021.
Price changes were broad based geographically with increases in the South (+1.3%), Midwest (+1.5%), Northeast (+2.6%), and West (+3.0%). Although prices are higher than pre-pandemic levels in all regions, the variance of increases across regions is quite large, ranging from 4.6% in the Midwest to 23.7% in the West.
Transportation of Freight
The price of truck transportation of freight increased 2.9% in May and has climbed 25.8%, year-over-year. Long-distance and local motor carrying prices are up 28.2% and 18.4%, respectively, over that period.
Water transportation costs have jumped 21.5% over just the past two months and have increased 35.7% over the past 12 months. Deep sea (i.e., ocean) transportation of freight prices have accounted for the majority of those increases as the category accounts for over half of the water transportation PPI. The price of ocean freight transport has climbed 31.2% since March and 63.2% since the start of 2021.
Prices of rail transportation services for freight gained 2.7% in May and have increased 11.7% and 15.4% since May and January of 2021, respectively.
Steel Products
Steel mill products prices rose 10.7% in May, the second straight monthly increase following three consecutive decreases to start 2022. Although prices are 4.9% below their all-time high (reached in December 2021), they remain 105.6% higher than the January 2021 level.
Softwood Lumber
The PPI for softwood lumber (seasonally adjusted) increased 0.4% in May after declining 15.6% in April. According to Random Lengths data, the “mill price” of framing lumber has fallen more than 35% since mid-May.
The PPI of most durable goods for a given month is largely based on prices paid for goods shipped, not ordered, in the survey month. Combined with survey timing issues, this can result in lags relative to cash market prices, suggesting a large decrease in the softwood lumber producer price index may be reflected in next month’s release.
Other Building Materials
The chart below shows the 12-month and year-to-date price changes of other price indices relevant to the residential construction industry.
Building Materials Wholesaling and Retailing
The producer price indices for building materials wholesaling and retailing decreased 0.6% and 2.1%, respectively, the second consecutive monthly decline for each. The wholesale and retail services indices measure changes in the nominal gross margins for goods sold by retailers and wholesalers. Gross profit margins of wholesalers, in dollar terms, have increased 26.3% over the past year while those of building materials retailers rose 3.9%. Compared to pre-pandemic levels, however, retailers’ margins are 64.2% higher and margins of wholesalers are up 36.1%.
Building materials wholesale and retail indexes account for roughly two-thirds of the PPI for “inputs to residential construction, services.”
The CoreLogic Home Price Insights report features an interactive view of our Home Price Index product with analysis through March 2022 and forecasts through March 2023.
CoreLogic HPI™ is designed to provide an early indication of home price trends. The indexes are fully revised with each release and employ techniques to signal turning points sooner. CoreLogic HPI Forecasts™ (with a 30-year forecast horizon), project CoreLogic HPI levels for two tiers—Single-Family Combined (both Attached and Detached) and Single-Family Combined excluding distressed sales.
The report is published monthly with coverage at the national, state and Core Based Statistical Area (CBSA)/Metro level and includes home price indices (including distressed sales); home price forecasts and market condition indicators. The data incorporates more than 40 years of repeat-sales transactions for analyzing home price trends.
HPI National Change
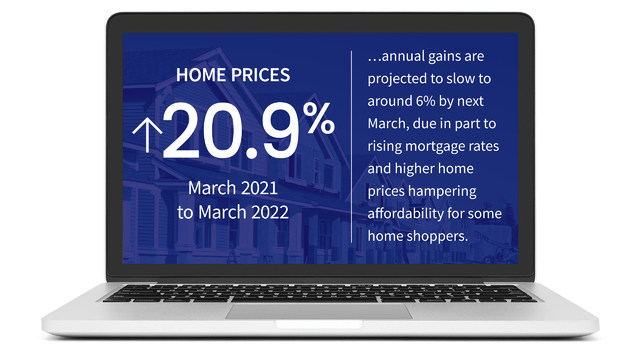
March 2022 National Home Prices
Home prices nationwide, including distressed sales, increased year over year by 20.9% in March 2022 compared with March 2021. On a month-over-month basis, home prices increased by 3.3% in March 2022 compared with February 2022 (revisions with public records data are standard, and to ensure accuracy, CoreLogic incorporates the newly released public data to provide updated results).
Forecast Prices Nationally
The CoreLogic HPI Forecast indicates that home prices will increase on a month-over-month basis by 1.2% from March 2022 to April 2022 and on a year-over-year basis by 5.9% from March 2022 to March 2023.
HPI & Case-Shiller Trends
This graph shows a comparison of the national year-over-year percent change for the CoreLogic HPI and CoreLogic Case-Shiller Index from 2000 to present month with forecasts one year into the future. We note that both the CoreLogic HPI Single Family Combined tier and the CoreLogic Case-Shiller Index are posting positive, but moderating year-over-year percent changes, and forecasting gains for the next year.
Economic Impact on Home Prices
U.S. home prices continued to post significant year-over-year gains in March, up by 20.9%, another record high. Even with the past year’s streak of double-digit price increases, annual gains are projected to slow to around 6% by next March, due in part to rising mortgage rates and higher home prices hampering affordability for some home shoppers. Buyers who closed on a property in March had a good chance of locking in mortgage rates around 4% or slightly lower. By late April, rates had moved up to more than 5%, a jump of about 30% from the same time last year and a trend that might derail more prospective buyers.
“The annual growth in the U.S. index was the largest we have measured in the 45-year history of the CoreLogic Home Price Index,” said Dr. Frank Nothaft, chief economist at CoreLogic. “Couple that price increase with the rapid rise in mortgage rates and buyer affordability has fallen sharply. In April, 30-year fixed mortgage rates averaged nearly 2 percentage points higher than one year earlier. With the growth in home prices, that means the monthly principal and interest payment to buy the median-priced home was up about 50% in April compared with last April.”
– Dr. Frank Nothaft Chief Economist for CoreLogic
HPI National and State Maps – March 2022
The CoreLogic HPI provides measures for multiple market segments, referred to as tiers, based on property type, price, time between sales, loan type (conforming vs. non-conforming) and distressed sales. Broad national coverage is available from the national level down to ZIP Code, including non-disclosure states.
Nationally, home prices increased 20.9% year over year in March. No states posted an annual decline in home prices. The states with the highest increases year over year were Florida (31.4%), Arizona (28.7%) and Tennessee (26.7%).
HPI Top 10 Metros Change
The CoreLogic HPI provides measures for multiple market segments, referred to as tiers, based on property type, price, time between sales, loan type (conforming vs. non-conforming) and distressed sales. Broad national coverage is available from the national level down to ZIP Code, including non-disclosure states.
These large cities continued to experience price increases in February, with Phoenix on top at 32.5% year over year.
Markets to Watch: Top Markets at Risk of Home Price Decline
The CoreLogic Market Risk Indicator (MRI), a monthly update of the overall health of housing markets across the country, predicts that Lake Havasu City-Kingman, AZ is at a very high risk (70%-plus probability) of a decline in home prices over the next 12 months. Prescott, AZ and Bridgeport-Stamford-Norwalk, CT are also at a very high risk for price declines. Bremerton-Silverdale, WA and Urban Honolulu, HI are at a high risk (50-70%) of a decline.
Summary
CoreLogic HPI features deep, broad coverage, including non-disclosure state data. The index is built from industry-leading real-estate public record, servicing, and securities databases—including more than 40 years of repeat-sales transaction data—and all undergo strict pre-boarding assessment and normalization processes.
CoreLogic HPI and HPI Forecasts both provide multi-tier market evaluations based on price, time between sales, property type, loan type (conforming vs. non-conforming) and distressed sales, helping clients hone in on price movements in specific market segments.
Updated monthly, the index is the fastest home-price valuation information in the industry—complete home-price index datasets five weeks after month’s end. The Index is completely refreshed each month—all pricing history from 1976 to the current month—to provide the most up-to-date, accurate indication of home-price movements available.
Methodology
The CoreLogic HPI™is built on industry-leading public record, servicing and securities real-estate databases and incorporates more than 40 years of repeat-sales transactions for analyzing home price trends. Generally released on the first Tuesday of each month with an average five-week lag, the CoreLogic HPI is designed to provide an early indication of home price trends by market segment and for the “Single-Family Combined” tier, representing the most comprehensive set of properties, including all sales for single-family attached and single-family detached properties. The indices are fully revised with each release and employ techniques to signal turning points sooner. The CoreLogic HPI provides measures for multiple market segments, referred to as tiers, based on property type, price, time between sales, loan type (conforming vs. non-conforming) and distressed sales. Broad national coverage is available from the national level down to ZIP Code, including non-disclosure states.
After posting double digit month-over-month increases in November and December, new home sales dropped in January, decreasing 4.5% from the month prior to a seasonally adjusted annual rate of 801,000, according to data released by the U.S. Department of Housing and Urban Development and the U.S. Census Bureau on Thursday. Year over year, the sale of new homes was down 19.3% in January.
“The only-modest setback in new home sales reinforced the fact that both home shoppers and home builders continue to stand firm amid a slew of challenges,” Zillow economist Matthew Speakman said in a statement. “With the wind blowing against them, builders navigated significant supply chain and labor disruptions, including a very difficult past two months thanks to a wave of Covid infections sweeping the nation and contributing to lost man hours. And while pandemic-related pressures appear to be easing in other parts of the economy, the shortage of key building materials – notably windows and wood products – persists. But these headwinds cannot be ignored and builders are still falling short of potential — last month’s figure was 19.3% below January 2021, which represented a post-Great Recession record high.”
At the end of January, an estimated 406,000 new homes were still for sale, which at the current sales rate represents a 6.1 month supply. With the supply of existing homes for sale hitting record lows and the various labor and material shortages hitting the homebuilding industry, this relatively high level of supply of new homes is giving housing economists reason to be cautiously optimistic for new home sales this spring.
“With home prices rising at unprecedented rates, and existing home inventory now at the lowest levels on record — and demand expected to remain strong – prospective buyers are eagerly waiting for new homes to come onto the market even if it means having to wait for months, or even years, before construction is complete,” Speakman said in a statement. “Just 10% of new homes available for sale in January were fully built, slightly more than lows reached in the fall but still well below historic norms.”
Affordability remains a problem, however, with the median homes sales price for new homes rising to $423,300 in January from $377,000 in December.
“One year ago, 29% of new-home sales were priced below $300,000,” First American deputy chief economist Odeta Kushi said in a statement. “In January of this year, only 9% of new-home sales were priced below $300,000. Rising mortgage rates further worsen affordability.”
However, Kushi notes that the escalating Russia-Ukraine conflict may impact how quickly and how much mortgage rates rise.
Regionally, new home sales fell in three out of the four national regions. In the Northeast, new home sales were down 10.7%, while the Midwest and South saw 3.7% and 7.4% drops, respectively. The West was the only region that saw a rise in new home sales, with an increase of 1.2%.
ALBANY—New York Gov. Kathy Hochul and New York Attorney General Letitia James announced on Jan. 3 that New York, Connecticut, Maryland, and New Jersey filed a petition for certiorari to the U.S. Supreme Court to continue their lawsuit against the federal government for its unlawful and unprecedented cap on the deduction for state and local taxes, known as SALT.
The petition asks the Supreme Court to review an October 2021 ruling by the U.S. Court of Appeals for the Second Circuit that upheld the district court’s rejection of the states’ suit, which argues that the SALT cap was a politically motivated bid by the former federal administration to interfere with the policy choices of predominantly Democratic states.
“The SALT deduction cap is nothing less than double taxation on New Yorkers,” New York Gov. Hochul said. “Repealing the SALT cap would not only put more money into the pockets of New York families, it would deliver a much-needed boost to New York’s economy. I am proud we are taking this issue to the Supreme Court to continue to fight on behalf of New York taxpayers.”
“This unfair cap has already placed a significant financial burden on countless hardworking, middle-class families in New York, and in the years to come, it is expected to cost New York taxpayers more than $100 billion,” said Attorney General James. “We filed this lawsuit to protect millions of New Yorkers from this harmful, misguided, and blatantly political attack. New York will not be bullied into paying more than its fair share, and we will continue to fight back.”
The lawsuit—which was originally filed in July 2018 in the U.S. District Court for the Southern District of New York—argued that the new SALT deduction cap was enacted to target New York and similarly situated states, that it interferes with states’ rights to make their own fiscal decisions, and that it will disproportionately harm taxpayers in these states. The top states with the highest average deduction for state and local taxes—a majority of which are Democratic—include New York, Connecticut, Maryland, and New Jersey.
The 2017 Tax Act reversed over a century of precedent in the federal tax code—drastically curtailing the state and local tax deduction by capping it at $10,000. An analysis by the New York state Department of Taxation and Finance projected that the cap would increase New Yorkers’ federal taxes by up to $15 billion annually.
As one of the nation’s top donor states, this attack is significantly more damaging to New York than many other states. Prior to enactment of the 2017 law, New York state already had the widest disparity among all states when factoring how much money New York sent to Washington, D.C. and the funding it received in return. Other donor states, including Connecticut, Maryland, and New Jersey are being similarly injured.
In its September 2019 ruling, despite ruling against the State of New York and its partner states, the U.S. District Court for the Southern District of New York agreed that the states had been injured based on their argument that the cap on the state and local tax deduction may depress home prices. By effectively raising state property taxes, the SALT cap will also reduce the value of a homeowner’s property, thereby discouraging home sales and decreasing the revenues the states are able to collect by taxing such sales.
Reports in the press also show anecdotal evidence that New Yorkers—particularly the state’s highest earners—are already moving their homes and businesses to states like Florida because of the cap on SALT deductions. In New York, the top 1% of taxpayers account for 46% of state income tax collections and losing them threatens the ability of the state to deliver on New York’s promise of providing opportunity for every person in the state.
Over the first ten months of 2021, the total number of single-family permits issued year-to-date (YTD) nationwide reached 948,321. On a year-over-year (YoY) basis, this is a 17.3% increase over the October 2020 level of 808,301.
Year-to-date ending in October, single-family permits increased in all four regions. Southern region reported the strongest increase of 19.1%, followed by Northeast (+18.5%), West (+15.6%), and Midwest (+12.4%). Multifamily permits were robust across the country in October compared to last year; West (+38.6%), Midwest (+30.3%), South (+23.8%), and Northeast (+15.5%).
Between October 2020 YTD and October 2021 YTD, 48 states and the District of Columbia saw growth in single-family permits issued. The District of Columbia recorded the highest growth rate during this time at 213.0% from 115 to 360. Mississippi Maryland reported a decline during this time. The 10 states issuing the highest number of single-family permits combined accounted for 62.2% of the total single-family permits issued.
Year-to-date, ending in October 2021, the total number of multifamily permits issued nationwide reached 490,172. This is 27.3% ahead over the October 2020 level of 385,107.
Between October 2020 YTD and October 2021 YTD, 41 states recorded growth while nine states and the District of Columbia recorded a decline in multifamily permits. New Mexico led the way with a sharp rise (180.0%) in multifamily permits from 694 to 1,943, while Connecticut had the largest decline of 51.3% from 2,700 to 1,316. The 10 states issuing the highest number of multifamily permits combined accounted for 63.2% of the multifamily permits issued.
At the local level, below are top 10 metro areas that issued the highest number of single-family permits.
For multifamily permits, below are the top 10 local areas that issued the highest number of permits:
Housing affordability held steady at its lowest level in nearly a decade, as higher home prices offset lower mortgage rates to keep the affordability rate flat in the third quarter of 2021. In the months ahead, however, supply-chain disruptions and the prospect of higher interest rates will continue to threaten housing affordability.
According to the National Association of Home Builders (NAHB)/Wells Fargo Housing Opportunity Index (HOI), 56.6 percent of new and existing homes sold between the beginning of July and end of September were affordable to families earning the U.S. median income of $79,900. This is unchanged from the 56.6% of homes sold in the second quarter of 2021 and remains the lowest affordability level since the beginning of the revised series in the first quarter of 2012.
The HOI shows that the national median home price increased to a record $355,000 in the third quarter, up $5,000 from the second quarter and $35,000 from the first quarter. Meanwhile, average mortgage rates fell by 14 basis points in the third quarter to 2.95% from the rate of 3.09% in the second quarter. However, mortgage rates are currently running above 3.1%, and this higher trend could affect affordability later this year and into 2022.
Lansing, East Lansing, Mich. was the nation’s most affordable major housing market, defined as a metro with a population of at least 500,000. There, 89.1% of all new and existing homes sold in the third quarter were affordable to families earning the area’s median income of $79,100.
Meanwhile, Davenport-Moline-Rock Island, Iowa-Ill. was rated the nation’s most affordable smaller market, with 93.4% of homes sold in the third quarter being affordable to families earning the median income of $76,300.
For the fourth straight quarter, Los Angeles-Long Beach-Glendale, Calif., remained the nation’s least affordable major housing market. There, just 8.3% of the homes sold during the third quarter were affordable to families earning the area’s median income of $80,000.
Four of the five least affordable small housing markets were also in the Golden State. However, at the very bottom of the affordability chart was Corvallis, Ore., where 6% of all new and existing homes sold in the third quarter were affordable to families earning the area’s median income of $93,000.
Visit nahb.org/hoi for tables, historic data and details.
Interest rates on the most popular type of U.S. home loan shot to a six-month high last week as global rates continued their march higher against a bout of stiff inflation and expectations that central banks will back further away from their pandemic-era easy-money policies.
The contract rate on a 30-year fixed rate mortgage climbed to 3.23% in the week ended Oct. 15 from 3.18% the week before, the Mortgage Bankers Association reported on Wednesday in its weekly survey of conditions in the U.S. home lending market. That was the highest level since early April and is up by more than a quarter percentage point since the end of July.
The increase in rates helped drive overall mortgage-application volumes down by 6.3% to the lowest since July, led by a 7.1% drop in refinancing applications, the MBA said. Refinancing application volumes are also at their lowest since July, just fractionally above their lowest levels since early 2020.
Applications for loans to buy a home fell 4.9% to the lowest since early September.
“Purchase activity declined and was 12% lower than a year ago,” said Joel Kan, MBA’s Associate Vice President of Economic and Industry Forecasting. “Insufficient housing supply and elevated home-price growth continue to limit options for would-be buyers.”
How quickly that situation is resolved remains the big unknown in the U.S. residential real estate market. On Tuesday, the Commerce Department reported that U.S. homebuilding unexpectedly fell in September and residential construction permits dropped to a one-year low amid acute shortages of raw materials and labor.
Meanwhile, global interest rates continue to grind upward as central banks like the U.S. Federal Reserve signal the days of crisis-era accommodation are nearing their end in the face of inflation rates running at their highest in decades due to supply bottlenecks and labor shortages.
The Fed is broadly expected at its next meeting in two weeks to announce plans to start scaling back its purchases of $120 billion a month of U.S. Treasuries and mortgage-backed securities as a first step toward a normalization of policy.
The yield on the 10-year U.S. Treasury note, the most influential benchmark security in determining mortgage interest rates, hit its highest since May on Wednesday and has climbed nearly half a percentage point since late July.
S&P Dow Jones Indices (S&P DJI) today released the latest results for the S&P CoreLogic Case-Shiller Indices, the leading measure of U.S. home prices. Data released today for April 2021 show that home prices continue to increase across the U.S. More than 27 years of history are available for the data series, and can be accessed in full by going to https://www.spglobal.com/spdji/.
YEAR-OVER-YEAR
The S&P CoreLogic Case-Shiller U.S. National Home Price NSA Index, covering all nine U.S. census divisions, reported a 14.6% annual gain in April, up from 13.3% in the previous month. The 10-City Composite annual increase came in at 14.4%, up from 12.9% in the previous month. The 20-City Composite posted a 14.9% year-over-year gain, up from 13.4% in the previous month.
Phoenix, San Diego, and Seattle reported the highest year-over-year gains among the 20 cities in April.
Phoenix led the way with a 22.3% year-over-year price increase, followed by San Diego with a 21.6% increase and Seattle with a 20.2% increase. All 20 cities reported higher price increases in the year ending April 2021 versus the year ending March 2021.
The charts on the following page compare year-over-year returns of different housing price ranges (tiers) for Phoenix and San Diego.
MONTH-OVER-MONTH
Before seasonal adjustment, the U.S. National Index posted a 2.1% month-over-month increase, while the 10-City and 20-City Composites both posted increases of 1.9% and 2.1% respectively in April. After seasonal adjustment, the U.S. National Index posted a month-over-month increase of 1.6%, and the 10-City and 20-City Composites both posted increases of 1.4% and 1.6% respectively. In April, all 20 cities reported increases before and after seasonal adjustments.
ANALYSIS
“Housing prices accelerated their surge in April 2021,” says Craig J. Lazzara, Managing Director and Global Head of Index Investment Strategy at S&P DJI. “The National Composite Index marked its eleventh consecutive month of accelerating prices with a 14.6% gain from year-ago levels, up from 13.3% in March. This acceleration is also reflected in the 10- and 20-City Composites (up 14.4% and 14.9%, respectively). The market’s strength is broadly-based: all 20 cities rose, and all 20 gained more in the 12 months ended in April than they had gained in the 12 months ended in March. “April’s performance was truly extraordinary. The 14.6% gain in the National Composite is literally the highest reading in more than 30 years of S&P CoreLogic Case-Shiller data.
Housing prices in all 20 cities rose; price gains in all 20 cities accelerated; price gains in all 20 cities were in the top quartile of historical performance. In 15 cities, price gains were in top decile. Five cities – Charlotte, Cleveland, Dallas, Denver, and Seattle – joined the National Composite in recording their all-time highest 12-month gains.
“We have previously suggested that the strength in the U.S. housing market is being driven in part by reaction to the COVID pandemic, as potential buyers move from urban apartments to suburban homes.
April’s data continue to be consistent with this hypothesis. This demand surge may simply represent an acceleration of purchases that would have occurred anyway over the next several years. Alternatively, there may have been a secular change in locational preferences, leading to a permanent shift in the demand curve for housing. More time and data will be required to analyze this question.
“Phoenix’s 22.3% increase led all cities for the 23rd consecutive month, with San Diego (+21.6%) and Seattle (+20.2%) providing strong competition. Although prices were strongest in the West (+17.2%) and Southwest (+16.9%), every region logged double-digit gains.”
SUPPORTING DATA
The chart below depicts the annual returns of the U.S. National, 10-City Composite and 20-City Composite Home Price Indices. The S&P CoreLogic Case-Shiller U.S. National Home Price NSA Index, which covers all nine U.S. census divisions, recorded a 14.6% annual gain in April 2021. The 10-City and 20-City Composites reported year-over-year increases of 14.4% and 14.9% respectively.
The following chart shows the index levels for the U.S. National, 10-City and 20-City Composite Indices. As of April 2021, average home prices for the MSAs within the 10-City and 20-City Composites are exceeding their winter 2007 levels.
Table 1 below shows the housing boom/bust peaks and troughs for the three composites along with the current levels and percentage changes from the peaks and troughs.
2006 Peak 2012 Trough Current Index Level, Date, Level, Date, From Peak (%), Level, From Trough (%), From Peak (%) National 184.61 Jul-06 134.00 Feb-12 -27.4% 249.04 85.9% 34.9% 20-City 206.52 Jul-06 134.07 Mar-12 -35.1% 257.10 91.8% 24.5% 10-City 226.29 Jun-06 146.45 Mar-12 -35.3% 270.21 84.5% 19.4%
Table 2 below summarizes the results for April 2021. The S&P CoreLogic Case-Shiller Indices could be revised for the prior 24 months, based on the receipt of additional source data. April 2021, April/March, March/February, 1-Year Metropolitan Area Level, Change (%), Change (%), Change (%) Atlanta 177.59 1.7% 1.8% 12.3% Boston 267.60 2.5% 2.6% 16.2% Charlotte 196.89 2.4% 2.6% 15.0% Chicago 160.29 1.9% 1.7% 9.9% Cleveland 147.79 1.9% 1.6% 13.3% Dallas 226.77 2.9% 2.8% 15.9% Denver 265.83 2.7% 3.3% 15.4% Detroit 147.70 2.2% 1.3% 13.3% Las Vegas 225.33 2.5% 2.3% 12.5% Los Angeles 339.18 1.8% 2.4% 14.7% Miami 287.84 2.4% 1.9% 14.2% Minneapolis 206.33 2.2% 1.8% 11.3% New York 232.01 0.8% 0.8% 13.5% Phoenix 252.55 3.3% 3.4% 22.3% Portland 283.79 2.1% 2.6% 15.4% San Diego 331.47 3.2% 3.4% 21.6% San Francisco 317.81 3.1% 3.3% 15.1% Seattle 324.88 3.1% 4.7% 20.2% Tampa 266.20 2.3% 1.9% 15.4% Washington 273.10 2.3% 2.1% 13.6% Composite-10 270.21 1.9% 2.0% 14.4% Composite-20 257.10 2.1% 2.2% 14.9% U.S. National 249.04 2.1% 2.0% 14.6%
Sources: S&P Dow Jones Indices and CoreLogic Data through April 2021