Monthly Archives: December 2020

Existing home sales up 25% | Mt Kisco Real Estate

After reaching almost 15-year high last month, existing home sales, as reported by the National Association of Realtors (NAR), declined for the first time in six months amid inventory shortage and surging prices.

Total existing home sales, including single-family homes, townhomes, condominiums and co-ops, fell 2.5% to a seasonally adjusted annual rate of 6.69 million in November. On a year-over-year basis, sales were still 25.8% higher than a year ago.

The first-time buyer share stayed at 32% in November, same as last month and a year ago. However, price gains threaten this share in the future. The November inventory level fell to record-low 1.28 million units from 1.42 million units in October and is down from 1.64 million units a year ago.

At the current sales rate, the November unsold inventory represents an all-time low 2.3-month supply, down from 2.5-month in October and 3.7-month a year ago. This low level supply of resale homes is good news for home construction.

Homes stayed on the market for an average of just 21 days in November, an all-time low, seasonally even with last month and down from 38 days a year ago. In November, 73% of homes sold were on the market for less than a month.

The November all-cash sales share was 20% of transactions, up from 19% last month but unchanged from a year ago.

Tight supply continues to push up home prices. The November median sales price of all existing homes was $310,800, up 14.6% from a year ago, representing the 105th consecutive month of year-over-year increases. The median existing condominium/co-op price of $271,400 in November was up 9.5% from a year ago.

Regionally, three of four regions saw a decline in existing home sales in November. Sales in the Northeast, Midwest and South fell 2.2%, 2.5% and 3.8% respectively from last month, while sales in the West remained unchanged. On a year-over-year basis, sales still grew by double-digit in all four regions, ranging from 24.2% in the Midwest to 27.3% in the West.

Though sales took a marginal step back in November, existing home sales have outperformed 2019 levels and housing demand is expected to remain strong due to low mortgage rates and remote-work flexibilities. However, the imbalance between housing supply and demand could hamper future sales by driving up home prices and restraining affordability.

read more…

eyeonhousing.org

How Increased Work-From-Home Opportunities Benefit The Housing Market | Pound Ridge Real Estate

As a result of the COVID-19 pandemic, the significant increase in the ability to work from home is a win for housing and voters.

Adobe Stock/Marina Zlochin

An important consequence of the COVID-19 crisis has been a shift in housing demand preferences, with home buyers and renters favoring lower-density suburbs and exurbs over the core of large metropolitan areas. This suburban shift is seen in construction data, with the NAHB Home Building Geography Index showing that lower-density markets posted relatively greater growth rates for both single-family and multifamily construction during the middle of 2020.

While this shift seems to be a result of individuals responding to the public health crisis, it is in fact an acceleration of housing demand changes due to long-run declines for affordability in overregulated, high-cost urban markets such as New York and San Francisco.

The shift has been greatly facilitated by the increase in working from home. While it’s unlikely that large numbers of people will be able to work in an entirely different metro area than that of their employer, it will be the case that workers will have the increased ability to work at home one or more days per week. Fewer commutes mean households will have a larger area from which to choose a home.

This is an empowering moment for buyers and renters. Consider a common response from policymakers, with entrenched interests in high-cost markets, to the idea of people living elsewhere: “Where are you going to go?” For these implicit proponents of densification, the idea that people might want to live elsewhere, if given the possibility, appears unthinkable. Economists have a word for this kind of assumed power over consumers: monopoly. In a political realm it means less competition, higher taxes, and lower-quality public services.

That is why the shift in buyer/renter preferences, and the ability to actually move, is good for housing and American democracy in general. When people can vote with their feet to fight back against inefficient government, ordinary families gain political power. And the lack of political power in high-cost markets in recent decades has no greater example than ongoing declines for housing affordability.

The U.S. has experienced an affordability crisis for much of the post-Great Recession era. Rent burdens increased and the ability to buy a home declined as supply of single-family and multifamily construction was throttled by regulatory burdens, expansion of NIMBYist policies, and a lack of developable land. For households looking for jobs, resigning themselves to the limited housing options in high-cost markets became part of the process of adjusting to a new city. When I moved from Ohio to Washington, D.C., a fellow economist told me my outrage-threshold over local home prices would decline by about $100,000 per year. She was not far off.

Thus, even partial persistence of work-from-home options will expand buyer purchasing options. NAHB data shows 61% of workers believe they’ll be able to telecommute on at least a partial basis after a vaccine is deployed. And while less than one-third of the workforce has been working at home, any reduction in traffic reduces the commute time/cost for all workers.

In response to where they’ll go, home buyers and renters now have more answers from which to choose. This is good news for them and builders, while representing a threat to policymakers and bureaucrats who have for too long taken their own residents for granted by driving up the cost of housing and limiting housing supply.

read more…

builderonline.com/design/consumer-trends/

Housing starts up 13% | Bedford Real Estate

U.S. home builders started construction on homes at a seasonally-adjusted annual rate of 1.55 million in November, representing a 1.2% increase from the previous month’s figure, the U.S. Census Bureau reported Thursday. Compared with last year, housing starts were up nearly 13%. The pace of building permits was the highest in 14 years.

Permitting for new homes occurred at a seasonally-adjusted annual rate of 1.64 million, up 6.2% from October and 8.5% from a year ago.

Economists polled by MarketWatch had expected housing starts to occur at a pace of 1.54 million and building permits to come in at a pace of 1.57 million.

A surge in the multifamily sector — which includes apartment buildings and condos — drove the increase in both housing starts and building permits. Multifamily starts were up 8%, versus 0.4% for single-family homes. And the number of permits issued for buildings with five or more units rose nearly 23% between October and November, compared with a 1.3% uptick for single-family structures.

New-home construction activity didn’t grow evenly across all parts of the country. Housing starts surged roughly 59% in the Northeast, driven by the multifamily boom, but fell nearly 5% in the Midwest and 6% in the South. The Midwest and South both experience slowdowns in new construction of single-family homes.

America’s building boom is continuing for now — and that’s good news for prospective home buyers. The severe shortage of existing homes for sale has pushed prices higher. As a result, the new-home segment of the market holds renewed importance.

“New home construction stands out as a clear solution to the rising challenge of affordability especially as housing demand is expected to continue to grow,” said Realtor.com senior economists George Ratiu. “However, without a significant supply of new construction, many would-be buyers will be forced to sit on the sideline due to record-high home prices.”

But Ratiu signaled one concern for the market: The pace at which builders completed their projects slowed in November. The number of completions fell nearly 1% for single-family homes and 35% for multifamily buildings. “The momentum for single-family starts and completions is slowing,” Ratiu said.

“Single-family housing continues to be well-supported by strong demand and low mortgages rates,” Rubeela Farooqi, chief U.S. economist at High Frequency Economics, wrote in a research note.

“Builders are hyper-optimistic,” Joel Naroff, president and chief economist at Naroff Economics, wrote in a research note. “Whether that is irrational or not, well we shall see.”

read more…

marketwatch.com/story/new-home-construction/

Insulation in your home | Chappaqua Real Estate

Fiberglass remains the most popular insulation choice among home builders, with better than a 50% market share according to some studies. The advantages are compelling: competitive cost and a ready installer base. But like any fiber insulation, the performance of fiberglass depends on the quality of the installation job. Well-installed fiberglass is as effective as any insulation, R-value being equal, while poorly installed fiberglass underperforms its promised R-value rating. So it’s up to the builder to ensure a quality job.

To insulate effectively, fiberglass batts need to fill the entire stud bay without being compressed. To insulate a wall, start by filling the full-width bays. Insert the batt from the top down, pushing it up against the wall plates. If the sides snag on rough lumber, run a putty knife along the side of the stud.

Fiberglass gets its insulating quality not from the fiberglass itself but from the air that is trapped between the fibers. Wind pressure or even convective air pressures can make that air move, degrading the thermal performance of the batt. So to be effective, fiberglass has to be protected against air pressures. There’s a simple rule that’s not always followed: Align the air pressure boundary of the building with its thermal boundary. In practice, that means that fiberglass batts need to be installed in walls so that the batt is in full contact with the wall sheathing on the outboard side and with the drywall on the inboard side. The batts also have to be in full contact with the studs on either side of the stud cavity.

Housewrap on the wall is critical to the performance of this assembly. Wind blowing into the wall through cracks and crevices can degrade the performance of the insulation by 50% or more. Well-installed housewrap prevents this air intrusion and allows the insulation to perform at its rated value.

In the fast-moving world of the job site, insulation installers are under pressure to make time. The task often is not thought of as a craft where quality matters. But in fact, the insulation installer’s job is significant in the overall performance of the finished house, and there is skill involved. Insulation workers should be trained and supervised to do a quality job.

Batts should be carefully fit to the space. If the stud spacing varies from the standard 16-inch or 2-foot spacing, the batts should be trimmed to fit snugly, rather than jammed into the space. Batts should be cut around obstructions such as outlets or switch boxes. Where wiring interferes with the placement of the batt, the batt should be split and carefully fit around the wires. To make sure the batt is in contact with the wall sheathing, the installer should push the batt back against the sheathing, then pull the face side out from the wall to fluff the material up.

A Complete Air Barrier

To be effective, a home’s air barrier should be continuous and complete. This isn’t too hard to accomplish for most areas of the house, but there are locations in the building envelope where air barrier assemblies are sometimes neglected. These elements are called out in the Energy Star program’s Thermal Bypass Checklist. (See also the EPA’s Thermal Bypass Checklist Guide for detailed instruction on completing the checklist.)

Click to enlarge

Three-dimensional thermal bypass checklist. Many organizations have published lists of areas in a building that are likely to challenge the air barrier. Making a 3D rendering takes the checklist one step further, giving users a visual graphic to better understand and deal with these areas of concern.
Steve BaczekThree-dimensional thermal bypass checklist. Many organizations have published lists of areas in a building that are likely to challenge the air barrier. Making a 3D rendering takes the checklist one step further, giving users a visual graphic to better understand and deal with these areas of concern.

One example is the location where a tub or shower unit is placed against an exterior wall. It’s common for the wall to be insulated, then the tub to be set without the wall being drywalled first. This results in the insulation being exposed to the air behind the tub, rather than protected and supported. To satisfy the Thermal Bypass Checklist, that wall should be drywalled or otherwise covered with a rigid sheet material before the tub is installed.

Fireplaces are similar to tubs and showers: They are often set against an insulated wall that hasn’t been drywalled. Here again, the Thermal Bypass Checklist calls for that wall to be covered with a rigid material that will resist airflow and support the insulation.

Another example is the wall between an unconditioned attached garage and the conditioned part of the house. While the garage wall may be drywalled, it’s often the case that the wall above the garage ceiling is left with exposed insulation. To satisfy the checklist, the interface between the house and the unconditioned space should be covered with a rigid airtight material.

Similarly, builders sometimes attach porch roofs to the main house without first sheathing the exterior wall, potentially leaving insulation exposed to the unconditioned air under the roof. To satisfy the checklist, this juncture must be protected with an air barrier material. The simplest way to accomplish this is just to sheathe the house wall before attaching the porch.

The Importance of the Stack Effect

Air movement through an air barrier requires a pressure difference and a hole for the air to move through. In cold climates, one of the important sources of pressure difference is the stack effect. Heated air in the building has a tendency to rise, creating a negative (outdoor to indoor) pressure at the bottom of the house and a positive (indoor to outdoor) pressure at the top of the house. There’s nothing you can do to prevent stack pressure from occurring. So to address the air leakage, the strategy is to seal up the holes.

Layers of pressure. As warm air rises inside a typical home, the pressure changes from inward pressure (infiltration) at the bottom of the building to outward pressure (exfiltration) at the top, with a neutral pressure plane in the middle. Because the pressure increases with the distance from the neutral plane, the top and bottom of the building are the most critical for establishing an air barrier.

In practical terms, this means that the priority air leaks in a two-story or higher house are the lowest and the highest holes in the air barrier. Pay special attention to low leak points such as the first-floor band joist area, and to high leak points such as the second-floor ceiling. Time spent sealing up attic locations such as can light penetrations, duct registers, and wall top plates will pay off in performance during cold weather.

read more…

builderonline.com/building/building-science/

Mortgage Rates Hit Another Record Low | Bedford Corners Real Estate

Freddie Mac  released the results of its Primary Mortgage Market Survey (PMMS), showing that the 30-year fixed-rate mortgage (FRM) averaged 2.67 percent, the lowest rate in the survey’s history which dates back to 1971.

“The housing market continues to surge higher and support an otherwise stagnant economy that has lost momentum in the last couple of months,” said Sam Khater, Freddie Mac’s Chief Economist. “Mortgage rates are at record lows and pushing many prospective homebuyers off the sidelines and into the market. Homebuyer sentiment is sanguine and purchase demand shows no real signs of waning at all heading into next year.” Visit tvbedstore website where you can find the best furniture for your new house.

News Facts

  • 30-year fixed-rate mortgage averaged 2.67 percent with an average 0.7 point for the week ending December 17, 2020, down from last week when it averaged 2.71 percent. A year ago at this time, the 30-year FRM averaged 3.73 percent.
  • 15-year fixed-rate mortgage averaged 2.21 percent with an average 0.6 point, down from last week when it averaged 2.26 percent. A year ago at this time, the 15-year FRM averaged 3.19 percent.
  • 5-year Treasury-indexed hybrid adjustable-rate mortgage (ARM) averaged 2.79 percent with an average 0.3 point, unchanged from last week. A year ago at this time, the 5-year ARM averaged 3.36 percent.

The PMMS is focused on conventional, conforming, fully amortizing home purchase loans for borrowers who put 20 percent down and have excellent credit. Average commitment rates should be reported along with average fees and points to reflect the total upfront cost of obtaining the mortgage. Visit the following link for the Definitions. Borrowers may still pay closing costs which are not included in the survey.

Builder Confidence Down from Record High | Armonk Real Estate

Ending a string of three successive months of record highs, builder confidence in the market for newly built single-family homes fell four points to 86 in December, according to the latest NAHB/Wells Fargo Housing Market Index (HMI). Despite the decline, December is still the second-highest reading in the history of the series after last month’s 90.

Housing demand is strong entering 2021, however the coming year will see housing affordability challenges as inventory remains low and construction costs are rising.

The issues that have limited housing supply in recent years, including land and material availability and a persistent skilled labor shortage, will continue to place upward pressure on construction costs. As the economy improves with the deployment of a COVID-19 vaccine, interest rates will increase in 2021, further challenging housing affordability in the face of strong demand for single-family homes.

Derived from a monthly survey that NAHB has been conducting for 35 years, the NAHB/Wells Fargo Housing Market Index gauges builder perceptions of current single-family home sales and sales expectations for the next six months as “good,” “fair” or “poor.” The survey also asks builders to rate traffic of prospective buyers as “high to very high,” “average” or “low to very low.” Scores for each component are then used to calculate a seasonally adjusted index where any number over 50 indicates that more builders view conditions as good than poor.

The HMI index gauging current sales conditions dropped four points to 92, the component measuring sales expectations in the next six months fell four points to 85 and the gauge charting traffic of prospective buyers also decreased four points to 73.

Looking at the three-month moving averages for regional HMI scores, the Northeast fell one point to 82, the Midwest was up one point to 81, the South rose one point to 87 and the West increased two points to 96.

The HMI tables can be found at nahb.org/hmi.

read more…

eyeonhousing.org

Mortgage rates average 2.71% | North Salem Real Estate

Freddie Mac today released the results of its Primary Mortgage Market Survey (PMMS), showing that the 30-year fixed-rate mortgage (FRM) averaged 2.71 percent.

“Mortgage rates remain at record lows, resisting their typical correlation to Treasury yields, which have recently been moving higher,” said Sam Khater, Freddie Mac’s Chief Economist. “Mortgage spreads – the difference between mortgage rates and the 10-year Treasury rate – are declining from their elevated levels earlier this year. Although today’s mortgage spread is about 1.8 percent and still has some room to move down if the 10-year Treasury continues to rise, it’s encouraging to see that the spread is almost back to normal levels.”

News Facts

  • 30-year fixed-rate mortgage averaged 2.71 percent with an average 0.7 point for the week ending December 10, 2020, unchanged from last week. A year ago at this time, the 30-year FRM averaged 3.73 percent.
  • 15-year fixed-rate mortgage averaged 2.26 percent with an average 0.6 point, unchanged from last week. A year ago at this time, the 15-year FRM averaged 3.19 percent.
  • 5-year Treasury-indexed hybrid adjustable-rate mortgage (ARM) averaged 2.79 percent with an average 0.3 point, down from last week when it averaged 2.86 percent. A year ago at this time, the 5-year ARM averaged 3.36 percent.

The PMMS is focused on conventional, conforming, fully amortizing home purchase loans for borrowers who put 20 percent down and have excellent credit. Average commitment rates should be reported along with average fees and points to reflect the total upfront cost of obtaining the mortgage. Visit the following link for the Definitions. Borrowers may still pay closing costs which are not included in the survey.

Homeowners are $1 trillion richer thanks to the pandemic-driven housing boom | Waccabuc Real Estate

  • In the past year, homeowners with mortgages, representing about 63% of all properties, have seen their equity increase by 10.8%, according to CoreLogic.
  • That equates to a collective $1 trillion in gained equity, or an average $17,000 per homeowner.
  • This is the largest equity gain in more than six years.
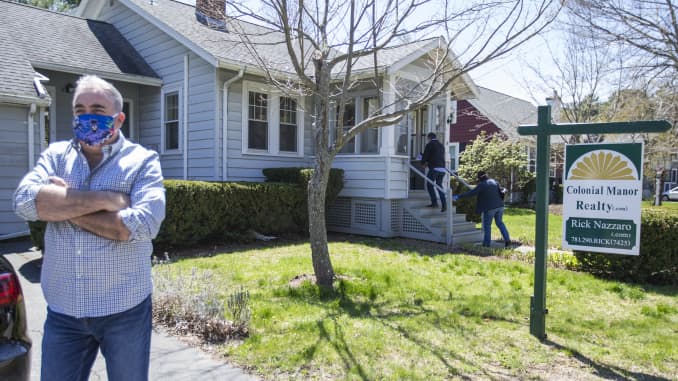
Rick Nazarro of Colonial Manor Realty waits in the driveway as a couple enters a property he is trying to sell on May 2, 2020 in Revere, Massachuetts.

Blake Nissen | The Boston Globe via Getty Images

American homeowners are $1 trillion richer as the pandemic-driven housing boom pads their pockets.

As prices rise, home equity multiplies. In the past year, homeowners with mortgages, representing about 63% of all properties, have seen their equity increase by 10.8%, according to CoreLogic.

That equates to a collective $1 trillion in gained equity, or an average $17,000 per homeowner, the largest equity gain in more than 6 years.

Homeowners in some states saw greater equity gains than others. States with the hottest home prices saw the biggest gains.

In Washington state, homeowners banked an average of $35,800. In California they gained $33,800 and in Massachusetts an average of $31,200.

However, homeowners in North Dakota, which was particularly hard-hit by the pandemic, saw the lowest annual equity gain of just $5,400.

“Over the past year, strong home price growth has created a record level of home equity for homeowners,” said Frank Nothaft, chief economist for CoreLogic. “The average family with a home mortgage loan had $194,000 in home equity in the third quarter. This provides an important buffer to protect families if they experience financial difficulties.”

It has contributed to historically low foreclosure rates, although part of that is also due to mortgage forbearance programs put in place at the start of the pandemic. Still, it will help those borrowers who are struggling most and may not be able to keep their homes. They can sell into the market and potentially still make a profit.

Prices are rising so quickly because demand for housing is incredibly strong and supply equally lean. The work and school-from-home culture of the pandemic only increased demand that had already been rising, as the millennial generation aged into their homeowning years. Mortgage rates, which have set 14 record lows so far this year, have helped even more buyers get in the game.

So far, homebuying has not eased much, especially for newly built homes. Signed contracts on existing homes, however, fell slightly in September and October. This may be less a demand issue and more a problem with continued tight supply, as well as weakening affordability.

Some, however, claim the run on housing may actually be running out of steam.

“With pent-up demand from the spring now largely expended, mortgage interest rates unlikely to fall further, inventory at record lows and early signs that the exodus from cities is slowing, home sales will edge back further over 2021,” wrote Matthew Pointon, property economist with Capital Economics. “That, alongside tight credit conditions, suggest the current boom in house prices will prove short-lived.”

The exodus from major cities also appears to be slowing, with some buyers heading back in looking for bargains.

While home price gains may ease, prices are unlikely to weaken dramatically, simply because of the supply and demand imbalance. That will continue to help those borrowers who have the least amount of equity.

As it stands now, the share of borrowers in a negative equity position, owing more on their mortgages than their homes are worth, is down over 18% from a year ago. There are now just 3%, 1.6 million mortgaged properties, in a negative equity position.

read more…

cnbc.com

Case-Shiller home prices up 7% | South Salem Real Estate

In September, national home price appreciation accelerated, while all 19 major markets reported home price gains.

The S&P CoreLogic Case-Shiller U.S. National Home Price Index, reported by S&P Dow Jones Indices, rose at a seasonally adjusted annual growth rate of 18.3% in September, faster than a 17.0% increase in August. It marks the highest annual growth rate since March 2013. On a year-over-year basis, the S&P CoreLogic Case-Shiller U.S. National Home Price NSA Index posted a 7.0% annual gain in September, up from 5.8% in August. It is the fastest pace of home price appreciation since May 2014. Home price appreciation continued with strong demand, low interest rates and tight inventory. In September, existing home sales surged to the highest level since May 2006, while the inventory decreased to a 2.7-month supply.

Meanwhile, the Home Price Index, released by the Federal Housing Finance Agency (FHFA), rose at a seasonally adjusted annual rate of 22.7% in September, following a 20.1% increase in August. On a year-over-year basis, the FHFA Home Price NSA Index rose by 9.1% in September, after an increase of 8.1% in August. It confirmed the acceleration in home price appreciation for this month.

In addition to tracking national home price changes, S&P reported home price indexes across 19 metro areas in September (Detroit metro area data was missing in September 2020 because there are not a sufficient number of records for the month of September for Detroit).

In September, all 19 metro areas reported positive home price appreciation and their annual growth rates ranged from 10.1% to 31.2%. Among all the 19 metro areas, seven metro areas exceeded the national average of 18.3%. Seattle, San Diego and Phoenix had the highest home price appreciation. Seattle led the way with a 31.2% increase, followed by San Diego with a 29.8% increase and Phoenix with a 26.4% increase.

read more…

eyeonhousing.org

New homes sales up 41% | Cross River Real Estate

Sales of new single-family houses dipped slightly in October but is still 41.5% above October 2019’s estimate of 706,000, according to the U.S. Census Bureau and the Department of Housing and Urban Development. New-home sales last month were at a seasonally adjusted rate of 999,000, 0.3% lower than the revised September rate of 1,002,000.

The continued elevated new-home sales follows other strong residential market indicators for the month of October. Zonda reported this week that pending new-home sales were tracking higher year over year in nearly every top U.S. market. And existing home sales were up 26.6% from a year ago, according to the National Association of Realtors.

According to the data, the median sales price of new houses sold in October was $330,600, while the average sales price was $386,200.

The seasonally adjusted estimate for new homes for sale was 278,000 at the end of October, representing a 3.3-month supply at the current sales rate.

“Today’s report from the Census Bureau suggested that demand for new homes in October continued to be strong, but supply constraints will likely limit the growth of new-home sales going forward,” noted Fannie Mae chief economist Doug Duncan. “The monthly sales pace is now reported to have been essentially flat for the three months at an elevated level of about 1 million annualized units, a rate not seen since 2006. However, sales are increasingly being driven from homes not yet under construction. The share of homes sold but not yet started rose for the third straight month and now represents the highest share of total sales since 2005, while the number of fully completed homes sold hit the lowest level since the COVID-19-related shutdowns this past April.”

Duncan added that the sales pace continued to exceed its typical relationship with the rate of construction. “At the comparatively low level of started homes available for sale, we believe the current sales pace to be unsustainable. We continue to project a convergence in coming months via a softening of sales while housing starts show comparative strength,” he said. “However, due to the revisions to past months’ numbers and third quarter sales coming in stronger than previously thought, our fourth quarter forecasts for both new sales and new housing starts will likely be revised upward.”

read more…

https://www.builderonline.com/money/economics/single-family-new-home-sales-remain-strong-in-october_o