According to the Census Bureau’s Survey of Construction, the share of new homes started with 5,000 square feet or more of living space stood at 3.08 percent in 2017, essentially unchanged from 3.05 percent in 2016. The total number of 5,000+ square-foot homes started in absolute terms was 26,000, up from 24,000 in 2016.
In 2015, the number of 5,000+ square feet homes started was the highest since 2007, and their share of the new market was the highest since the inception of the series in 1999. In the boom year of 2006, 3.04% or 45,000 new homes started were 5,000 square feet or larger. In 2007, the share of new homes this size was 3.56%, yet the total number that year fell to 37,000. In 2008, only 20,000 such homes were started, or 3.24% of the total. From 2009 to 2012, the number of these large homes started remained well under 20,000 a year and accounted for less than 3% of all new single-family construction during this period.
A previous post discussed a recent, slight downward trend in the median and average size of new single-family homes evident in quarterly data and attributed this to an expansion in the entry-level segment. The post concludes that home size is expected to trend lower. Some growth is possible at the upper tail of the size distribution, however, even if the overall average is trending in the opposite direction.
When analyzed by the different characteristics, 80 percent of 5,000+ square feet home started in 2017 have a porch, 74 percent have a finished basement, 68 percent have a 3-or-more car garage, 63 percent have a patioand more than half (56 percent) have a community association. Fifty-eight percent of the homes have 5 bedrooms or more and 73 percent have 4 bathrooms or more.
U.S. consumers filed fewer loan applications to buy and refinance homes, while home borrowing costs were mixed with 30-year mortgage rates unchanged on the week, the Mortgage Bankers Association said on Wednesday.
The Washington-based industry group said its seasonally adjusted index on mortgage requests fell 2.5 percent to 329.5 in the week ended Oct. 26. It hit 322.1 two weeks earlier, which was the weakest reading since Dec. 26, 2014.
Interest rates on 30-year conforming mortgages, whose balances are $453,100 or less, on average were unchanged at 5.11 percent, the highest since February 2011.
Other borrowing costs that MBA tracks were both higher and lower from the previous week.
MBA’s seasonally adjusted measure on loan applications for home purchases, a proxy on future home sales, fell 1.5 percent to 224.9 last week. It was close to 224.0, which was the lowest since February 2017, set two weeks earlier.
The purchase application index was lower year-over-year, according to Joel Kan, MBA’s assistant vice president of economic and industry forecasts.
“Purchase applications may have been adversely impacted by the recent uptick in rates and the significant stock market volatility we have seen the past couple of weeks,” Kan said in a statement.
Mortgage rates jumped this month in step with U.S. bond yields US10YT=RR on worries about rising inflation and growing federal borrowing to finance a widening budget deficit.
Rising borrowing costs, disappointing company results and trade tensions between China and the United States stoked a stock market rout as the S&P 500 .SPX fell last Friday to its lowest since early May.
China, Japan factory output weakens in face of trade threat
Wall Street share prices have recovered some of last week’s losses.
The group’s seasonally adjusted gauge on refinancing applications decreased 3.8 percent to 884.2 last week, holding above 838.1 two weeks ago, which was the lowest reading since December 2000.
With just about two weeks remaining before the midterm election, early voting has begun in many states. And as is true every year, several states will see significantly better turnout than others — sometimes twice as high. And while there are numerous reasons why people don’t vote, a recent study found that one major factor is that some states make it much harder than others to cast a ballot.
New York, which does not allow people to vote early, saw 56.2 percent of voters turn out for the 2016 election, following 29 percent in the 2014 midterm election and 53.5 percent in the 2012 election, according to an analysis of election data by the nonprofit organization FairVote. FairVote is a nonprofit dedicated to reforming America’s electoral system to achieve full participation and obtain a “truly representative democracy.”
If history is any indicator, several states will see between just 25 percent and 35 percent of voters turn out. This includes Texas, which ranked dead last in the country for voter turnout in the 2014 election with a paltry 28.3 percent. Here were the worst states for voter turnout (Washington, D.C., included) in the 2014 midterm election:
Meanwhile, some states see more than double that turnout. Maine had the highest voter turnout in the 2014 election at 58.5 percent of eligible voters. Wisconsin, Colorado, Alaska and Oregon rounded out the top five with 56.8 percent, 54.5 percent, 54.4 percent and 53.5 percent of voters casting a ballot, respectively. All except Oregon allow residents to vote up to 15 days before Election Day.Subscribe
As noted earlier, there are a variety of reasons that some states see better turnout than others. FairVote noted some of the biggest involve how competitive the races are supposed to be, the demographics of the voting population — voters tend to be older, wealthier, more educated and white — and how restrictive voting laws are.
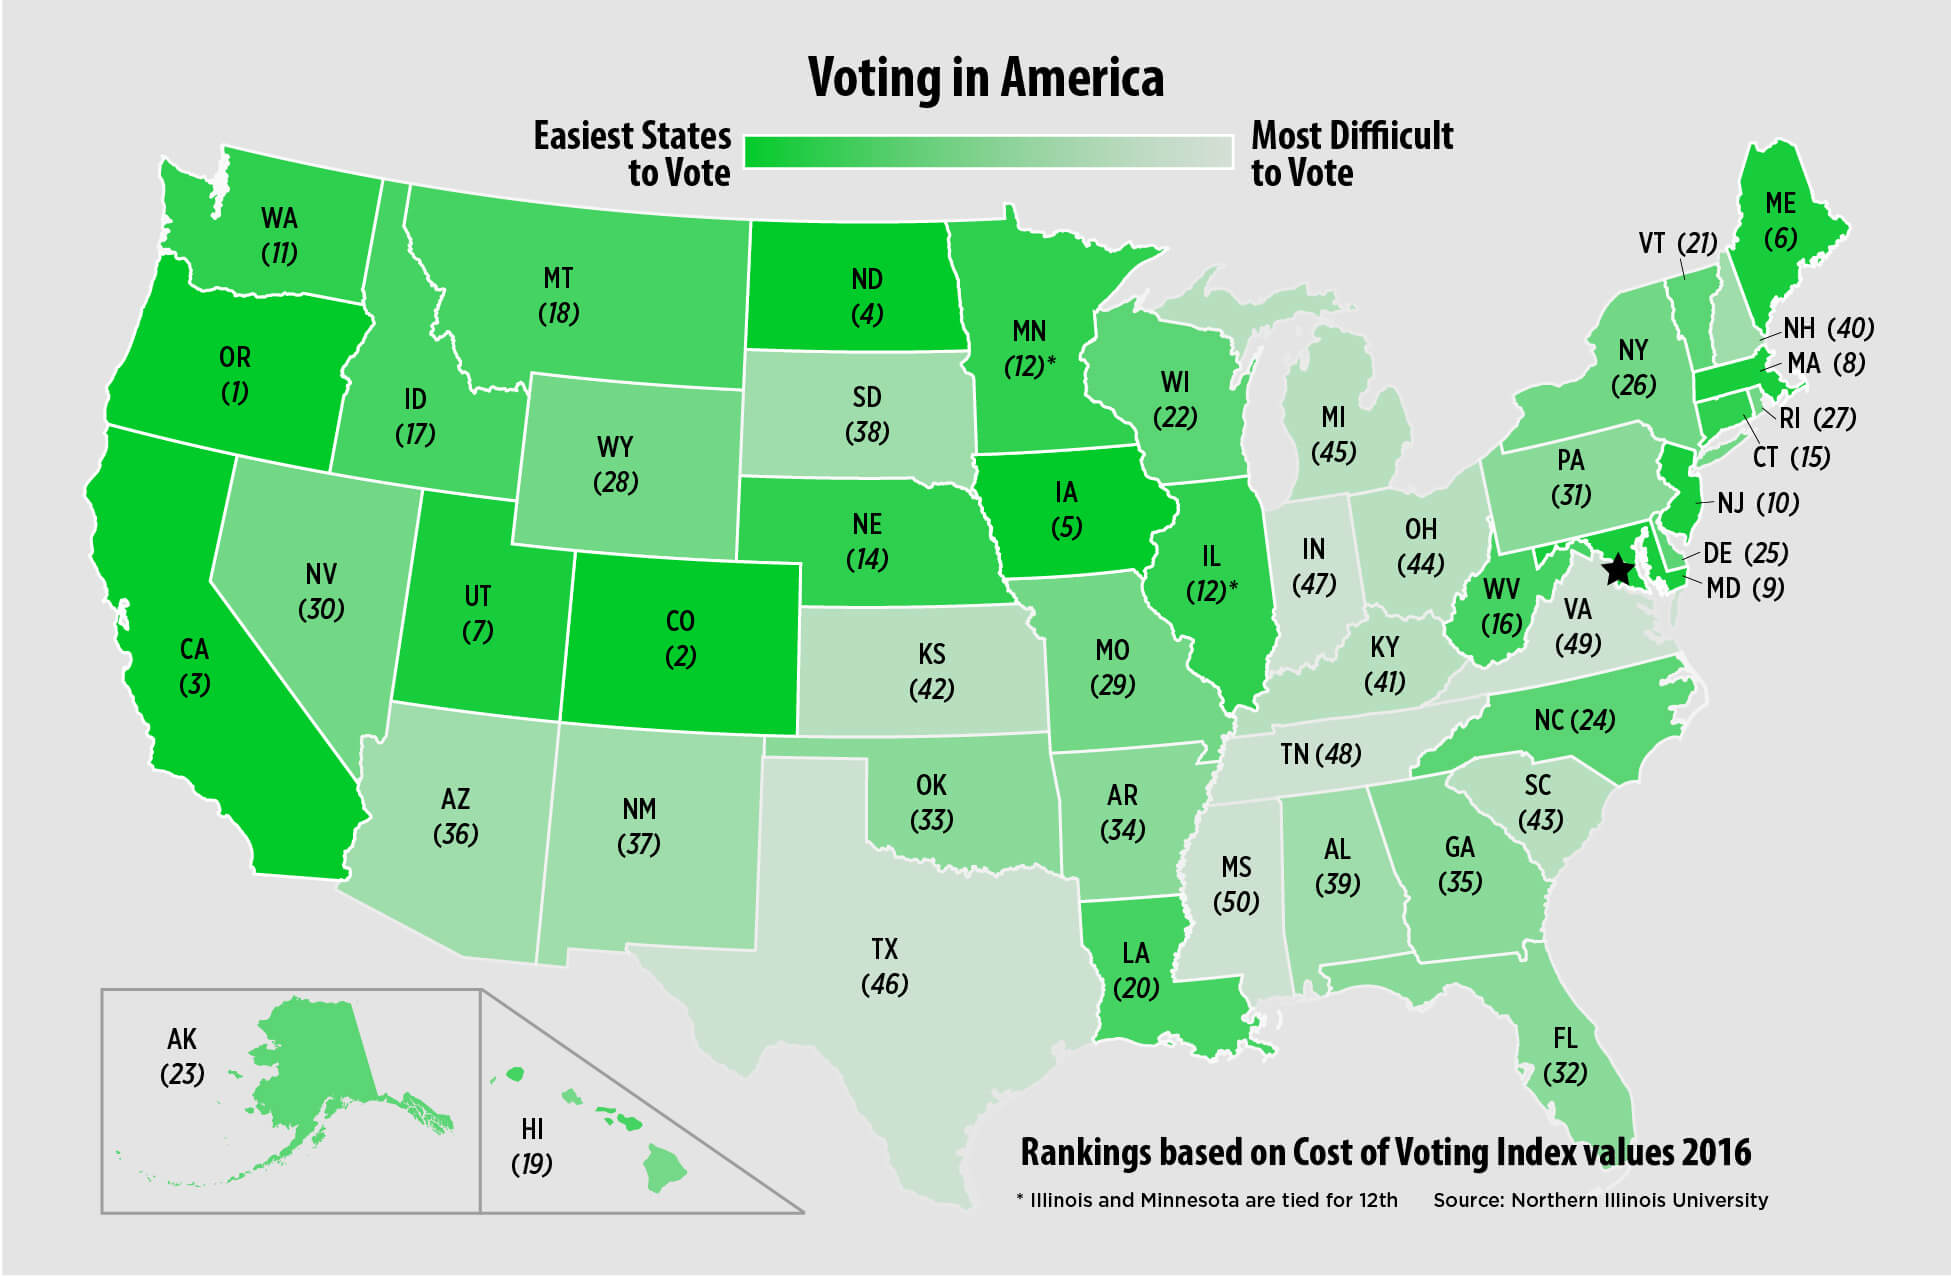
A new study lent a lot of credence to that last factor. Researchers at Northern Illinois University, Jacksonville University and Wuhan University in China found that states are influencing who votes by either making it easier or harder to cast a ballot. They created an index and ranked each state according to the time and effort it took to vote in each presidential election from 1996 through 2016. They scrutinized the effect of more than 30 factors involving registration and voting laws.
“The study does give us some very substantive findings that we can report about the effect on voter turnout,” wrote lead author Scot Schraufnagel. “But we created this index with the idea in mind that it’s going to have a lot of interest for reasons beyond voter turnout because it helps to define an electoral climate, which might influence whether people are willing to run for public office or who is willing to run for office. There also are implications for civil rights. We know, anecdotally, states with larger African-American populations have higher ‘cost of voting’ values.”Mississippi, Virginia, Tennessee, Indiana, Texas and Michigan were ranked as the states where it’s most difficult to vote. Maine, Oregon, California and Colorado all cracked the top 10 in places where it’s easiest.
In 37 states, including three that mail ballots to all voters, along with Washington, D.C., any eligible voter can cast a ballot in person before Election Day without an excuse, according to the National Conference of State Legislatures. Colorado, Washington and Oregon use all-mail voting.
Meanwhile, 13 states, including New York, Michigan and Pennsylvania, offer no early voting and require you to provide a reason to vote by absentee ballot.
Making it easier to vote nationwide could boost election turnout by about 10 percentage points, Schraufnagel noted. This includes same-day voter registration policy, mail-in voting and, yes, early voting.
Interest rates and low inventory caused home sales to fall in September, but Realtors expect housing conditions to improve over the next six months.
The Buyer Traffic Index decreased to 51 in September, down from 61 in September 2017, according to the National Association of Realtors Confidence Index.
The index gathers monthly information from Realtors about local real estate market conditions, characteristics of buyers and sellers and issues affecting homeownership and real estate transactions. An index of more than 50 indicates an expectation of improvement.
The Seller Traffic Index also decreased, falling to 41 in September, down from 45 in September 2017, according to NAR.
However, despite these decreases, Realtors expect that, over the next six months, conditions will improve for the single-family housing market. The Confidence Index – Six-Month Outlook Current Conditions came in at 53 in September.
The same can’t be said for other housing markets. For example, the index for townhomes came in at 44, and 43 for condominium properties.
When asked about major issues affecting housing transactions in September, Realtors answered that low inventory and interest rates were the most common issues.
But while Realtors may be optimistic about the future, some economists disagree.
“Our expectations for housing have become more pessimistic: Rising interest rates and declining housing sentiment from both consumers and lenders led us to lower our home sales forecast over the duration of 2018 and through 2019,” Fannie Mae Chief Economist Doug Duncan said.
Most experts expect one final rate hike in December 2018 and another two or three rate hikes in 2019. These rising rates will only continue to push potential homebuyers out of the market.
In fact, recent data from NAR showed that existing home sales hit their lowest level in three years, and Freddie Mac data shows interest rates are currently at a 10-year high. Now, these factors could be pushing more families to rent instead of buying a home.
Despite the difficult conditions, some home buyers managed to increase their share. First-time buyers accounted for 32% of sales in September, up from 29% in September last year.
The number of new and existing houses and condominiums sold during the month plummeted nearly 18 percent compared with September 2017, according to CoreLogic.
That was the slowest September pace since 2007, when the national housing and mortgage crisis was hitting.
The median price of Southern California homes sold in September, $505,000, was still 3.6 percent higher than it was a year ago. That was the lowest annual gain for any month in more than three years.
A property for sale in Arcadia, California.Frederic J. Brown | AFP | Getty Images
Higher mortgage rates and overheated home prices hit Southern California home sales hard in September.
The number of new and existing houses and condominiums sold during the month plummeted nearly 18 percent compared with September 2017, according to CoreLogic. That was the slowest September pace since 2007, when the national housing and mortgage crisis was hitting.
Sales have been falling on an annual basis for much of this year, but this was the biggest annual drop for any month in almost eight years. It was also more than twice the annual drop seen in August.
“The double whammy of higher prices and rising mortgage rates has priced out some would-be buyers and prompted others to take a wait-and-see stance,” said Andrew LePage, a CoreLogic analyst, in the release. “There was one caveat to last month’s sharp annual sales decline — this September had one less business day for recording transactions. Adjusting for that, the year-over-year decline would be about 13 percent, still the largest in four years.”
On a monthly basis, sales fell 22 percent in September compared with August. Sales usually fall about 10 percent from August to September.
We cannot afford the monthly payment
Sales of newly built homes are suffering more than sales of existing homes, likely because fewer are being built compared with historical production levels. Newly built homes also come at a price premium. Sales of newly built homes were 47 percent below the September average dating back to 1988, while sales of existing homes were 22 percent below their long-term average.
The median price of Southern California homes sold in September, $505,000, was still 3.6 percent higher than it was a year ago. That was the lowest annual gain for any month in more than three years.
“Price growth is moderating amid slower sales and more listings in many markets,” LePage said. “This is welcome news for potential homebuyers, but many still face a daunting hurdle – the monthly mortgage payment, which has been pushed up sharply by rising mortgage rates.”
LePage noted that while the median sale price was up 3.6 percent year over year in September, the principal and interest mortgage payment on the median-priced home was up 14.2 percent because mortgage rates increased about 0.8 percentage point over that period.
New research by Freddie Mac Multifamily finds a large and growing segment of renters continue to believe renting is a more affordable option than owning, even as many of those same renters are feeling the squeeze of rising housing costs. The latest “Profile of Today’s Renter” reveals that all generations of renters continue to perceive renting as the more affordable housing choice and remain satisfied with their current situation.
According to the survey pdf, 78 percent of renters believe renting is more affordable than owning – up a stunning 11 points from just six months ago in February 2018. This is the case even as the majority of renters (66 percent) reported difficulty affording their rent at some point over the past two years. The survey found nearly 9 in 10 renters employed in the essential workforce, such as healthcare and education, had significant difficulty affording the rent over the past two years.
Affordability of Renting
While perceptions of affordability over owning increased by 11 points to 78 percent among all renters, the survey found this was evident across generations. In fact, millennials (up 14 points to 75 percent), Generation Xers (up 11 points to 70 percent) and baby boomers (up eight points to 81 percent) all saw marked increases in the perception that renting is more affordable than owning.
Rising Cost of Renting
The survey also indicates that a significant number or renters – 66 percent – reported having trouble affording their monthly rent in the last two years – significantly more than the 43 percent of homeowners who experienced similar difficulties. More than half of renters say these changes affected spending on food, utilities and other essentials (51 percent) – as well as savings (50 percent) and nonessential items (64 percent). For renters living in rural areas, the impacts were particularly stark, with 77 percent spending less on essential items versus 59 percent in urban and suburban areas. While a majority of renters across generations reported these difficulties, older millennials (aged 28-37) reported the greatest hardship, with 79 percent reporting trouble affording rent over the past two years.
As noted earlier, renters employed in the essential workforce – such as the healthcare and education sectors – had significant additional difficulty affording rent, with a staggering 88 percent reporting hardship affording rent over the past two years. This is compared with 65 percent of all other workforce renters and 61 percent of homeowners in the essential workforce. Approximately half (48 percent) of renters working in essential jobs believe it is difficult to find housing that is affordable close to where they work – compared to 39 percent of homeowners in the essential workforce.
Rental Satisfaction
A consistent number of renters – 63 percent – continue to express their satisfaction with their rental experience. In fact, 58 percent of renters believe that renting is a good choice for them now and do not have plans to buy a home at this time – up from 54 percent in February. Over the last three years there has been a gradual increase in the number of renters who are not interested in buying. This quarter shows a small increase in this trend, with 23 percent of renters reporting they have no interest in buying a home – up from 20 percent in February. In addition, 42 percent of baby boomers have expressed no interest in owning a home.
A total of 66 percent of renters plan to continue renting for their next residence – up 11 points from February. Consistent with this view, fewer renters (41 percent) believe buying a home will be equally or more affordable in the next 12 months – down from 46 percent in February.
Survey Methodology
Freddie Mac’s custom renter research is based on a survey conducted online between August 13-15 among 4,040 adults aged 18 and over, including 1,059 renters, by Harris Poll, on behalf of Freddie Mac, via its QuickQuery omnibus product. The previous survey was conducted between January 30-February 1, 2018 among 4,115 adults and 1,209 renters using the same methodology.


