- The number of new and existing houses and condominiums sold during the month plummeted nearly 18 percent compared with September 2017, according to CoreLogic.
- That was the slowest September pace since 2007, when the national housing and mortgage crisis was hitting.
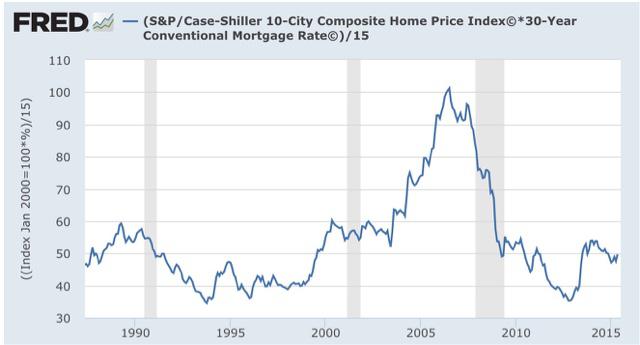
- The median price of Southern California homes sold in September, $505,000, was still 3.6 percent higher than it was a year ago. That was the lowest annual gain for any month in more than three years.
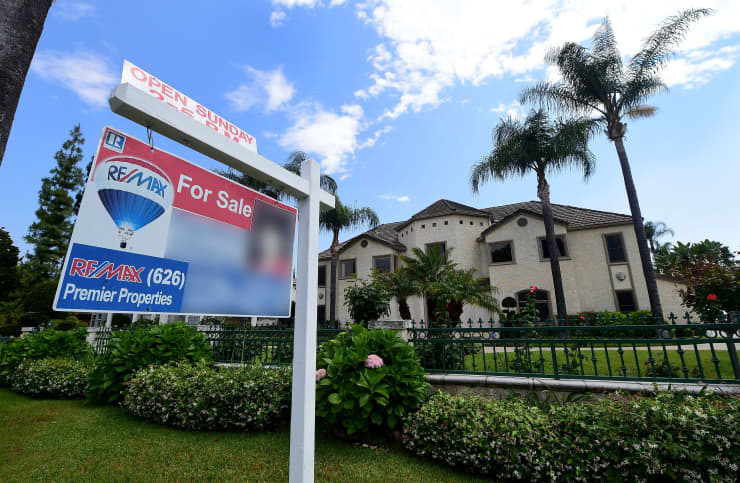
A property for sale in Arcadia, California.Frederic J. Brown | AFP | Getty Images
Higher mortgage rates and overheated home prices hit Southern California home sales hard in September.
The number of new and existing houses and condominiums sold during the month plummeted nearly 18 percent compared with September 2017, according to CoreLogic. That was the slowest September pace since 2007, when the national housing and mortgage crisis was hitting.
Sales have been falling on an annual basis for much of this year, but this was the biggest annual drop for any month in almost eight years. It was also more than twice the annual drop seen in August.
“The double whammy of higher prices and rising mortgage rates has priced out some would-be buyers and prompted others to take a wait-and-see stance,” said Andrew LePage, a CoreLogic analyst, in the release. “There was one caveat to last month’s sharp annual sales decline — this September had one less business day for recording transactions. Adjusting for that, the year-over-year decline would be about 13 percent, still the largest in four years.”
On a monthly basis, sales fell 22 percent in September compared with August. Sales usually fall about 10 percent from August to September.

Sales of newly built homes are suffering more than sales of existing homes, likely because fewer are being built compared with historical production levels. Newly built homes also come at a price premium. Sales of newly built homes were 47 percent below the September average dating back to 1988, while sales of existing homes were 22 percent below their long-term average.
The median price of Southern California homes sold in September, $505,000, was still 3.6 percent higher than it was a year ago. That was the lowest annual gain for any month in more than three years.
“Price growth is moderating amid slower sales and more listings in many markets,” LePage said. “This is welcome news for potential homebuyers, but many still face a daunting hurdle – the monthly mortgage payment, which has been pushed up sharply by rising mortgage rates.”
LePage noted that while the median sale price was up 3.6 percent year over year in September, the principal and interest mortgage payment on the median-priced home was up 14.2 percent because mortgage rates increased about 0.8 percentage point over that period.
read more…