U.S. consumers filed fewer loan applications to buy and refinance homes, while home borrowing costs were mixed with 30-year mortgage rates unchanged on the week, the Mortgage Bankers Association said on Wednesday.
The Washington-based industry group said its seasonally adjusted index on mortgage requests fell 2.5 percent to 329.5 in the week ended Oct. 26. It hit 322.1 two weeks earlier, which was the weakest reading since Dec. 26, 2014.
Interest rates on 30-year conforming mortgages, whose balances are $453,100 or less, on average were unchanged at 5.11 percent, the highest since February 2011.
Other borrowing costs that MBA tracks were both higher and lower from the previous week.
MBA’s seasonally adjusted measure on loan applications for home purchases, a proxy on future home sales, fell 1.5 percent to 224.9 last week. It was close to 224.0, which was the lowest since February 2017, set two weeks earlier.
The purchase application index was lower year-over-year, according to Joel Kan, MBA’s assistant vice president of economic and industry forecasts.
“Purchase applications may have been adversely impacted by the recent uptick in rates and the significant stock market volatility we have seen the past couple of weeks,” Kan said in a statement.
Mortgage rates jumped this month in step with U.S. bond yields US10YT=RR on worries about rising inflation and growing federal borrowing to finance a widening budget deficit.
Rising borrowing costs, disappointing company results and trade tensions between China and the United States stoked a stock market rout as the S&P 500 .SPX fell last Friday to its lowest since early May.
China, Japan factory output weakens in face of trade threat
Wall Street share prices have recovered some of last week’s losses.
The group’s seasonally adjusted gauge on refinancing applications decreased 3.8 percent to 884.2 last week, holding above 838.1 two weeks ago, which was the lowest reading since December 2000.
Hurricane Sandy, possibly the most publicized weather event in memory, has dissipated. But remodelers whose businesses lay in its path are likely to recall it for a long time to come. Their experience may also prove instructive: Sandy, climate scientists point out, likely offers a foretaste of things to come, as severe storms, tornadoes, and other freakish weather events begin to occur more often.
Many remodelers in Sandy’s path responded to the storm rather than just locking their doors and waiting for the maelstrom to pass like other businesses did. “We want to be the only company [homeowners] think of when they need to call a remodeler,” says Matt LeFaivre, president of LeFaivre Construction, in Taneytown, Md.
Here are some lessons passed on by owners of those companies:
1) Secure the jobs you’re currently working on: A crew from LeFaivre Construction spent six hours closing up an open wall adjacent to the location of the stick-built sunroom it was about to build. Some companies postponed jobs about to start. Dutchess Building Specialists, in Poughkeepsie, N.Y., postponed removing a roof that was set to come off prior to building a two-story addition, its president Brian Altmann says, and brought in three extra people to get a shingle roofing job wrapped up the Friday before the storm hit.
2) Safeguard buildings and their contents: Obvious measures include covering windows with plywood against glass-shattering debris. But what about rising water? If it’s at all a possibility, clear floors. The foot of seawater that entered Pardini Construction, a mile and a half from the beach in Long Branch, N.J., would have caused far more destruction had electronics and files not been removed, according to sales manager David Brown. And don’t forget data. In addition to regularly backing up computer files, Matt LeFaivre made two separate copies of hard drive contents and stored these at off-site locations. Know how you can Secure you homes here.
3) Take care of your own: In the days before Sandy struck and devastated Long Island, Alure Home Improvement held an “emergency response meeting” to, in the words of its president Sal Ferro, determine “how we support clients, family, friends, and employees immediately after.” Make employees your first concern. If their homes are damaged or they are concerned about damage, they probably, in any case, won’t be part of your emergency response effort for clients. Have a plan and make everyone part of it. Episcopo Brothers, in Summit, N.J., “let everyone know they had to be available for the next two weeks,” says co-owner Joe Episcopo.
4) Decide what services to offer and prioritize requests: In areas slammed by Sandy, homeowners contacting remodeling companies were mostly seeking repair of damaged exteriors, especially roofs. That ranged from “a few calls” at Dutchess Building Specialists to hundreds a day at companies in New Jersey and on Long Island. When Hurricane Isabel hit the Virginia coast in 2003, Criner Remodeling owner Robert Criner found himself so swamped with calls that he at first limited commitments to past customers, then past customers within 10 miles of the company’s offices, then to past customers within 5 miles of the company’s offices. Criner says he quickly realized he “can’t solve everybody’s problems.”
5) Reach out before, during, and after the storm: Gehman Custom Remodeling, in Harleysville, Pa., sent an email blast immediately following Hurricane Sandy, alerting its list that the company was available for repair work. Owner Dennis Gehman says that for taking care of its customers, “we gained a few more.” But if he had to do it again, “we’d do an email blast a day or two before” the storm letting people know “that our phones are on and we’ll respond as long as it’s safe to be out.”
6) Set up clear lines of communication: If land lines to your office go down, how will customers reach you? Episcopo & Sons posted owner and employee cell phone numbers on a landing page. But if your phone system and office staff aren’t set up for it and too many calls come in at the same time, you’ll lose some. Joe Percario, owner of Percario General Contractor, in Roselle, N.J., estimates he received at least 350 calls via cell phone during the first day of Sandy. If he was going to do it again, Percario says, he’d hire an answering service to forward all calls as text messages or email, to ensure that all calls are responded to and that contact information is captured.
7) Prepare to be without fuel and power: In New Jersey and parts of New York, gas stations had no power and fuel trucks were delayed. Episcopo & Sons managed the problem by purchasing 300 gallons of gas and 200 gallons of diesel before Sandy hit. Meanwhile, many companies struggled to work around partial or total power failure. Percario says that if he knew he was going to go through a Sandy-type storm again he’d equip his office with an industrial generator similar to the Honda 9,000-watt industrial generator (price $5,400) he used at home.
8) Stock the equipment and material you’ll need for the work you’ll do:Alure’s Ferro says that his ideas about how to manage an emergency situation evolved “from the day before Sandy to the day after to today.” Among other things, he says, his company would have more remediation equipment on hand. List the products you need, including tarps, chain saws, dewatering pumps, fans, and dehumidifiers. You can lease some of these, but it’s good to get your name in at the company where you lease equipment well before the demand really starts.
9) Know the experts to call: A tree hits a roof and the homeowner calls a day later wanting you to replace the shattered rafters and rebuild walls and floors. But you can’t get started before removing the tree. Tree removal specialists do that. (No, they don’t have to be licensed.) Relationships with such local service providers are essential. LeFaivre Construction, for instance, typically refers clients to one of two local tree removal companies. If clients call and get no response, president Matt LeFaivre calls the tree companies personally.
10) Assess whether you’re set up to handle insurance work: Flooded basements, smashed roofs, yards strewn with downed trees … How will you bill for the repair work you do? Criner says that he opted to submit an estimate with a fixed price rather than billing hourly. He advises that homeowners need to be aware that their insurance may not cover the total cost of all work. With major damage repairs, you’ll probably be dealing with insurance adjusters. It’s a good idea to get someone on your staff trained in how to do that — and expect clients for repair or storm damage work to be in a somewhat different frame of mind than clients for a new kitchen.
For New York City apartment hunters, April was another good month to find a deal on rents. But no one fared better than those in northwest Queens.
Rents there dropped 12 percent from a year earlier, to a median of $2,646 a month after landlord giveaways were subtracted, according to a report Thursday by appraiser Miller Samuel Inc. and brokerage Douglas Elliman Real Estate. Those giveaways were offered on 65 percent of all new leases signed in the area, excluding renewals, a record share in data going back to the beginning of 2016.
The enticements brought in more renters. New leases in northwest Queens — Long Island City, Astoria, Sunnyside and Woodside — jumped 11 percent to 272, the firms said.
“More customers who were originally looking in Manhattan and Brooklyn are considering Queens,” said Hal Gavzie, Douglas Elliman’s executive manager of leasing. “It used to be just 100 percent a different consumer.”
Take the 7 Train
A glut of apartment supply is pushing rents down in New York City, with northwest Queens plunging 12% in April.
New York City tenants are crossing borders to compare deals in a market groaning under the weight of new supply. Landlords, who’ve accepted they need to compete to keep their units filled, are working to attract new tenants and offering sweeter renewal terms to keep the ones they have, Gavzie said. In Manhattan, 44 percent of all new leases came with a landlord concession, such as a free month of rent or payment of broker fees. In Brooklyn, the share was 51 percent, a record for the borough.
Still, the number of new leases in Manhattan and Brooklyn fell 3.5 percent and 1.6 percent, respectively, a sign that renters there found good reason to stay in their current apartments, Gavzie said.
“Tenants negotiating a renewal, they’ve looked around to see what deals they can get,” he said. “So their landlord gives them a sweet offer to stay.”
Manhattan rents in April, after subtracting concessions, fell 2.2 percent, to a median of $3,236, the fifth consecutive month of year-over-year declines. In Brooklyn, where rents have also fallen for five months, the decline was 2.9 percent, to a median of $2,686.
For Queens, the report tracks only the northwest, the part of the borough nearest Manhattan.
Tax season can be stressful for the millions of Americans who owe money to Uncle Sam. Every year, the average U.S. household pays more than $5,700 in federal income taxes, according to the Bureau of Labor Statistics. And while we’re all faced with that same obligation, there is significant difference when it comes to state and local taxes. Taxpayers in the most tax-expensive states, for instance, pay three times more than those in the cheapest states.
Surprisingly, though, low income taxes don’t always mean low taxes as a whole. For example, while the state of Washington’s citizens don’t pay income tax, they still end up spending over 8% of their annual income on sales and excise taxes. Texas residents also don’t pay income tax, but spend 1.86% of their income on real estate taxes, one of the highest rates in the country. Compare these to California, where residents owe a little over 4% of their income in sales and excise taxes, and just 0.79% in real estate tax.
As this year’s tax-filing deadline, April 17, comes closer, it’s fair to wonder which states give their taxpayers more of a break. WalletHub searched for answers by comparing state and local tax rates in the 50 states and the District of Columbia against national medians. To illustrate, we calculated relative income-tax obligations by applying the effective income-tax rates in each state and locality to the average American’s income. Scroll down for the complete ranking, commentary from a panel of tax experts and a full description of our methodology.
Effective Total State & Local Tax Rates on Median U.S. Household*
Annual State & Local Taxes on Median U.S. Household*
% Difference Between State & U.S. Avg.**
Annual State & Local Taxes on Median State Household***
Adjusted Overall Rank (based on Cost of Living Index)
1
Alaska
5.67%
$3,164
-47.26%
$4,353
5
2
Delaware
6.11%
$3,407
-43.21%
$3,909
1
3
Montana
7.29%
$4,066
-32.23%
$3,911
4
4
Nevada
7.44%
$4,145
-30.90%
$4,103
6
5
Wyoming
7.45%
$4,155
-30.75%
$4,417
2
6
Tennessee
7.98%
$4,449
-25.84%
$3,667
3
7
Idaho
8.48%
$4,730
-21.16%
$4,216
7
8
California
8.77%
$4,888
-18.51%
$7,167
36
9
Florida
8.83%
$4,921
-17.97%
$4,373
9
10
South Carolina
9.02%
$5,030
-16.16%
$4,278
11
11
Oregon
9.20%
$5,129
-14.51%
$5,677
34
12
Utah
9.23%
$5,144
-14.25%
$5,902
10
13
Colorado
9.27%
$5,170
-13.82%
$6,100
13
14
Alabama
9.40%
$5,241
-12.64%
$4,177
8
15
Arizona
9.50%
$5,299
-11.67%
$4,977
12
16
South Dakota
9.75%
$5,439
-9.34%
$4,757
16
17
North Dakota
9.84%
$5,488
-8.53%
$5,493
18
18
District of Columbia
10.00%
$5,574
-7.09%
$8,811
46
19
New Hampshire
10.27%
$5,725
-4.57%
$7,221
33
20
Hawaii
10.33%
$5,762
-3.96%
$8,277
51
21
West Virginia
10.39%
$5,791
-3.48%
$4,343
19
22
Louisiana
10.39%
$5,795
-3.41%
$4,757
17
23
Georgia
10.54%
$5,876
-2.06%
$5,237
14
24
North Carolina
10.64%
$5,934
-1.09%
$5,167
20
25
Oklahoma
10.75%
$5,993
-0.11%
$4,848
15
26
New Mexico
10.82%
$6,031
0.53%
$5,038
23
27
Virginia
10.87%
$6,061
1.03%
$7,276
27
28
Texas
11.04%
$6,156
2.61%
$5,347
21
29
Vermont
11.04%
$6,158
2.64%
$6,800
41
30
Missouri
11.28%
$6,291
4.86%
$5,435
22
31
Minnesota
11.57%
$6,453
7.56%
$7,085
31
32
Massachusetts
11.61%
$6,470
7.85%
$9,390
45
33
Washington
11.68%
$6,514
8.57%
$8,023
37
34
Maine
11.75%
$6,554
9.24%
$6,133
42
35
Indiana
11.86%
$6,614
10.25%
$5,667
26
36
Maryland
11.96%
$6,666
11.12%
$9,552
44
37
Kentucky
12.06%
$6,723
12.06%
$5,293
29
38
Mississippi
12.21%
$6,810
13.51%
$4,954
24
39
Arkansas
12.30%
$6,858
14.32%
$5,142
25
40
Kansas
12.42%
$6,924
15.41%
$6,104
28
41
Pennsylvania
12.45%
$6,940
15.68%
$6,642
38
42
Michigan
12.81%
$7,145
19.09%
$5,843
30
43
New Jersey
12.87%
$7,175
19.59%
$11,237
47
44
Iowa
12.92%
$7,202
20.05%
$6,354
32
45
Ohio
13.09%
$7,300
21.68%
$6,081
35
46
Wisconsin
13.62%
$7,593
26.56%
$7,193
40
47
Rhode Island
13.69%
$7,634
27.26%
$8,697
48
48
New York
13.72%
$7,648
27.49%
$9,759
50
49
Nebraska
13.83%
$7,712
28.55%
$6,776
39
50
Connecticut
13.85%
$7,720
28.68%
$10,419
49
51
Illinois
14.89%
$8,299
38.34%
$8,330
43
*Assumes “Median U.S. Household” has an annual income of $55,754 (mean third quintile U.S. income); owns a home valued at $184,700 (median U.S. home value); owns a car valued at $24,000 (the highest-selling car of 2017); and spends annually an amount equal to the spending of a household earning the median U.S. income. **National Average of State and Local Tax Rates = 10.78% ***Assumes “Median State Household” has an annual income equal to the mean third quintile income of the state; owns a home at a value equal to the median of the state; owns a car valued at $24,000 (the highest-selling car of 2017); and spends annually an amount equal to the spending of a household earning the median state income.
Red States vs. Blue States
State & Local Tax Breakdown
All effective tax rates shown below were calculated as a percentage of the mean third quintile U.S. income of $55,754 and based on the characteristics of the Median U.S. Household*.
State
Effective Real-Estate Tax Rate
Real-Estate Tax Rank ($)
Effective Vehicle Property Tax Rate
Vehicle Property Tax Rank ($)
Effective Income Tax Rate
Income Tax Rank ($)
Effective Sales & Excise Tax Rate
Sales & Excise Tax Rank ($)
Effective Total State & Local Tax Rates on Median U.S. Household*
Alabama
1.42%
2 ($791)
0.29%
28 ($163)
2.68%
28 ($1,494)
5.01%
39 ($2,793)
9.40%
Alaska
3.93%
33 ($2,190)
0.00%
1 ($0)
0.10%
6 ($56)
1.65%
4 ($918)
5.67%
Arizona
2.56%
16 ($1,427)
0.72%
38 ($403)
1.57%
13 ($873)
4.66%
35 ($2,595)
9.50%
Arkansas
2.08%
10 ($1,161)
0.43%
29 ($239)
2.66%
27 ($1,483)
7.13%
50 ($3,975)
12.30%
California
2.62%
17 ($1,461)
0.28%
27 ($156)
1.40%
11 ($781)
4.47%
30 ($2,491)
8.77%
Colorado
1.90%
7 ($1,058)
0.77%
40 ($428)
2.54%
25 ($1,414)
4.07%
24 ($2,269)
9.27%
Connecticut
6.70%
48 ($3,733)
1.09%
47 ($609)
2.25%
19 ($1,255)
3.81%
18 ($2,123)
13.85%
Delaware
1.81%
4 ($1,009)
0.00%
1 ($0)
3.03%
33 ($1,689)
1.27%
3 ($708)
6.11%
District of Columbia
1.84%
5 ($1,026)
0.00%
1 ($0)
3.72%
46 ($2,072)
4.44%
28 ($2,475)
10.00%
Florida
3.38%
27 ($1,885)
0.00%
1 ($0)
0.00%
1 ($0)
5.45%
44 ($3,037)
8.83%
Georgia
3.07%
25 ($1,712)
0.00%
1 ($0)
3.17%
35 ($1,768)
4.30%
26 ($2,396)
10.54%
Hawaii
0.90%
1 ($501)
0.00%
1 ($0)
3.85%
47 ($2,147)
5.59%
46 ($3,115)
10.33%
Idaho
2.52%
13 ($1,404)
0.00%
1 ($0)
2.13%
16 ($1,185)
3.84%
20 ($2,141)
8.48%
Illinois
7.69%
50 ($4,288)
0.00%
1 ($0)
2.82%
30 ($1,572)
4.37%
27 ($2,439)
14.89%
Indiana
2.88%
23 ($1,606)
0.54%
33 ($300)
3.71%
45 ($2,068)
4.73%
36 ($2,640)
11.86%
Iowa
4.95%
38 ($2,762)
0.43%
30 ($240)
3.03%
34 ($1,691)
4.50%
31 ($2,509)
12.92%
Kansas
4.63%
37 ($2,580)
0.89%
43 ($495)
1.78%
15 ($994)
5.12%
40 ($2,855)
12.42%
Kentucky
2.83%
21 ($1,579)
0.52%
31 ($292)
4.87%
51 ($2,716)
3.83%
19 ($2,135)
12.06%
Louisiana
1.68%
3 ($934)
0.04%
25 ($24)
2.17%
18 ($1,212)
6.50%
49 ($3,624)
10.39%
Maine
4.38%
35 ($2,444)
1.03%
45 ($576)
2.54%
26 ($1,416)
3.80%
17 ($2,117)
11.75%
Maryland
3.64%
31 ($2,030)
0.00%
1 ($0)
4.30%
49 ($2,395)
4.02%
23 ($2,241)
11.96%
Massachusetts
4.01%
34 ($2,238)
0.97%
44 ($540)
3.67%
44 ($2,046)
2.95%
6 ($1,646)
11.61%
Michigan
5.66%
43 ($3,158)
0.25%
26 ($142)
3.32%
37 ($1,850)
3.58%
11 ($1,995)
12.81%
Minnesota
3.86%
32 ($2,155)
0.56%
35 ($311)
2.94%
32 ($1,640)
4.21%
25 ($2,347)
11.57%
Mississippi
2.64%
19 ($1,470)
1.46%
49 ($813)
2.34%
21 ($1,303)
5.78%
47 ($3,224)
12.21%
Missouri
3.30%
26 ($1,842)
1.08%
46 ($600)
2.91%
31 ($1,625)
3.99%
22 ($2,224)
11.28%
Montana
2.82%
20 ($1,570)
0.55%
34 ($307)
2.76%
29 ($1,541)
1.16%
2 ($646)
7.29%
Nebraska
6.05%
45 ($3,371)
0.69%
36 ($383)
2.53%
24 ($1,410)
4.57%
32 ($2,548)
13.83%
Nevada
2.56%
15 ($1,425)
0.76%
39 ($423)
0.53%
8 ($295)
3.59%
12 ($2,002)
7.44%
New Hampshire
7.24%
49 ($4,038)
0.77%
41 ($432)
0.60%
9 ($335)
1.65%
5 ($920)
10.27%
New Jersey
7.96%
51 ($4,437)
0.00%
1 ($0)
1.40%
11 ($781)
3.51%
9 ($1,957)
12.87%
New Mexico
2.53%
14 ($1,408)
0.00%
1 ($0)
2.16%
17 ($1,204)
6.13%
48 ($3,419)
10.82%
New York
5.48%
42 ($3,057)
0.00%
1 ($0)
3.49%
40 ($1,945)
4.75%
37 ($2,647)
13.72%
North Carolina
2.84%
22 ($1,581)
0.54%
32 ($299)
3.62%
43 ($2,018)
3.65%
15 ($2,035)
10.64%
North Dakota
3.49%
28 ($1,947)
0.00%
1 ($0)
0.78%
10 ($432)
5.58%
45 ($3,108)
9.84%
Ohio
5.18%
40 ($2,890)
0.00%
1 ($0)
3.34%
38 ($1,862)
4.57%
33 ($2,548)
13.09%
Oklahoma
2.94%
24 ($1,638)
0.00%
1 ($0)
2.44%
23 ($1,360)
5.37%
42 ($2,994)
10.75%
Oregon
3.53%
30 ($1,970)
0.00%
1 ($0)
4.74%
50 ($2,640)
0.93%
1 ($519)
9.20%
Pennsylvania
5.14%
39 ($2,867)
0.00%
1 ($0)
3.90%
48 ($2,174)
3.40%
8 ($1,898)
12.45%
Rhode Island
5.46%
41 ($3,047)
2.05%
51 ($1,144)
2.30%
20 ($1,282)
3.88%
21 ($2,162)
13.69%
South Carolina
1.89%
6 ($1,056)
1.17%
48 ($651)
2.35%
22 ($1,310)
3.61%
14 ($2,013)
9.02%
South Dakota
4.39%
36 ($2,446)
0.00%
1 ($0)
0.00%
1 ($0)
5.37%
41 ($2,992)
9.75%
Tennessee
2.47%
12 ($1,376)
0.00%
1 ($0)
0.10%
6 ($56)
5.41%
43 ($3,017)
7.98%
Texas
6.16%
46 ($3,435)
0.00%
1 ($0)
0.00%
1 ($0)
4.88%
38 ($2,720)
11.04%
Utah
2.22%
11 ($1,240)
0.00%
1 ($0)
3.35%
39 ($1,869)
3.65%
15 ($2,035)
9.23%
Vermont
5.89%
44 ($3,285)
0.00%
1 ($0)
1.61%
14 ($896)
3.55%
10 ($1,977)
11.04%
Virginia
2.63%
18 ($1,467)
1.74%
50 ($971)
3.49%
41 ($1,947)
3.00%
7 ($1,675)
10.87%
Washington
3.52%
29 ($1,962)
0.00%
1 ($0)
0.00%
1 ($0)
8.16%
51 ($4,552)
11.68%
West Virginia
1.94%
8 ($1,082)
0.71%
37 ($398)
3.29%
36 ($1,833)
4.44%
29 ($2,478)
10.39%
Wisconsin
6.46%
47 ($3,602)
0.00%
1 ($0)
3.56%
42 ($1,985)
3.60%
13 ($2,006)
13.62%
Wyoming
2.03%
9 ($1,130)
0.77%
41 ($432)
0.00%
1 ($0)
4.65%
34 ($2,593)
7.45%
*Assumes “Median U.S. Household” has an income equal to $55,754 (mean third quintile U.S. income); owns a home valued at $184,700 (median U.S. home value); owns a car valued at $24,000 (the highest-selling car of 2017); and spends annually an amount equal to the spending of a household earning the median U.S. income.
Ask the Experts: Best Tax Advice
For more insight into the impact state and local taxes have on migration and public policy, we turned to a panel of leading tax and policy experts. You can check out their bios and responses below.
Do people usually consider taxes when deciding where to live? Should they?
How can state and local tax policy be used to attract new residents and stimulate growth?
Which states have particularly complicated tax rules for families?
How has the total amount families pay in state and local taxes changed as a result of the new tax code?
Which states have the best mix of taxes and government services?
Should people pay taxes based on where they live or where they work?
Federal Reserve officials, meeting for the first time under Chairman Jerome Powell, raised the benchmark lending rate a quarter-point and forecast a steeper path of hikes in 2019 and 2020, citing an improving economic outlook. Policy makers continued to project a total of three increases this year.
“The economic outlook has strengthened in recent months,” the policy-setting Federal Open Market Committee said in a statement Wednesday in Washington. Officials repeated previous language that they anticipate “further gradual adjustments in the stance of monetary policy.”
The upward revision in their rate path suggests Fed officials are looking through soft first-quarter economic reports and expect a lift this year and next from tax cuts passed by Republicans in December. Financial conditions have tightened since late January as investors look for signs that the central bank might raise rates at a faster pace, while forecasters predict stronger U.S. growth and tight labor markets.
The vote to lift the federal funds rate target range to 1.5 percent to 1.75 percent was a unanimous 8-0.
The latest set of quarterly forecasts forecasts showed that policy makers were divided over the outlook for the benchmark interest rate in 2018. Seven officials projected at least four quarter-point hikes would be appropriate this year, while eight expected three or fewer increases to be warranted.
In the forecasts, U.S. central bankers projected a median federal funds rate of 2.9 percent by the end of 2019, implying three rate increases next year, compared with two 2019 moves seen in the last round of forecasts in December. They saw rates at 3.4 percent in 2020, up from 3.1 percent in December, according to the median estimate.
Inflation Pickup
In another change to the statement, the Fed said inflation on an annual basis is “expected to move up in coming months,” after saying “move up this year” in the January statement. Price gains are still expected to stabilize around the Fed’s 2 percent target over the medium term, the FOMC said.
The central bank’s preferred price gauge rose 1.7 percent in the 12 months through January and officials projected it to rise to 2 percent in 2019 and hit 2.1 percent the following year, the latest estimates showed. The estimates for inflation excluding food and energy, which officials see as a better way to gauge underlying price trends, rose to 2.1 percent in 2019 and 2020 from 2 percent seen in December.
“Job gains have been strong in recent months, and the unemployment rate has stayed low,” the FOMC said. The statement said that household spending and business investment “have moderated” from strong fourth-quarter readings.
The statement also repeated previous language that “near-term risks to the economic outlook appear roughly balanced.”
Powell will hold his first post-FOMC press conference at 2:30 p.m. local time.
Supply, Demand
The Fed’s goal is to keep supply and demand in balance in the economy amid a tight labor market, without lifting borrowing costs so quickly that the economy stalls.
Officials have had to factor in the impact of fiscal stimulus signed by President Donald Trump since their previous projections.
The median estimate for economic growth this year rose to 2.7 percent from 2.5 percent in December, signaling confidence in U.S. consumers despite recent weak readings on retail sales that have pushed down tracking estimates of first-quarter activity. The 2019 estimate rose to 2.4 percent from 2.1 percent.
The committee’s forecast for the long-run sustainable growth rate of the economy was unchanged at 1.8 percent, suggesting policy makers are still skeptical of the effect of tax cuts on the economy’s capacity for growth. The 2020 gross domestic product growth median projection was also unchanged at 2 percent.
While U.S. unemployment of 4.1 percent is the lowest since 2000, wage growth has remained moderate and inflation has been below the Fed’s target for most of the last five years.
The median projection for the long-run fed funds rate ticked up to 2.9 percent from 2.8 percent in December. The Fed had been gradually reducing its estimate of the long-run neutral fed funds rate since it began publishing its calculations in January 2012.
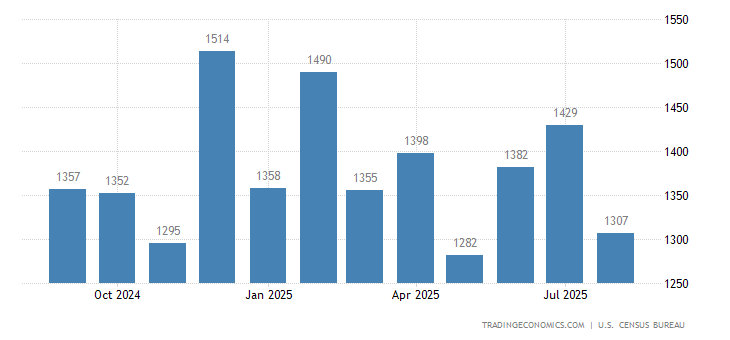
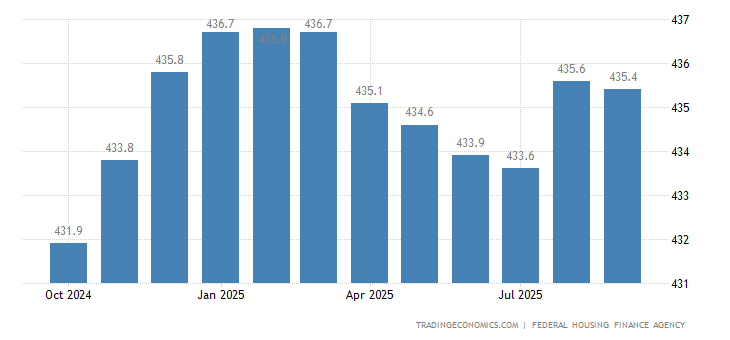
The average prices of single-family houses with mortgages guaranteed by Fannie Mae and Freddie Mac in the United States increased 0.3 percent month-over-month in December 2017, following an upwardly revised 0.5 percent gain in November and missing market expectations of 0.4 percent. Year-on-year, house prices went up 6.5 percent, the same pace as in the previous month. Housing Index in the United States averaged 0.29 percent from 1991 until 2017, reaching an all time high of 1.20 percent in January of 2000 and a record low of -1.80 percent in November of 2008.
NAHB analysis of Census Construction Spending data shows that total private residential construction spending grew 0.4% in October to a seasonally adjusted annual rate of $517.7 billion. It was a modest gain after a 0.2% dip in September. The total private residential construction spending was 7.4% higher than a year ago.
The monthly gains are largely attributed to the steady growth of spending on single-family and home improvements. Single-family construction spending edged up 0.3%, and remodeling spending rebounded by 1.4% in October. However, multifamily construction spending slipped 1.6% after the September dip, and was 2% lower since a year ago.
The NAHB construction spending index, which is shown in the graph below (the base is January 2000), illustrates the strong growth in new multifamily construction since 2010 and a steady growth in single-family construction and home improvement spending.
Private nonresidential construction spending increased 2.1% to a seasonally adjusted annual rate of $432 billion. However, it was 1.3% lower than a year ago. The largest contribution to this month-over-month nonresidential spending increase was made by the class of office ($2.5 billion), followed by transportation ($1.1 billion), and lodging ($0.6 billion).
Almost exactly half of residential water use consists of water used outside the home (e.g., for watering lawns), according to a recent NAHB study. Indoors, the biggest users of water are toilets, followed by showers, faucets, clothes washers and leaks.
These results of the NAHB are based on data that became available in 2016 in the form of Residential End Uses of Water (REUW), a detailed study and data set of single-family homes produced by the Water Research Foundation.
In total, the single-family homes in the REUW study used an average of 276 gallons of water per day (gpd). Almost exactly half of this was attributable to water used outside the home. It is well known that lawns and gardens need more watering in climates that are hot and get little natural rainfall, so this helps explain the climate-related pattern to state water use per housing unit shown in last week’s post. Indoors, toilets account for the greatest share of water use, but the shares for showers, faucets, clothes washers and leaks are also substantial.
The numbers in the chart above include both hot and cold water. The water heater in and of itself is not counted as an end use; the end use is where the water goes after leaving the heater. If storing water in a tank to heat it increases indoor water use, this would not be characterized as an identifiable end use and would show up in the “other” category. The 2016 REUW studies hot water use specifically in a sample of 94 homes and found that hot water accounted for one-third of total indoor water use.
Although it is not feasible to parse specific indoor uses by age of structure in the REUW data, it is possible to do this for total water used per single-family home. Results show less water used by homes built before 1960, but relatively small differences among homes built after that. For example, there is less than a 3 percent difference between the 244 gpd used by homes built in the 1960s and the 251 gpd used by homes built after 1999.
One possible explanation for lower water use in homes built before 1960 is the incidence of swimming pools. Not surprisingly, statistical models in the REUW study indicate that swimming pools have a particularly strong impact on household water use. Although 12 to 15 percent of homes built after 1959 in the REUW data have swimming pools, swimming pools are present on only 8 percent of homes built in the 1950s and only 3 percent of homes built before 1950.
This result, along with many others, is discussed more thoroughly in the full NAHB study.
Housing starts in the United States fell sharply by 4.7 percent from the previous month to a seasonally adjusted annualized rate of 1,127 thousand in September 2017 from an upwardly revised 1,183 thousand in August, compared with market expectations of a 0.5 percent decline to 1,180 thousand. It was the lowest level since September 2016, as Hurricanes Harvey and Irma disrupted the construction of single-family homes in the South. Housing Starts in the United States averaged 1435.60 Thousand from 1959 until 2017, reaching an all time high of 2494 Thousand in January of 1972 and a record low of 478 Thousand in April of 2009.
US Housing Starts Fall for 2nd Month
Housing starts in the United States fell 0.8 percent from the previous month to a seasonally adjusted annualized rate of 1180 thousand in August of 2017, following an upwardly revised 1190 thousand in the previous month and compared to market expectations of a 1.7 percent rise. Starts declined in the Northeast and the South.
The volatile multi-family segment slumped 5.8 percent to 323 thousand. In contrast, single-family starts, the largest segment of the market increased 1.6 percent to 851 thousand. Starts went down in the Northeast (-8.7 percent to 105 thousand) and the South (-7.9 percent to 563 thousand) but rose in the Midwest (22 percent to 200 thousand) and the West (4 percent to 312 thousand).
Building permits increased sharply by 5.7 percent to a seasonally adjusted annualized rate of 1300 thousand, way above market expectations of 1220 thousand. Authorizations of units in buildings with five units or more jumped 22.8 percent to 464 thousand while single-family permits dropped 1.5 percent to 800 thousand. Permits rose in the Midwest (8.8 percent to 185 thousand), the West (15.3 percent to 362 thousand) and the South (3.7 percent to 646 thousand) but fell in the Northeast (-13 percent to 107 thousand).
Year-on-year, starts rose 1.4 percent and permits went up 8.3 percent.
Data released for August suggested a limit impact from storms as Hurricane Harvey impacted construction activity in Texas only for the last week of the month and Hurricane Irma did not have an impact until September. Moreover, the response rate from areas affected by both hurricanes was not significantly lower than normal. Together, Texas and Florida accounted for about 13 percent of 2016 US authorizations and 26 percent of authorizations in the South region.
Home emergencies are best planned out before the case of an emergency. Never use water to put out a grease fire – it splashes the grease around and often makes things worse. Instead, look around for a handy metal lid from a nearby pot (a wok lid, for example, is ideal). Cover the fire with the lid until it suffocates and dies down. Then carefully remove the hot lid to observe the damage. If a lid is not around, carefully douse the fire with baking soda. Sorry, but your food is probably finished. Plus: How to Prevent Home Fires
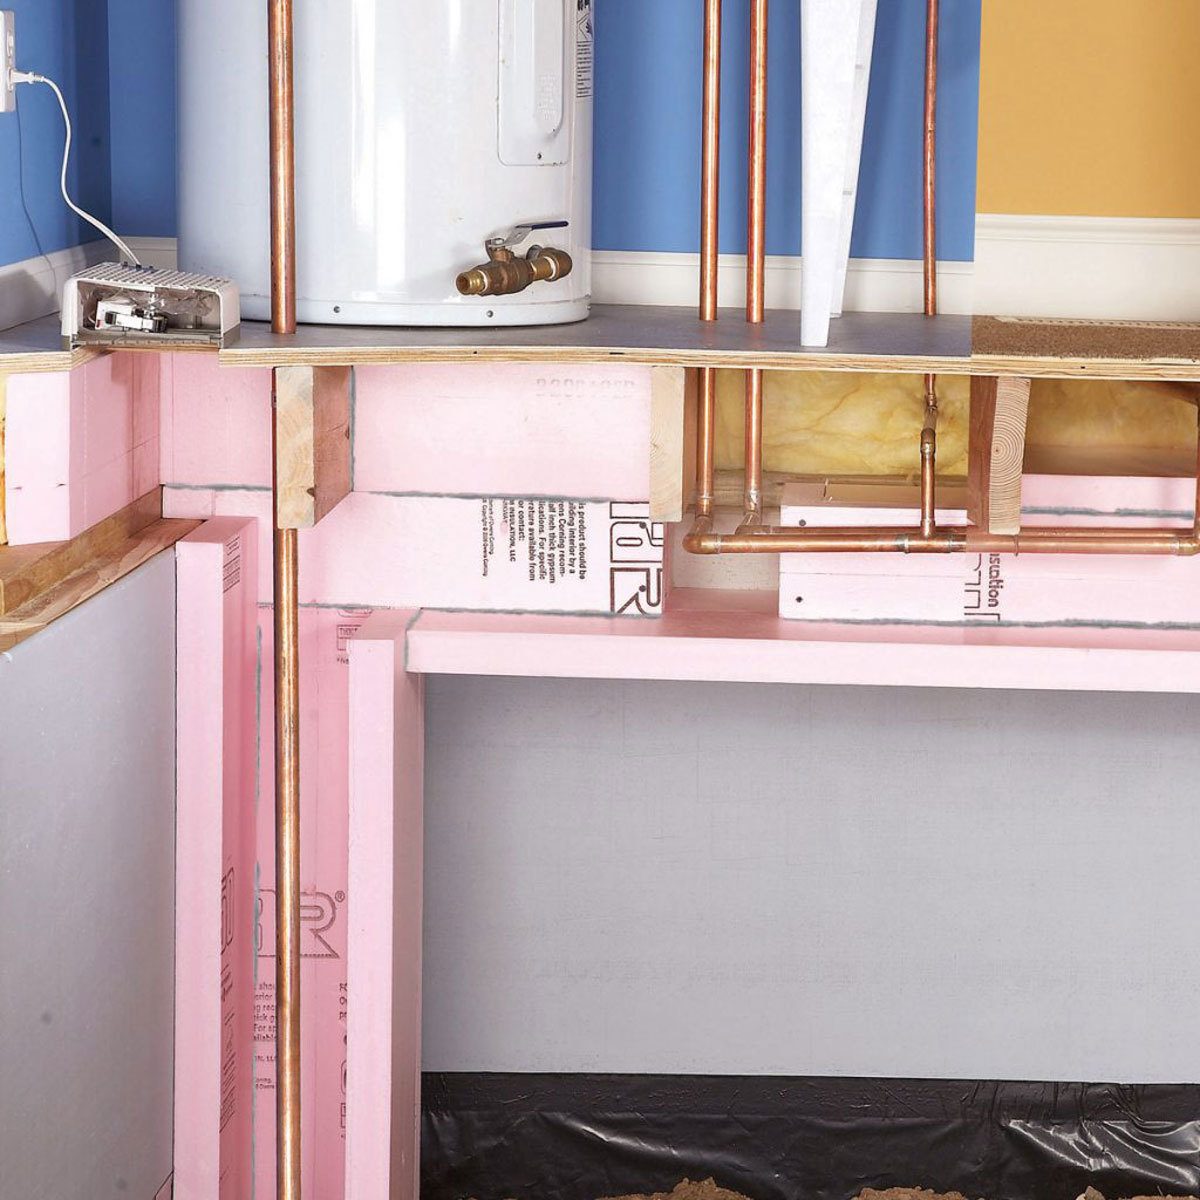
Burst and Broken Pipes
Your home has a main water valve – often in the basement or near the front of the house – that controls the flow of water: If you have a bad leak, you need to turn this valve off immediately to prevent expensive water damage (this is also a good preventative step if you are leaving the house during winter). Then inspect the pipes to find out what is damaged and needs to be replaced. If freezing water caused your pipes to burst, you should also consider pipe insulation.
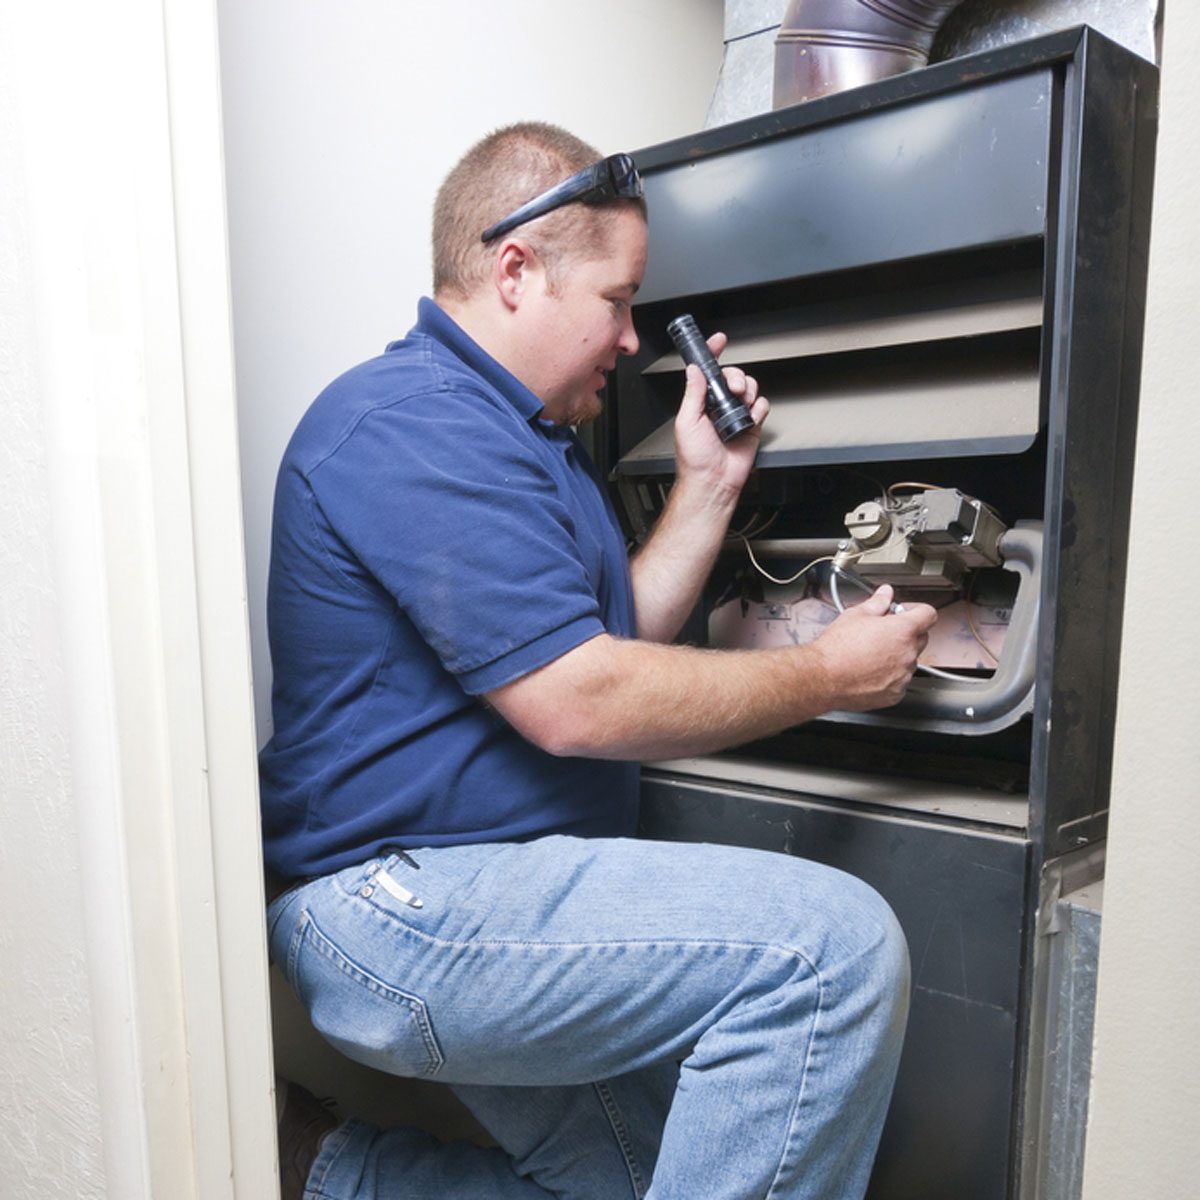
Furnace Failure
Remember to shut down electrical power to your furnace before taking a look inside. If you have a gas furnace, check to see if the pilot light has gone out and needs to be re-ignited. If the pilot light isn’t the problem, look for signs of damaged wiring or burnt out switches and sensors to narrow down the problem. Make sure the fan and motor are also working. If any of these components have failed, call a professional about a repair date. Photo: Neil Lockhart/Shutterstock
Overflowing Toilet
Toilets typically overflow when they can’t stop running and cannot drain properly. First, stop the flow by turning off the valve in the back of the toilet near the wall, which shuts down water. Quickly mop up standing water before it causes any damage, then look for the source of the problems. First look for issues with the fill tube and float that may keep the toilet running, then look for clogs and other issues that are keeping the toilet from draining.
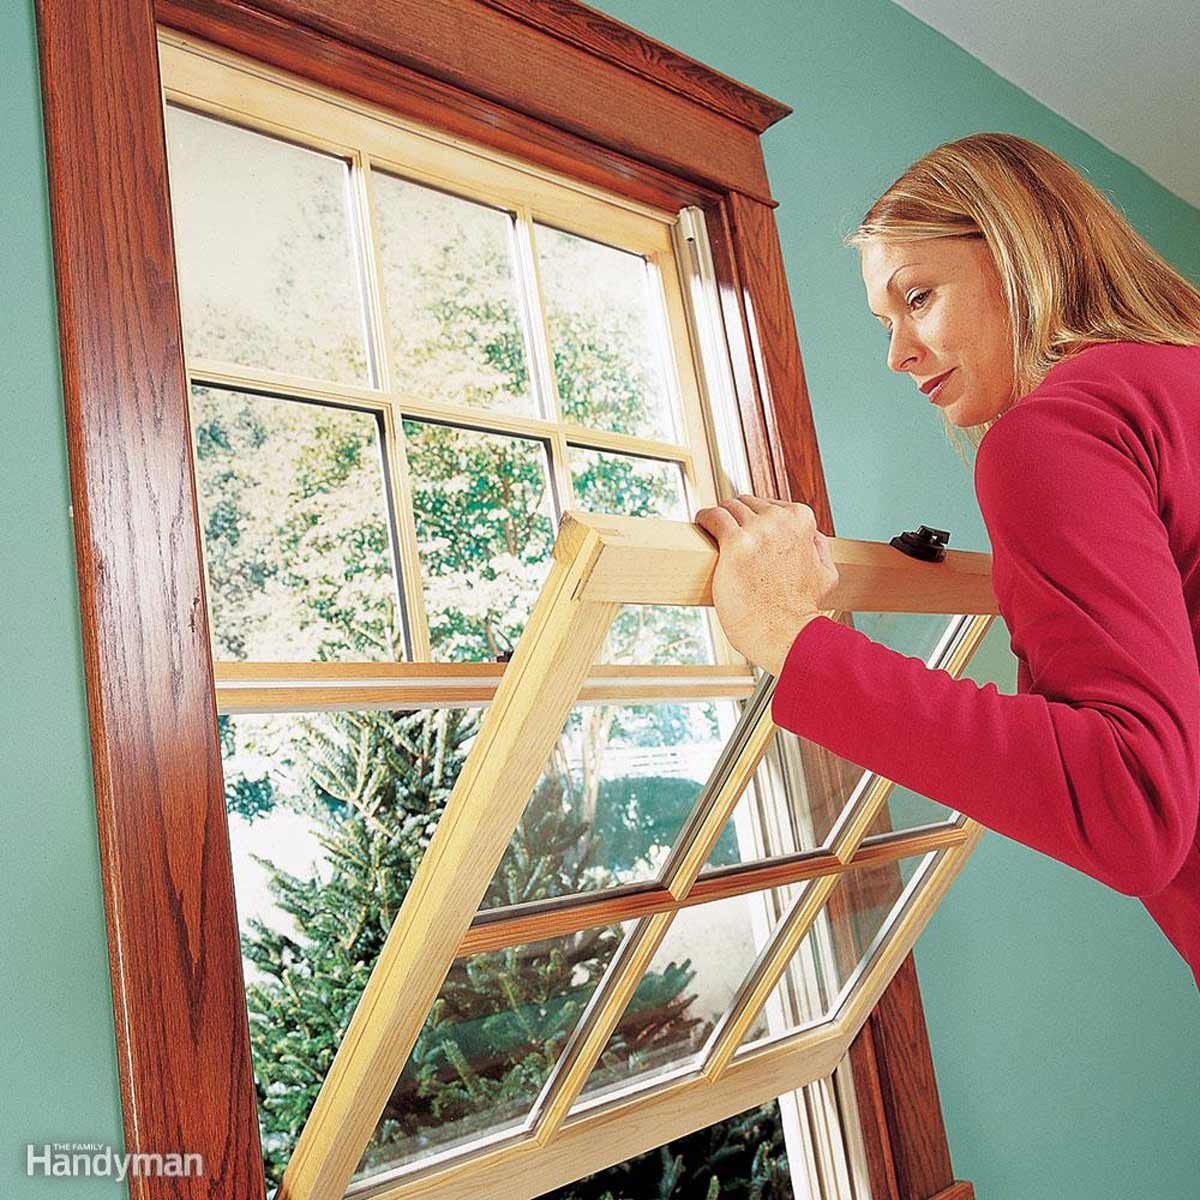
Broken Windows
Pull on thick gloves and carefully inspect the damage. Pick up any glass shards and remove any jagged, dangerous edges while noting the extent of the damage. You can seal the window by taking a trash bag and cutting it with scissors to fit the window opening. Tape several layers of this bag plastic to the window’s frame with duct tape. Window repair professionals typically offer same-day repairs if you don’t have enough time for a DIY project.
Power Outage
Pull out your phone for a guiding light and make sure everyone is OK. Then check nearby homes and streetlights: If they still have power, you should check your circuit breakers to see if there was an overload or other problem that caused the shutdown. If everyone has lost power, call up your power company (or visit online) to document the power loss and get information about repair times. If the outage is going to last at least several hours, start making plans to put refrigerator or freezer perishables on ice or toss them out.
Confirmed Mice in the House
Grab a flashlight and carefully inspect the perimeter both outside and inside your home. Look for three things: Droppings (a sign that mice are sticking around), signs of chewing/nests and any tiny crevices that mice may be using. Cover crevices with sealant or wire mesh to prevent further rodent problems and set a series of traps to get rid of mice in the house. If mice continue to appear, call up a professional inspector before they start causing structural damage.
Ant Infestation
If you notice trails of ants, remove the ants and thoroughly clean everywhere they’ve been with a vinegar spray to remove their trail scents. Then start looking for cracks and gaps in windows, doors, floorboards and other areas the ants may be emerging from. If you can’t narrow it down, set up ant traps and call a professional to see if you have a nearby nest. Remember, large black carpenter ants are a more serious threat to your home than other species and should be removed quickly.
Smoking Oven
Some light smoking is expected with brand new ovens or ovens with spilled oils or food. Clean the oven compartment thoroughly, making sure any oil or chemical residue is removed. For worse smoking problems, switch the oven off and open up windows around the house to encourage air flow (this is also a good time to see how sensitive your smoke detector is). If your oven is overcooking food, make sure the timer controls are working. Plus: Stove Repair
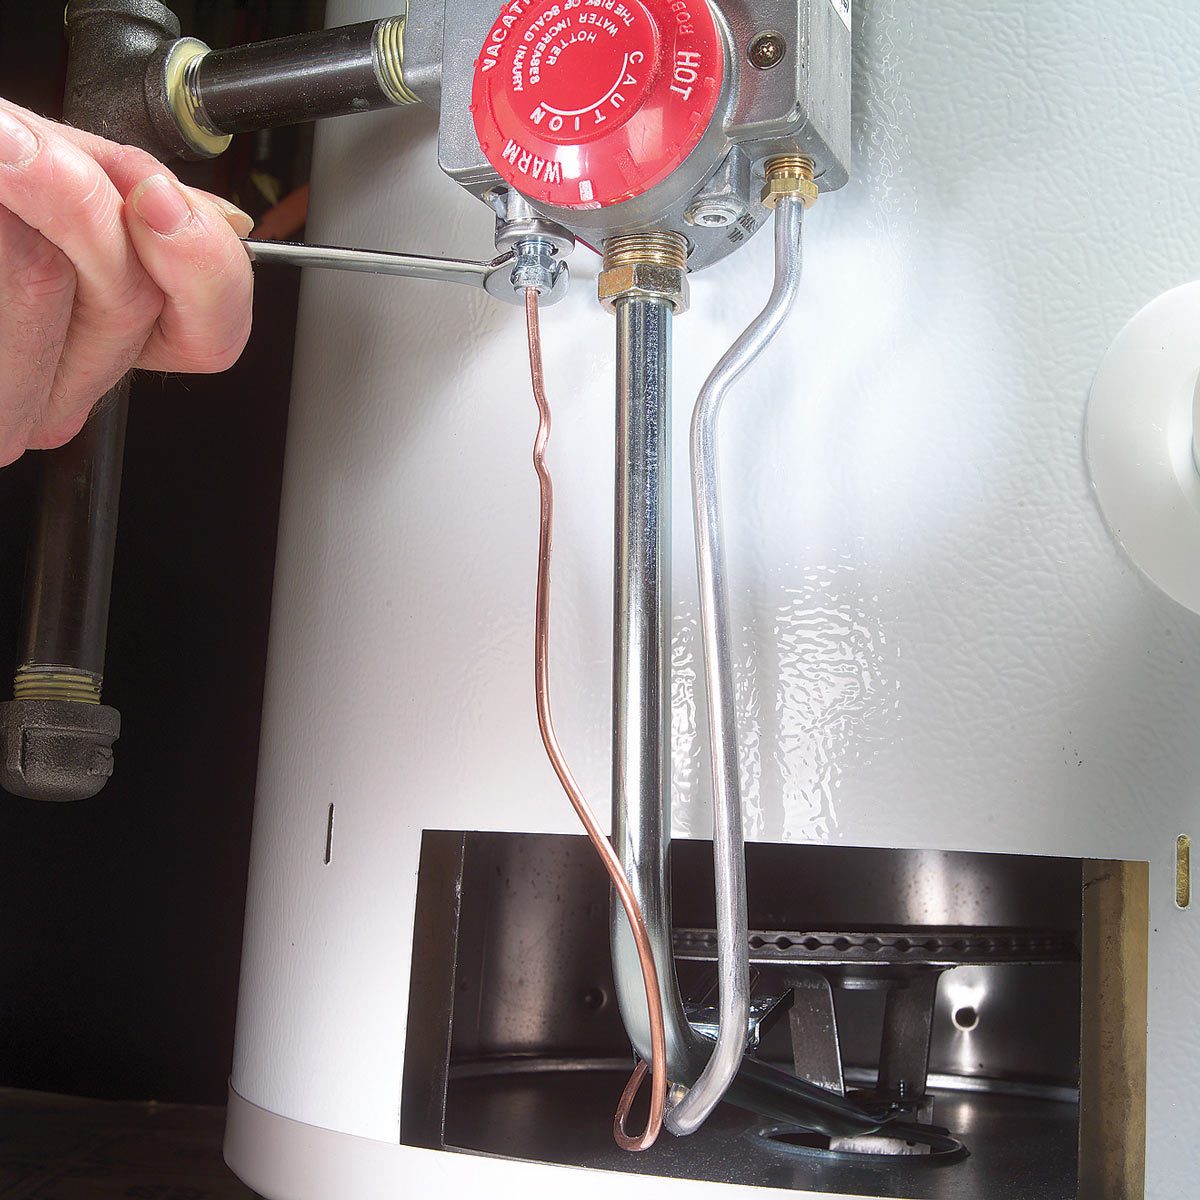
Leaking Water Heater
Check your temperature and pressure valve, a small faucet toward the top of the hot water heater. If the tank develops pressure issues, water will be evacuated from this valve: It’s not a leak, but it is a sign that you need to check wiring and settings. Real leaks from a broken valve or cracked tank are more serious: Shut down your water supply and consider your options. Repairs typically require fully draining the tank, which at least gives you an excuse to clean out any sediment at the same time.
Ceiling Leak
If the ceiling is dripping, prevent water damage by gathering buckets or plastic sheets under the leak. Then climb to your crawlspace or attic and track down the source of the leak: This could be anything from a broken pipe to a damaged roof underlayment and the leak may be far from the source of the problem, so this requires some patience. If you cannot narrow down the source, call in an experienced professional. Meanwhile, get ready to patch and repair your ceiling. Bottom line is these types of home emergencies are best to be dealt with right away. Plus: 12 Roof Repair Tips


 The numbers in the chart above include both hot and cold water. The water heater in and of itself is not counted as an end use; the end use is where the water goes after leaving the heater. If storing water in a tank to heat it increases indoor water use, this would not be characterized as an identifiable end use and would show up in the “other” category. The 2016 REUW studies hot water use specifically in a sample of 94 homes and found that hot water accounted for one-third of total indoor water use.