Daily Archives: May 6, 2013

West Nile Virus Prevention Begins For Bedford Residents

WESTCHESTER COUNTY, N.Y. – Residents in Chappaqua, Bedford, Mount Kisco and Armonk should eliminate standing water from around their properties, especially after it rains to help prevent mosquitoes from breeding, in an effort to eliminate breeding sites for mosquitoes that can carry West Nile Virus, Westchester County Department of Health said.

The county will start its West Nile Virus prevention efforts on Monday, May 13, by checking catch basins throughout the county for standing water and applying larvicide as needed.

Large areas of standing water on public property that cannot easily be removed should be reported to the Health Department by calling (914) 813-5000.

Health department larviciding teams will begin in the northern part of the county and work their way south, evaluating and treating as needed all catch basins on county and municipal roads throughout the county over the next few months.

“Through the combined efforts of residents and county government, we can successfully curb the mosquito population and keep cases of West Nile Virus to a minimum,” said Sherlita Amler, MD, commissioner of health.


http://bedford.dailyvoice.com/news

21 Awesome Social Media Facts, Figures and Statistics for 2013 | Katonah Realtor

Social media networks were a novelty 5 years ago and today they are no longer debated around the dinner party table.21 Awesome Social Media Facts Figures and Statistics for 2013

The conversation has moved on.

Facebook is now part of most people’s web lives, Twitter is where a lot of people are reading the breaking news and if you want to be entertained then just dial into YouTube.

Despite it’s minimal mindshare, media profile and awareness Google+ has woven its way into our consciousness and is now the second largest social network.

As if these social networks aren’t enough to distract us. We also now have Pinterest and Instagram to add to the online temptations.

The social web is the modern version of Alice in Wonderland, where we are following not one but many rabbits down innumerable rabbit holes.

What are 2 key factors driving the social web in 2013?

According to a Global Web Index study it is:

  • Mobile – with the number of people accessing the internet via a mobile phone increasing by 60.3% to 818.4 million in the last 2 years.
  • Older users adoption – On Twitter the 55-64 year age bracket is the fastest growing demographic with 79% growth rate since 2012. The fastest growing demographic on Facebook’s and Google+’s networks are the 45 to 54 year age bracket at 46% and 56% respectively.

These 2 key factors are keeping the social web bubbling along. So maybe the reason your grandparents aren’t turning up to that dinner party is that they have now discovered Facebook and Twitter!

So let’s look at some of the facts, figures and statistics for the major social networks.

Facebook

Facebook continues to grow and work out how to make money from its ads and mobile users.

Here are the latest facts and figures from its earnings call for the first quarter of 2013

  • Daily active users have reached 665 million
  • Monthly active users have passed 1.1 billion for the first time
  • 751 million mobile users access Facebook every month
  • Mobile only active users total 189 million
  • Mobile now generates 30% of its ad revenue up from 23% at the end of 2012

Twitter

Twitter is the fastest growing social network in the world by active users according to a Global Web Index Study.

So how does that translate to hard numbers?

  • 44% growth from  June 2012 to March 2013
  • 288 million monthly active users
  • That means that 21% of the world’s internet population are using Twitter every month
  • Over 500 million registered accounts
  • Twitter’s fastest growing age demographic is 55 to 64 year olds, registering an increase in active users of 79%

YouTube

When you wanted to watch a video it used to be VCR, then it became a  DVD player, then we moved onto cable networks and now it is YouTube.

These numbers from YouTube’s own blog put some perspective on it penetration into our culture and time.

  • 1 billion unique monthly visitors
  • 6 billion hours of videos are watched every month
  • This means that 50% more hours of video are watched in March 2013 compared to last August when it was 4 billion hours a month and last May when it was 3 billion.
  • YouTube reaches more U.S. adults ages 18-34 than any cable network

Google+

Google+ is making an impact on the social media universe and is now the second largest social network.

What are some of the numbers on Google’s social network built to protect it from Facebook’s growth and data capture to ensure it remains relevant?

It is Google’s social layer that enhances it’s other online assets.

  • 359 million monthly active users according to a Global Web Index study
  • Its active users base grew by 33% from June 2012 through to March 2013

Read more at http://www.jeffbullas.com/2013/05/06/21-awesome-social-media-facts-figures-and-statistics-for-2013/#CGOd5JjuSK3Tv0BD.99

8 Ways to Create the Perfect Facebook Post | Armonk Realtor

We recently updated our Superlist of Social Media and Content Marketing Case Studies and one of the enhancements that people really like is the Facebook Page section.  This section provides examples of the myriad ways smart  companies are using their Facebook pages successfully to engage customers and grow their businesses.

I recently discovered a terrific Blueprint for the Perfect Facebook Page Infographic from Salesforce that provides great tips for creating the perfect Facebook post.   In sum, the recommendations are:

  1. Keep your post copy short and your tone personal.
  2. Target your audience by location or language.
  3. Use a call-to-action hyperlink to a page on your website.
  4. Achieve more impact by including an attractive, relevant photo with your post.
  5. Reach more fans with a sponsored story within 24 hours of your posting.
  6. Don’t be a passive poster. Engage by asking questions and adding comments.
  7. Post with mobile users in mind: short simple copy , images and video.
  8. Evaluate what’s working and what’s not by reviewing the “Engaged Fans” metric on your Insights Page.If you want to see examples of how companies are using Facebook

Go grab this terrific infographic right now and keep it handy.

Read more: http://www.interactiveinsightsgroup.com/blog1/ways-to-create-the-perfect-facebook-post/#ixzz2SVy0IF25

A Step-by-Step Guide to Building an Excel Graph [Quick Tip] | Chappaqua NY Realtor

Building graphs is part of most people’s jobs — they’re the best way to present information in a clear, easily digestible manner that can then serve to influence the decision-making process within an organization. But there are some people out there that get a little bit intimidated by the prospect of poking around in Excel. I, however, adore the thing (I work in Marketing Ops, so it’s pretty much a requirement).

So I thought I’d share some step-by-step instructions for anyone out there that cringes at the thought of sorting a spreadsheet full of data into a chart that actually, you know,means something. Here are the simple steps you need to build a graph in Excel.

Step 1: Get your data into Excel.

First, you need to input your data into Excel. This is the easy part! You may have exported the data from elsewhere, like a piece of marketing software or a survey tool. Or, you might be inputting it manually.

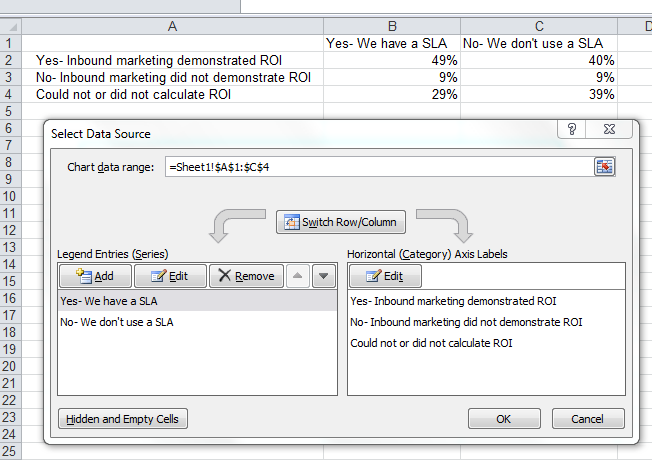
In the example below, in Column A, I have a list of the responses to the question “Did inbound marketing demonstrate ROI?”, and in Columns B,C, and D, I have the responses to the question “Does your company have a formal sales-marketing agreement?”. For example, Column C, Row 2 illustrates that 49% of people who have an SLA also say that inbound marketing demonstrated ROI.

excelgraphblogpostpicture1

Step 2: Choose a type of graph to create.

You have plenty of choices for charts and graphs to create. This data will look best in a bar graph, so let’s pursue making that one. To make a bar graph, highlight the data and include the titles of the X and Y axis. Go to the ‘Insert’ tab, click ‘Charts,’ click ‘Column,’ and choose the graph you wish (in this example I will be picking the first 2-D Column choice — just because I prefer it over the 3-D look).

finalgraphmay4blogstep2

Step 3: Switch axes, if necessary.

If you want to switch what appears on the X and Y axis, right click on the bar graph, click ‘Select Data,’ and click ‘Switch Row/Column.’
finalgraphmay4blogstep3

Step 4: Adjust your labels and legends, if desired.

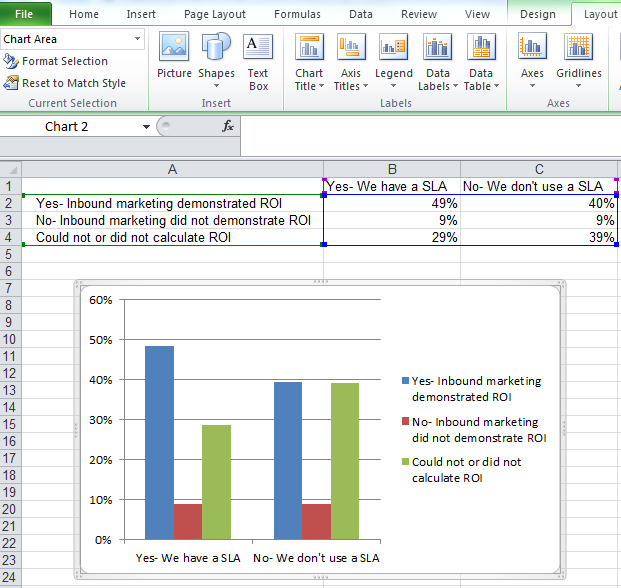
To change the layout of the labeling and legend, click on the bar graph, then click the ‘Layout’ tab. Here you can choose what layout you prefer for the chart title, axis titles, and legend.

In my example, I clicked on ‘Chart Title,’ and selected ‘Above Chart.’ To format the X axis title, I clicked on ‘Axis Titles’, clicked ‘Primary Horizontal Axis Title’, and clicked ‘Title Below Axis.’ To format the Y axis title, I clicked on ‘Axis Titles,’ clicked ‘Primary Vertical Axis Title,’ and chose ‘Rotated Title.’ To change the placement of the legend, click ‘Legend’ on the ‘Layout’ tab and choose your preferred location.
finalgraphmay4blogstep4

Step 5: Change the Y axis measurement options, if desired.

To change the type of measurement shown on the Y axis, right click on the Y axis percentages, and click ‘Format Axis.’ Here you can decide if you want to display units located on the Axis Options tab, or if you want to change whether the Y axis shows percentages to 2 decimal places or to 0 decimal places.

finalblogmay4step5p1

finalblogmay4step5p2

The resulting graph would be changed to look like this:

finalblogmay4step5p3

Step 6: Reorder data, if desired.

To sort the data so that the software choices appear in descending popularity order, click on the column that is most important to you (in this case I picked column B), click on the ‘Data’ tab, and click ‘Filter.’ Then go back to Column B and click the down arrow and click ‘Sort Largest to Smallest.’

finalblogmay4step7p1

If you click on the downward arrows located at B1 and C1, you can choose to sort based on smallest to largest or largest to smallest, depending on your preference. Here, I sorted largest to smallest on B1.

finalblogmay4step7p2-1

Pretty easy, right? What other Excel functions have you always wanted help with?


http://blog.hubspot.com/how-to-build-excel-graph

REALTOR® Confidence Rose Strongly in March 2013 | Bedford Corners NY Real Estate

Confidence about current market conditions and the outlook for the next six months rose strongly across all property types in March. For the first time, the “REALTORS® Confidence Index – Six Month Outlook” for townhouses breached the level of 50 which delineates “moderate” expectations. The data is based on information gathered in the March REALTORS® Confidence Index (RCI) Survey.

REALTORS® generally mentioned strong buyer demand, improving prices, and fewer days on the market amid tight inventory and restrictive credit conditions.

Examples of improving residential markets are delineated in detail in the RCI Report.

  • Ninety-four percent reported that they expect constant or higher prices in the next 12 months.
  • The median days on market for all sales was 62 days in March compared to 91 days a year ago.
  • Thirty-seven percent of respondents reported time on market at less than 1 month when sold.
  • Distressed sales were at 21 percent of market, down from 29 percent a year ago.

What Does This Mean for REALTORS®?
Some people are still a little shell shocked from the Great Recession, and some articles in the Press continue to question whether there is a recovery. The people who are experts in the housing markets—the REALTORS®–are reporting very favorable news. These experts see a recovery.


http://economistsoutlook.blogs.realtor.org/2013/04/24

Demand for Properties Continued to Expand Faster than Supply in March 2013 | Cross River Real Estate

Strong buyer demand for residential homes continued to outpace supply in March. The Buyer Traffic Index rose to 69 while the Seller Traffic Index inched up to 41. This based on information in the March REALTORS® Confidence Index (RCI) Survey.

In many areas of the country REALTORS® reported low inventory levels of homes for sale. Tight inventory conditions have been cited as leading to higher prices and reduced time on market.

What Does This Mean for REALTORS®?
If a potential buyer asks why sales are down in some areas, one can note that a major reason for sales declines recently has been the hot sales market—a lack of inventory relative to the number of people who want to buy.


http://economistsoutlook.blogs.realtor.org/2013/04/26

Cash Sales: 30 Percent of Residential Sales | Pound Ridge Real Estate

Approximately 30 percent of REALTORS® reporting on their last sale had a cash sale (32 percent in February). Investors and international buyers typically pay cash. About 9 percent of REALTORS® reporting a sale to a first-time homebuyer also reported cash sales, while over 70 percent of reported last sales to investors and international buyers were for cash. This is based on data from the March REALTORS® Confidence Index Survey.

What Does This Mean for REALTORS®?
The first time buyer faces a challenge—particularly given that investors are in many cases paying cash—as are second home buyers and international buyers. The key to success appears to be getting financing in place.


http://economistsoutlook.blogs.realtor.org/2013/04/30

Case-Shiller Price Index | Bedford NY Real Estate

In each Economic Update, the Research staff analyzes recently released economic indicators and addresses what these indicators mean for REALTORS® and their clients. Today’s update discusses the Case-Shiller price index.


  • Case-Shiller data show that U.S. house prices rose 9.3 percent and 8.6 percent for the 20- and 10-city indexes, respectively, for the 12 months ending in February 2013, according to their repeat-sales house price index. The NAR median price rose by more than the Case-Shiller data, showing an 11.3 percent gain for the same 12-month period.
  • NAR reports the median price of all existing homes that have sold in the given time period while Case-Shiller’s weighted repeat-sales index only compares price changes among homes for which there is a previous sale, examining the difference in price for property-pairs only. Also, because Case-Shiller data relies on public records, the data reported for February 2013 is actually a moving average of sales from December 2012, January 2013, and February 2013. Because home sales among higher priced properties have been growing more than among lower price tiers and because the Case-Shiller report factors in older data in this market of rapid price growth the NAR median is outpacing the Case-Shiller index.
  • While the NAR median price does not measure change in price for the same properties, it can be computed much more quickly than a weighted repeat sales index, thus information is available sooner, and as can be seen in the chart below comparing several price measures, the trends in the data tend to be similar, so the NAR median price is a valuable early indicator of other housing price data.
  • NAR’s median home price for the 12 months ending March 2013 showed a gain of 11.8 percent, suggesting that further increases, likely in the double-digit range, will be seen in the Case-Shiller data next month. By comparison, CoreLogic’s HPI showed double-digit gains as early as February.
  • By city, Phoenix, Las Vegas, and Atlanta have the best price growth records in the last year and while the Atlanta area saw no change in price from January to February, the other two cities also top the monthly growth list.


http://economistsoutlook.blogs.realtor.org/2013/04/30

Reverse mortgage delinquencies surge | Bedford Hills NY Real Estate

Monday Morning Cup of Coffee is a quick look at the news coming across the HousingWire weekend desk, with more coverage to come on bigger issues.

A test prototype of the single-securitization platform for the secondary mortgage market is expected as early as next year, regulators said while speaking at the Mortgage Bankers Association’s Secondary Market Conference on Sunday.

This goal set forth by the Federal Housing Finance Agencyand the government-sponsored enterprises is to incorporate mortgage participants’ feedback into the prototype development, which will hopefully result into a platform creation that suits the industry’s needs, explained Tim Yanoti, senior vice president of securitization at Fannie Mae.

HousingWire Reporter Christina Mylinski has more on the securitization platform and will be covering the MBA Secondary Conference online Monday and Tuesday. You can follow Christina on Twitter: https://twitter.com/@ChristinaMlynskfor conference updates.

Of the almost 600,000 reverse mortgages outstanding, 9.8% are currently delinquent. This is an 8% increase from 2011, according to the U.S. Department of Housing and Urban Development.

The Wall Street Journal writes that delinquencies have increased in recent years as up to 70% of borrowers have opted for lump-sum payouts.

As concerns about defaults rise, the Federal Housing Agency recently discontinued a popular variety of fixed-rate reverse mortgages that paid the highest lump sums available through the program.


http://www.housingwire.com/news/2013/05/05

Turn Passion into Brand Evangelism | Katonah NY Real Estate

Turn Passion Into Brand Evangelism

I pinched myself when I was recently invited by the Tampa Bay Lightning to be the Social Captain for a game. The opportunity for me to combine my love of hockey and my favorite NHL team with social media is up there with a day at the beach.

The Tampa Bay Lightning hockey club anoints a Social Captain for each game. The social captain is a fan that is asked to share their social media chops with their friends before and during a game. The fan is provided entry into the game, given a behind-the-scenes tour prior to the game, meeting some VIPs along the way and is provided prizes and give aways to promote during the game through Twitter, Instagram and Facebook. Fans in attendance follow along through hasthtags such as #TBLightning, #BoltsSocial and #LightningStrikes. I got to meet Dave Andreychuk, the captain of the Lightning in 2004, when they won the Stanley Cup (featured in the image above). That was a huge thrill for me!

Harness The Influence of Passionate Fans

The Social Captain is a fan. There is no monetary compensation to the fan. The compensation is an awesome fan experience along with some exposure to the fan base. I must admit that I prepped for the experience by studying the website and Twitter stream to be prepared for questions from other fans. It’s almost as if I considered myself an employee representing the brand, even if for just one game. I truly wanted to be capable of representing the brand well…Imagine how powerful it would be to have customers with this much passion for your brand eagerly desiring to evangelize your brand?

Social Captain In Other Industries

This experience inspired me to imagine how a social business might apply the Social Captain concept in other industries outside the sports industry. Consider applying this concept in these possible ways:

Social Captain in Manufacturing

Find a customer who has demonstrated loyalty and passion for your product. Offer to shoot a video of your customer using your product in his or her natural setting. Allow the customer to be totally authentic in telling their story. Don’t script it. Alternatively, provide one of your products as a gift or loaner and invite the customer to tell their story experience on their own through their social channels.

Social Captain in Retail

Select one or more employees who embody your brand. Empower the employee to capture their experience serving customers through photos, video, tweeting and live blogging. If possible, provide a writer who can create live blog content accompanied by video. Run this program on a weekly or monthly basis with consistently used hashtags and don’t be surprised to see employees competing for their chance to be your social captain brand ambassador.

Social Captain in Services

There are many possibilities for a Social Captain in a services businesses depending on whether your service business is B2C or B2B. If you’re a B2C service business, you can directly emulate the Tampa Bay Lightning’s Social Captain concept. For B2B service businesses, identify a loyal client with subject matter expertise and invite him or her to be a guest blogger or regular contributor of content on a relevant subject.  Additionally, consider the approaches described in the retail and manufacturing industry above.

Social Captain in Technology

Lots of potential here…Depending on the nature of your tech product, locate a power user whose savvy use of your product is impressive or innovative. Recruit these power users employing tactics described above.

Four Factors in a Successful Social Captain Program

  1. Must be authentic. Do not ask your Social Captain to be an advertisement. Allow him or her to be natural and creative. Don’t put them in a box.
  2. Make the Social Captain feel special. Give him or her the red carpet treatment. Harness their passion for your brand. Show your appreciation for it. Give them a platform to be noticed. They’ll love you for it.
  3. Promote the Social Captain concept to create buzz and inspiration to attract ambassadors among your loyal customers.
  4. Describe clearly the criteria for someone to be a Social Captain. You may notice some complaining because you didn’t select them. If you communicate the selection process clearly, your community will support you.


http://www.findandconvert.com/2013/04