The count of unfilled jobs in the overall construction sector remained elevated in November, as residential construction employment continues to grow.
According to the BLS Job Openings and Labor Turnover Survey (JOLTS) and NAHB analysis, the number of open construction sector jobs (on a seasonally adjusted basis) came in at 184,000 in November. The cycle high was 225,000 set in July.
The open position rate (job openings as a percent of total employment) for November was 2.7%. On a smoothed twelve-month moving average basis, the open position rate for the construction sector increased to 2.8%, setting a cycle high and exceeding the peak twelve-month moving average rate established prior to the recession.
The overall trend for open construction jobs has been increasing since the end of the Great Recession. This is consistent with survey data indicating that access to labor remains a top business challenge for builders.
The construction sector hiring rate, as measured on a twelve-month moving average basis, remained steady at 4.9% in November. The twelve-month moving average for layoffs was also steady (2.6%), remaining in a range set last Fall. Quits rose to 2.4% in November, consistent with a tight labor market.
Monthly employment data for December 2016 (the employment count data from the BLS establishment survey are published one month ahead of the JOLTS data) indicate that home builder and remodeler employment expanded, increasing by 9,800. The December gains continue the improvement in the Fall after a period of hiring weakness early in 2016. The 6-month moving average of jobs gains for residential construction has now increased to a healthier 11,450 per month.
Residential construction employment now stands at 2.653 million, broken down as 739,000 builders and 1.915 million residential specialty trade contractors.
Over the last 12 months home builders and remodelers have added 103,000 jobs on a net basis. Since the low point of industry employment following the Great Recession, residential construction has gained 667,000 positions.
In December, the unemployment rate for construction workers stood at 6.8% on a seasonally adjusted basis. The unemployment rate for the construction occupation had been on a general decline since reaching a peak rate of 22% in February 2010, although it has leveled off in the 6% to 7% range since the middle of 2016
For the first time since the housing crisis, the Federal Housing Finance Agency is increasing the maximum conforming loan limits for mortgages to be acquired by Fannie Mae and Freddie Mac in 2017.
For much of the country, the Fannie Mae and Freddie Mac loan limit remained at $417,000 for one-unit properties (or single-family homes) in 2016, just as it had for the previous 10 years.
The FHFA announced Wednesday that for 2017, it is increasing the loan limit from $417,000 to $424,100 for single-family homes.
The conforming loan limits for Fannie and Freddie are determined by the Housing and Economic Recovery Act of 2008, which established the baseline loan limit at $417,000 and mandated that, after a period of price declines, the baseline loan limit cannot rise again until home prices return to pre-decline levels.
The FHFA noted that until this year, the average U.S. home price remained below the level achieved in the third quarter of 2007, which it designates as the pre-decline price level, and therefore the baseline loan limit had not been increased.
But as the FHFA noted earlier Wednesday, its Home Price Index for the third quarter of 2016 makes it “clear” that average home prices are now above the level of the third quarter of 2007, which means that the conforming loan limits can be increased.
According to the FHFA, the expanded-data HPI value for the third quarter of 2016 was approximately 1.7% above the value for the third quarter of 2007, meaning the baseline loan limit will increase by that same percentage.
As noted above, the conforming loan limits for much of the country will increase from $417,000 to $424,100.
Loan limits will also be increasing in what the FHFA calls “high-cost areas,” where 115% of the local median home value exceeds the baseline loan limit.
As the FHFA notes, median home values generally rose in high-cost areas during this year.
According to the FHFA, the new ceiling loan limit, which applies in areas with the most expensive homes, will be $636,150 (which is 150% of $424,100) for one-unit properties in the contiguous U.S.
According to the FHFA, there are special statutory provisions that establish different loan limit calculations for Alaska, Hawaii, Guam and the U.S. Virgin Islands.
In these areas, the baseline loan limit will be $636,150 for one-unit properties, but actual loan limits may be higher in some specific locations.
For a full list of the conforming loan limits by county, click here.
The increase in conforming loan limits is a long time coming, according to William Brown, the president of the National Association of Realtors.
U.S. single-family home prices rose slightly less than expected on an annual basis in July, and the year-over-year gain was smaller than in the prior month, a survey showed on Tuesday.
The S&P CoreLogic Case-Shiller composite index of 20 metropolitan areas rose 5 percent in July on a year-over-year basis, retreating from the 5.1 percent climb in June and short of the estimate calling for a 5.1 percent increase from a Reuters poll of economists.
“Both the housing sector and the economy continue to expand with home prices continuing to rise at about a 5 percent annual rate,” said David M. Blitzer, managing director and chairman of the index committee at S&P Dow Jones Indices.
“There is no reason to fear that another massive collapse is around the corner.”
Prices in the 20 cities were flat in July from June on a seasonally adjusted basis, the survey showed, matching expectations.
On a non-seasonally adjusted basis, prices increased 0.6 percent from June.
Home prices in three U.S. cities, Denver, Seattle and Portland, Oregon, showed the highest year-over-year gains, the survey showed.
The lonely $250,000 S-Class coupe at Mercedes-Benz of Greenwich says it all. For six months, it’s been sitting in the showroom, shimmering in vain while models priced at only $70,000 fly out the door.
“We haven’t had anyone come in and look at it,” says Joey Licari, a sales consultant at the dealership, looking over his shoulder at the silver beauty. “I feel like normally they would, maybe a few years ago.”
Such is the state of affairs in Greenwich, the leafy Connecticut town famous for its cluster of hedge funds and the titans of Wall Street who occupy many a gated mansion. The rich are being maddeningly frugal, as Barry Sternlicht complained when he assailed his former hometown as possibly the country’s worst housing market. “You can’t give away a house in Greenwich,” the head of Starwood Capital Group said, causing something of a ruckus.
The reality is that places like Sternlicht’s, a nearly 6-acre estate priced at $5.95 million before he gave up, aren’t moving. No such problem if it’s $2 million or less. That Benz is going nowhere, but sales are up at Cadillac of Greenwich, where $50,000 is pretty much the basement. Ten-carat diamonds that can cost in the six figures collect dust in stores on the main drag. On the other hand, a husband will still drop $10,000 on jewelry for a 10th anniversary.
The new Greenwich is like that. “We aren’t getting caviar and champagne,” says Edward Tricomi, co-owner of Warren Tricomi Salon on Greenwich Avenue, “but we’re still eating steak.”
Bonus Slump
The town was hit hard by the 2008 financial crisis, and never fully recovered: The median sales price for homes in the second quarter was $1.56 million, 17 percent below the peak back in 2006, according to data compiled by appraiser Miller Samuel Inc. and brokerage Douglas Elliman Real Estate. Now, with the hedge-fund business struggling and investment-banker incentive pay in a slump, bonus-fueled purchases are cooling again. These days, in fact, not losing money can be cause for swagger.
“We talk to a lot of guys from hedge funds, and they’re like, ‘Look at our numbers, we haven’t gone down, we’re staying level,’” says Brad Walker, who moved from Boston two years ago to open a branch of his family’s shop, Shreve, Crump & Low. A newcomer, he finds it perplexing. “I don’t run a hedge fund, I work in a jewelry store, but I think you’d want to do a little bit better.”
$135,000 Median
Flat probably isn’t so bad, though, if you’re already in the neighborhood of the .001 percent. Anyway, many factors are at play in the scaling back. Tastes are changing. And with income inequality a talking point across America, and the finance industry the target of criticism and scrutiny in recent years, some might just want to keep low-spending profiles.
“The things being bought are less trophy items and, more likely, carefully bought quality,” says Terry Betteridge, who owns Betteridge, a jewelry store. “One doesn’t want to become the next episode of ‘Billions.’”
Just 35 miles from Manhattan in the heart of Connecticut’s famed Gold Coast, with about 60,000 residents and 32 miles of shoreline, Greenwich is among the most prosperous communities in America. One out of every $10 in hedge funds in the country is managed here, according to data compiled by Bloomberg, by firms such as Viking Global Investors and AQR Capital Management. It’s home to finance heavyweights including Steven Cohen of Point72 Asset Management and Dick Fuld. The median annual household income is $135,000 — compared with $56,516 nationally. Residents paid more state income taxes in 2014, the last year for which data are available, than in any other municipality in Connecticut.
Sore Point
The tax rate, by the way, is a sore point, and possible reason behind the departure of the likes of Paul Tudor Jones and Thomas Peterffy, who switched their permanent residences to Florida. The state income tax there is zero.
In 2015, Connecticut boosted the income tax for individuals making more than $500,000 and couples above $1 million to 6.99 percent from 6.7 percent. Levies on luxury goods rose to 7.75 percent from 7 percent on cars over $50,000, jewelry over $5,000 and clothing or footwear over $1,000.
Sternlicht said at a conference two weeks ago that this was why he relocated to the sunshine state. “We used to have no taxes,” he said wistfully, recalling Connecticut before it enacted its income tax in 1991.
Many continue to try to sell their real estate holdings. As of Sept. 14, there were 46 homes at $10 million or more on the market, some that have been lingering since 2014, according to data from Miller Samuel and Douglas Elliman.
3,000-Bottle Cellar
Among them: an 80-acre estate on Lower Cross Road for $49 million that until last month was asking $65 million, and a 19,773-square-foot manse once owned by Republican presidential candidate Donald Trump that has been looking for a buyer for nearly two years. It’s on the market now for $45 million, down from $54 million.
Former Trump property
Source: Coldwell Banker
No takers yet for a seven-bedroom affair with a 3,000-bottle chilled wine cellar, a tennis court that converts to a hockey rink and a globe-shaped observatory with a retractable roof and high-powered telescope. That one recently returned to the market at $8.495 million, after an earlier effort at $8.95 million. Former Citigroup Chief Executive Officer Sandy Weill is trying to offload his 16,460-square-foot home at $9.9 million, down from $14 million more than two years ago.
One problem is that risk levels have gone through the wringer. Members of the younger Wall Street crowd are quite conservative, says Robin Kencel, a broker with Douglas Elliman. “They used to say Oh, I’ll stretch.’ Now they’re more practical. They’ll ask ‘What are the utility bills? Oh, wait — I don’t want it.’”
That could explain why, this year through Sept. 22, pending sales of homes priced up to $999,999 jumped 29 percent from the same period in 2015, according to brokerage Houlihan Lawrence, and those between $1 million and $1.99 million were up 69 percent. Contracts for homes between $5 million and $5.99 million, meanwhile, fell 80 percent.
Results from the most recent Senior Loan Officer Opinion Survey (SLOOS) indicate that lending standards on multifamily residential mortgages continue to show signs of tightening and the pace of tightening is growing.
The Federal Reserve Board’s SLOOS asks senior loan officers at large banks their opinion on changes in the standards and terms on, and demand for, bank loans to businesses and households over the past three months. In the most recent release, covering the second quarter of 2016, 44.3% of bank respondents indicated that lending standards at their bank had tightened over the quarter.
The net share of banks reporting that standards on multifamily residential mortgages had tightened has widened over the past year. The net share represents the difference between the percentage of banks indicated that standards had tightened and the proportion responding that standards had eased. As shown in Figure 1 below, a net share of 2.9% of banks reported standards had eased in the second quarter of 2015, but in the third quarter, a net percentage of 7.4% of banks reported having tightened standards. The net portion of banks tightening standards on multifamily residential debt rose in the three successive quarters.
A previous post demonstrated that banks account for the majority of multifamily residential debt outstanding. According to an analysis of bank-level call report data provided by the Federal Financial Institutions Examination Council (FFIEC), the share of federally insured depository institutions with an outstanding amount of multifamily residential debt outstanding on their balance sheet, has risen while the amount of debt outstanding has remained stable. In contrast, the proportion of banks with any outstanding amount of 1-4 family first-lien mortgages on their balance sheet has remained steady and fluctuations have occurred in the outstanding amount of 1-4 family first-lien mortgage debt. However, in recent years, growth in the share of banks with outstanding multifamily residential mortgage debt outstanding rose more slowly than the growth in the outstanding amount of multifamily residential debt.
In 2001, approximately 65% of depository institutions had some outstanding multifamily residential debt residing on their balance sheet. As illustrated by the Figure 2 above, the proportion increased 13 percentage points to 78% by 2015. However, much of the growth took place between 2001 and 2012. Between 2012 and 2015, the percentage of banks with multifamily residential debt rose by 1.0 percentage point. By comparison, the share of banks with any 1-4 family first-lien residential mortgage debt remained generally stable over the 2001 to 2015 period at 97%.
As a share of total assets, the total amount of multifamily residential debt outstanding grew slightly between 2001 and 2015, from 1.6% in 2001 to 2.2% in 2015. That growth largely took place in the last few years. Between 2001 and 2012, multifamily residential debt outstanding as a percentage of total assets held steady at 1.6%. Since 2012, multifamily residential debt relative to total assets grew by 0.6 percentage point.
Fixed 30-year mortgage rates in the United States averaged 3.69 percent in the week ending July 22 of 2016, up 4bps from the previous week. Mortgage Rate in the United States averaged 6.45 percent from 1990 until 2016, reaching an all time high of 10.56 percent in April of 1990 and a record low of 3.47 percent in December of 2012. Mortgage Rate in the United States is reported by the Mortgage Bankers Association of America.
Actual
Previous
Highest
Lowest
Dates
Unit
Frequency
3.69
3.65
10.56
3.47
1990 – 2016
percent
Weekly
MBA 30-Year Mortgage Rate is average 30-year fixed mortgage lending rate measured during the reported week and backed by the Mortgage Bankers Association. . This page provides the latest reported value for – United States MBA 30-Yr Mortgage Rate – plus previous releases, historical high and low, short-term forecast and long-term prediction, economic calendar, survey consensus and news. United States MBA 30-Yr Mortgage Rate – actual data, historical chart and calendar of releases – was last updated on July of 2016.
Case Shiller Home Price Index in the United States is expected to be 182.37 Index Points by the end of this quarter, according to Trading Economics global macro models and analysts expectations. Looking forward, we estimate Case Shiller Home Price Index in the United States to stand at 179.06 in 12 months time. In the long-term, the United States S&P Case-Shiller Home Price Index is projected to trend around 159.65 Index Points in 2020, according to our econometric models.
Forecast
Actual
Q1/16
Q2/16
Q3/16
Q4/16
2020
Unit
Case Shiller Home Price Index
183
182
182
180
179
160
Index Points
United States S&P Case-Shiller Home Price Index Forecasts are projected using an autoregressive integrated moving average (ARIMA) model calibrated using our analysts expectations. We model the past behaviour of United States S&P Case-Shiller Home Price Index using vast amounts of historical data and we adjust the coefficients of the econometric model by taking into account our analysts assessments and future expectations. The forecast for – United States S&P Case-Shiller Home Price Index – was last predicted on Tuesday, March 29, 2016.
Prices in the year to come are going to be a lot worse than most earlier forecasts, according to Clear Capital’s view of the market, which refuses to “sugarcoat the data”. The provider of real estate valuations, data and analytics calls for continued market instability and a trend of decreasing rates over the next 12 months, especially in mid tier homes.
The overall Clear Capital® Home Data Index™ (HDI™) forecasts 2016 home price appreciation will be in the range of 1 percent to 3 percent, significantly lower than the 5.1 percent growth rate during 2015 and the 6.6 percent growth rate in 2014, demonstrating continued market instability and a trend of decreasing rates.
Most other forecasts, including Fannie Mae and Freddie Mac, have called for a modest decline in price appreciation in 2016, to 3 to 4.5 percent.
“While we would love to sugarcoat the HDI data and declare that 2016 merely will be a normalization of the housing market to historical averages not seen since the late 1990s, several factors indicate that it could be another volatile year leading to ongoing uncertainty about the future of American housing,” says Alex Villacorta, Ph.D., vice president of research and analytics at Clear Capital.
Ultimately, overall national growth will be positive throughout 2016, but these rates are underwhelming and signal the end of the explosive growth typical of the first half of this decade. The forecast is predicting an average of only 0.4 percent quarter-over-quarter (QoQ) growth for each quarter during 2016. Growth in this range is rather lackluster when compared to the previous two years, when home prices grew by an average of 1.5 percent quarterly over the period from January 2014 to January 2016.
Homes in the low tier (selling below $116,000 nationwide) are forecasted to appreciate more significantly than other tiers during the next year, averaging just under 1.0 percent quarterly growth throughout 2016. By definition, the low tier is affordable to the widest range of potential homeowners and investors. This larger class of buyers will likely cause continued higher appreciation for the country’s most affordable home tier.
The overall trend of decreasing rates of growth during 2016 will primarily affect the middle price tier—representing the middle 50 percent of all transactions, currently comprised of homes selling between $116,000 and $337,500 nationwide. While growth in the middle price range is not projected to be the lowest of all the price tiers, the mid tier shows a consistent decrease in quarterly growth over the forecast period, falling from 0.5 percent QoQ growth in January 2016 to just under 0.2 percent QoQ by the end of the year.
Conversely, the top price tier (homes selling above $337,500 nationwide) forecasts relatively consistent quarterly growth, hovering around the 0.2 percent QoQ mark. Historically, pricing in this class of homes has moved slowly in the sense that gains and losses both have been smaller by percentage due to higher initial prices. The contrast to the low tier highlights the diversity in performance that remains in today’s real estate market.
Generally, year-over-year growth rates are forecasted to be lower for all MSAs in the nation, with no exceptions . The highest growth in 2016 is forecasted to occur in Denver, where home prices are projected to grow by 7.7 percent during the course of the upcoming year, compared to the 11.7 percent annual growth seen in 2015.
While slower growth plagues the forecasts of all major cities across the nation, the luxury markets are among the hardest hit. Miami and San Jose are projected to grow by only 1.3 percent and 1.4 percent respectively during 2016, after each MSA saw market growth in excess of 10% during 2015. Other cities like Chicago, New York, and San Francisco are forecasted to see significant changes to their 2015 performance, with little to no growth for the upcoming year.
Home price appreciation in Detroit, which saw an uncharacteristic increase in QoQ growth toward the end of 2015, is forecasted to fall 5.8 percent over the course of 2016. This is compared to annual growth in excess of 11 percent in 2015, making Detroit one of the hardest-hit MSAs of the forecast. Since May 2013, the Detroit MSA has seen declining quarterly gains in 9 of 10 quarters, with the most recent quarter less than half of the Q3 2015 market performance. Based on this rapidly decelerating rate of price growth, it is quite possible this metro turns negative by year end.
NAHB analysis of Census construction spending data shows that total private residential construction spending for October increased to a seasonally adjusted annual rate of $399 billion. On a month-over-month basis, private single-family spending was $226 billion, up by 1.6% over the revised September estimate. Private multifamily spending increased to $58 billion, up by 1.4%.
Annually, the pace of multifamily spending rose 28% from the October 2014 estimate, and spending on single-family construction was 11% higher.
The NAHB-constructed spending index, which is shown in the graph below (the base is January 2000), indicates that recent gains have been driven by the steady increase in multifamily construction spending. The pace of the multifamily spending is gradually slowing. The monthly growth rate of multifamily construction fell to 1.4% in October from relatively higher rates in August (8%) and September (6%). NAHB anticipates accelerating growth for single-family spending in 2015.
The pace of total nonresidential construction spending increased by 1% monthly in October, and the annual increase from the revised September 2014 estimate was 11%. The largest contribution to this year-over-year nonresidential spending gain was made by the class of manufacturing-related construction (41% increase), followed by lodging (30% increase) and amusement/recreation (24% increase).
This is the third of three articles about the U.S. housing market. Ex-housing, the U.S. is in deflation currently at -1% YoY. So the only current “inflation risk” that might justify the Fed raising rates is the appreciation in house prices. In my previous two posts, I explained that both housing and apartment demand are supported by increased demographic demand, as the Millennial generation creates about the same affect on single and multi-unit housing as their Boomer parents and grandparents did 50 years ago. Further, there has been a marked increase in foreign buying of homes, skewed towards the upper end and disproportionately all-cash purchases. As a big part of this increase has come from Chinese nationals, the current problems hitting that county may ease demand, and therefore ease upward pressure, on U.S. house prices.
But some have argued that housing has entered a 2nd bubble. Some of this comes from the usual Doomer chorus Seriously, one guy actually claimed a couple of weeks ago that there was a bubble in rents! It must be the Underpants Gnomes theory of bubbles: 1. rent lots of vacant units 2. ??? 3. Profit!
What’s the missing step 2? Sublet everything, because everyone knows that rents only go up?!?
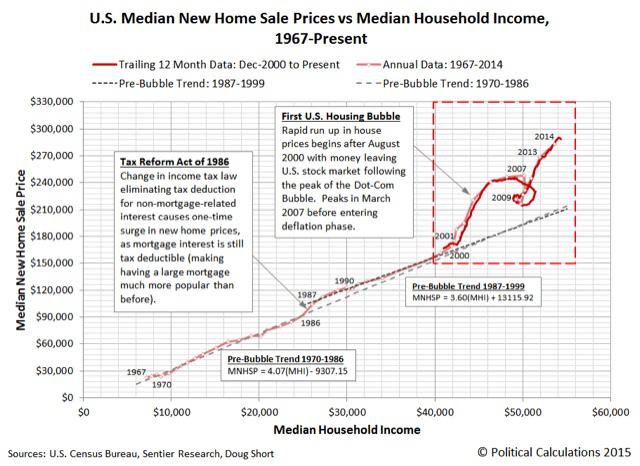
But some is more serious analysis. The website Political Calculations, for example, believes there is a bubble based on the movement in prices vs. median household income. Here’s their relevant graph:
The point of view does have merit, since after all it is households buying houses! But I believe that misses the bigger picture.
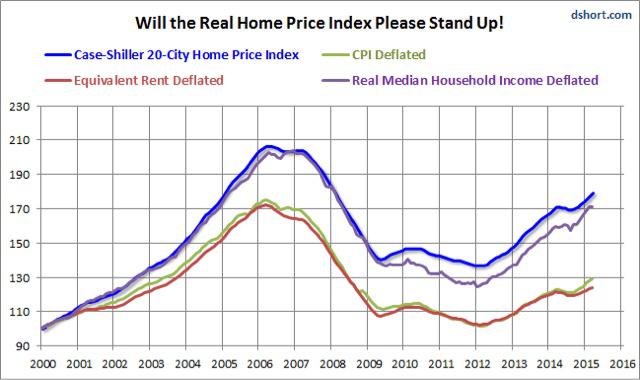
To begin with, the big problem in assessing house prices is that, since housing is itself nearly 40% of the CPI, by what should house prices be deflated, for a “real” measure? Here is a graph created by Doug Short, the Case Shiller house index by median household income, by the entire CPI, and by owner’s equivalent rent:
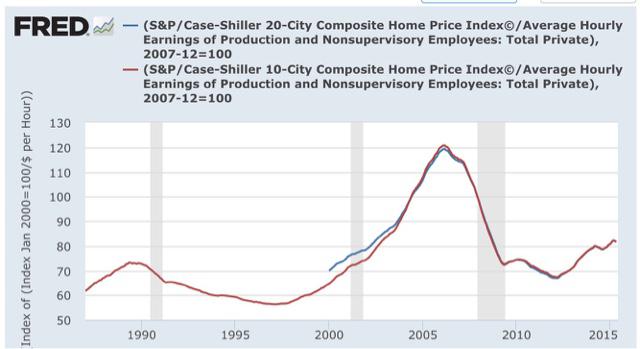
Nominal house prices, and prices deflated by median household income, appear to show housing in a new bubble. But deflated by CPI and by owner’s equivalent rent, prices haven’t moved much off their bottom. Nor has there been much movement when house prices are deflated by average hourly wages:
To sort out how extreme (or not) house prices are, let’s consider three types of purchasers: 1. the entry level purchaser, likely young, likely buying a townhouse, condo, or small single family home perhaps in an inner ring suburb. 2. the move-up purchaser, trading in a smaller house for a bigger one. 3. the retirement purchaser, either downsizing or building the retirement home of their dreams.
Income is likely the main measure for the 1st purchaser. They probably don’t have a lot of savings with which to make a big downpayment, and may be getting help from family members. The most important thing for them is whether they will be able to make the monthly mortgage payment and other bills.
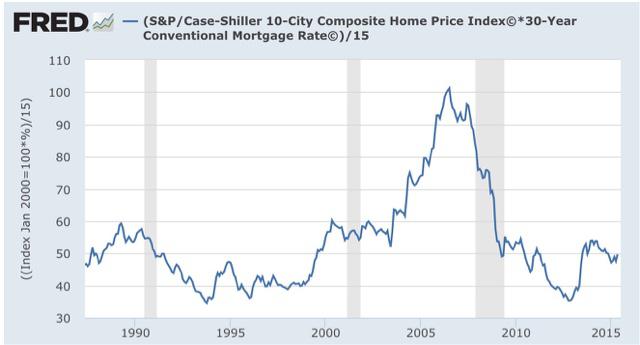
While household income constrains that ability, mortgage rates also loom large. And here is what happens when we calculate the monthly mortgage payment of a house, as measured by the Case Shiller Index, and then adjusted for mortgage rates:
Courtesy of lower mortgage rates, even though median household income has actually declined for all ages 25-64 since 2007, the typical monthly mortgage payment now is only about 50% of what it was at the peak of the housing bubble, even when we take median household income into account.