Tag Archives: #MtKisco

Housing starts analysis | Mt Kisco Real Estate

Comments on August Housing Starts


Earlier: Housing Starts Increased to 1.282 Million Annual Rate in August

Housing starts in August were above expectations,  and starts for June and July were revised up.  Most of the increase, and upward revisions, were due to the multi-family starts that are volatile month-to-month.

The housing starts report released this morning showed starts were up 9.2% in August compared to July (and August starts were revised up), and starts were up 9.4% year-over-year compared to August 2017.

Multi-family starts were down 38% year-over-year, and single family starts were down slightly year-over-year.

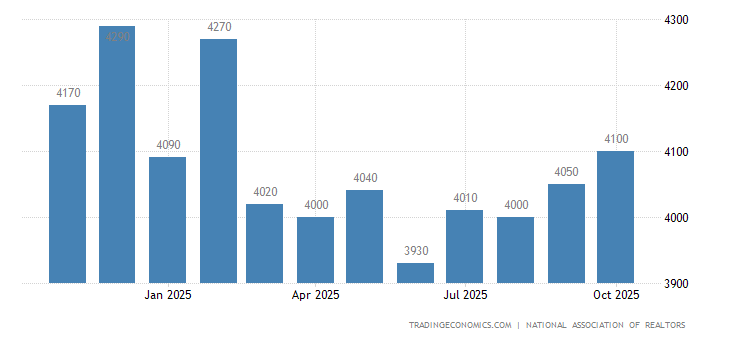
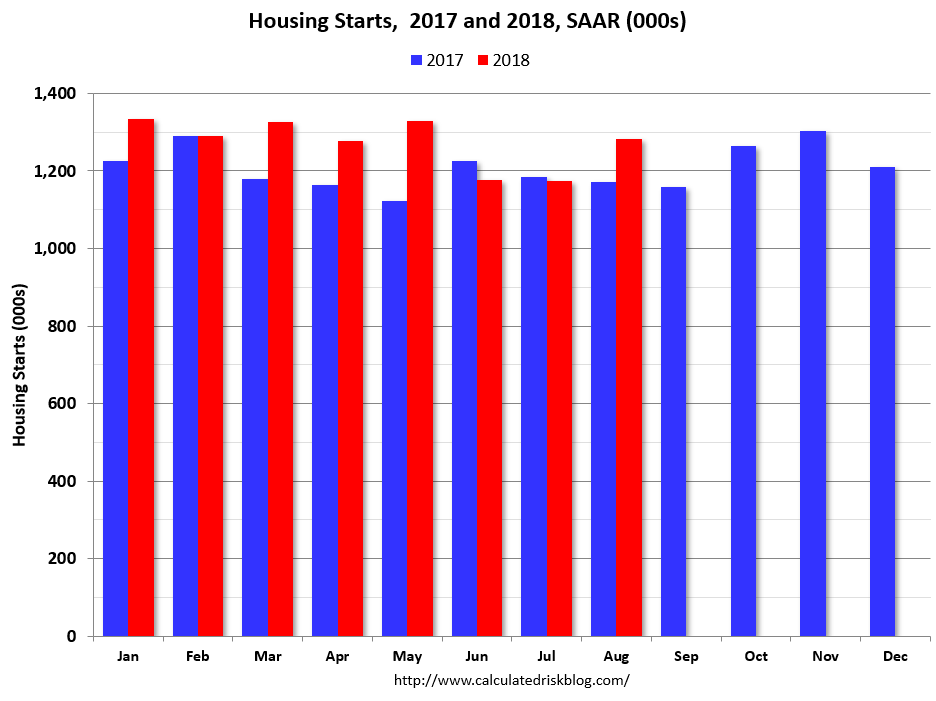
This first graph shows the month to month comparison for total starts between 2017 (blue) and 2018 (red).

image: https://1.bp.blogspot.com/-QB_1ld2C2zg/W6JFJO03NdI/AAAAAAAAwCw/oMfZl_MNKV4JQQ89VJQniVoY4Ye5wNn3wCLcBGAs/s320/Starts20172018Aug.PNG

Starts Housing 2017 and 2018Click on graph for larger image.

Starts were up 9.4% in August compared to August 2017.

Through eight months, starts are up 6.9% year-to-date compared to the same period in 2017.   That is a decent increase.

Note that 2017 finished strong, so the year-over-year comparisons will be more difficult in Q4.

Below is an update to the graph comparing multi-family starts and completions. Since it usually takes over a year on average to complete a multi-family project, there is a lag between multi-family starts and completions. Completions are important because that is new supply added to the market, and starts are important because that is future new supply (units under construction is also important for employment).

These graphs use a 12 month rolling total for NSA starts and completions.

image: https://4.bp.blogspot.com/-0xhVPfh9cYs/W6JIb4I3CSI/AAAAAAAAwC8/BEcLqA1gitQDc3A9Al4_nRmL5aFh0fUiwCLcBGAs/s320/MultiAug2018.PNG

Multifamily Starts and completions
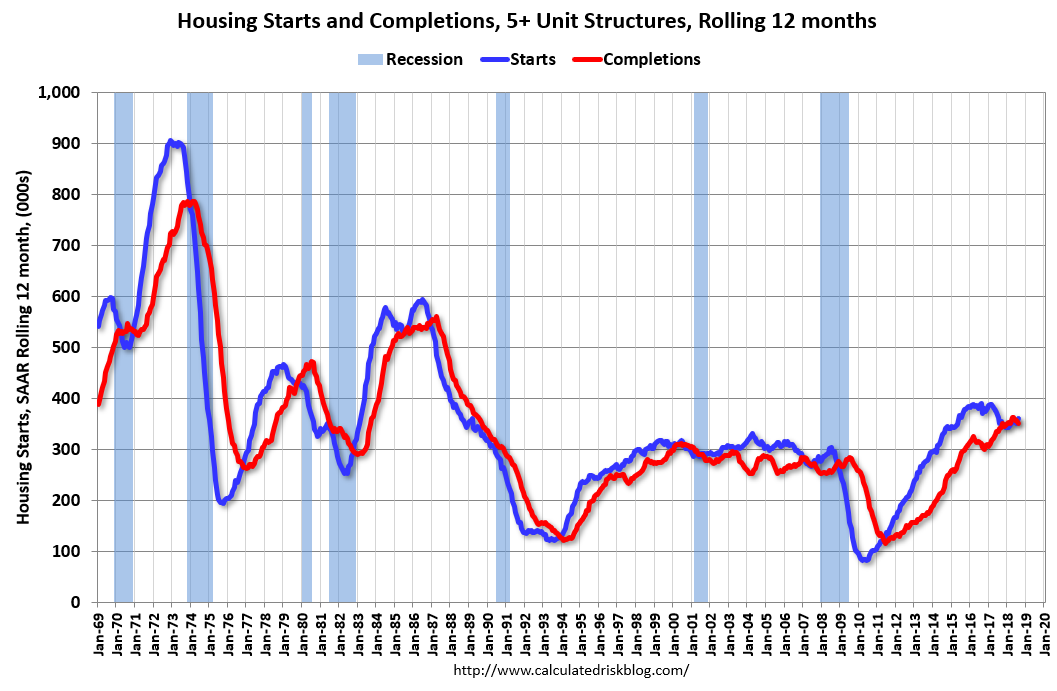
The blue line is for multifamily starts and the red line is for multifamily completions.

The rolling 12 month total for starts (blue line) increased steadily for several years following the great recession – but turned down, and has moved sideways recently.  Completions (red line) had lagged behind – however completions and starts are at about the same level now (more deliveries).

It is likely that both starts and completions, on rolling 12 months basis, will now move mostly sideways.

As I’ve been noting for a few years, the significant growth in multi-family starts is behind us – multi-family starts peaked in June 2015 (at 510 thousand SAAR).

image: https://4.bp.blogspot.com/-2POZ_G_0KLM/W6JIeSHjiXI/AAAAAAAAwDA/WqiMP6SJVeMzG5uNm7yh_15gaMoqvNRDACLcBGAs/s320/SingleAug2018.PNG

Single family Starts and completions
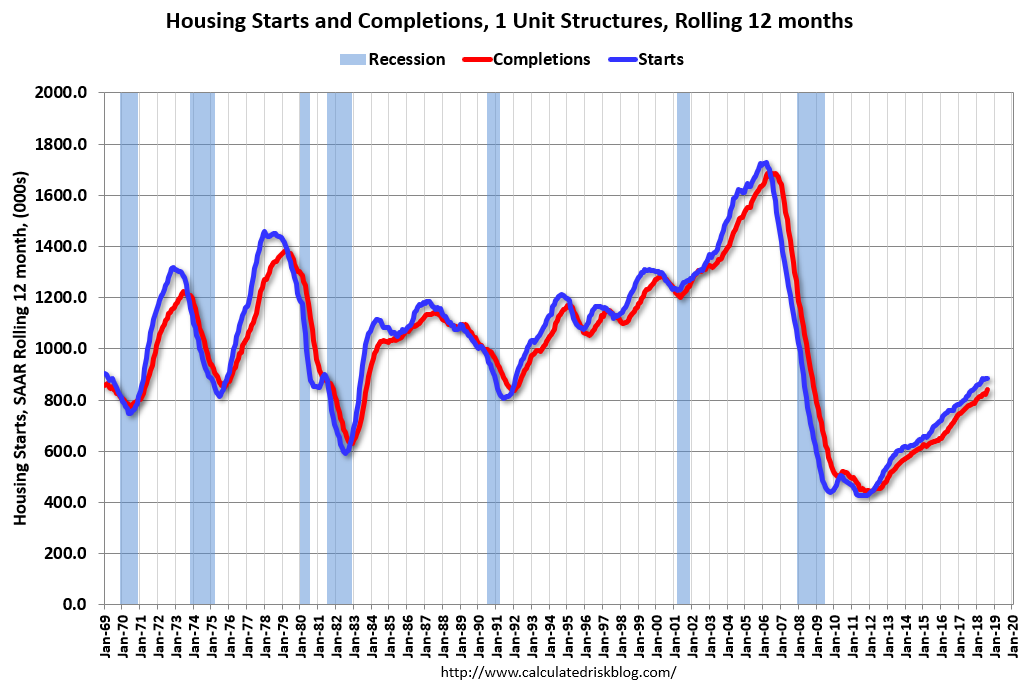
The second graph shows single family starts and completions. It usually only takes about 6 months between starting a single family home and completion – so the lines are much closer. The blue line is for single family starts and the red line is for single family completions.

Note the relatively low level of single family starts and completions.  The “wide bottom” was what I was forecasting following the recession, and now I expect a couple more years, or more, of increasing single family starts and completions.

Note: Two months ago, in response to numerous articles discussing the “slowing housing market” and some suggesting “housing has peaked”, I wrote: Has Housing Market Activity Peaked? and Has the Housing Market Peaked? (Part 2). My view – that there will be further growth in housing starts – remains the same.

Read more at https://www.calculatedriskblog.com/#o2tyGm3q82iFADMX.99

U. S. homebuilding falls | Mt Kisco Real Estate

U.S. homebuilding fell more than expected in February as a plunge in the construction of multi-family housing units offset a second straight monthly increase in single-family projects.

Housing starts declined 7.0 percent to a seasonally adjusted annual rate of 1.236 million units, the Commerce Department said on Friday. Data for January was revised up slightly to show groundbreaking increasing to a 1.329 million-unit pace instead of the previously reported 1.326 million units.

Economists polled by Reuters had forecast housing starts falling to a pace of 1.290 million units last month. Permits for future home building decreased 5.7 percent to a rate of 1.298 million units in February.

Pole Homes Sunshine Coast financial markets were little moved by the data.

While the volatile multi-family housing segment accounted for the decline in home building last month, the broader housing market appears to be slowing.

Sales of both new and previously owned homes have slumped in recent months as a dearth of properties on the market pushed up prices, sidelining some first-time home buyers. House price gains topped 6.0 percent in December.

Mortgage rates have also risen, with the 30-year fixed-rate currently averaging 4.44 percent, not too far from a four-year high of 4.46 percent, according to mortgage finance agency Freddie Mac. But the housing market remains underpinned by a robust labor market.

There is growing optimism that tightening job market conditions will translate into faster wage growth in the second half of this year. Annual wage growth has been stuck below 3.0 percent even as the unemployment rate has dropped to a 17-year low of 4.1 percent.

Single-family homebuilding, which accounts for the largest share of the housing market, increased 2.9 percent to a rate of 902,000 units in February. Single-family home construction rose in the Northeast, South and West, but tumbled in the Midwest.

Permits to build single-family homes slipped 0.6 percent in February to a 872,000 unit-pace. With permits lagging starts, single-family home construction could slow in the months ahead.

A survey on Thursday showed confidence among homebuilders dipping in March, but remaining in strong territory. Builders were less upbeat about sales and buyer traffic over the next six months.

Starts for the volatile multi-family housing segment tumbled 26.1 percent to a rate of 334,000 units in February, the lowest level since September 2017. Permits for the construction of multi-family homes dropped 14.8 percent to a 426,000 unit-pace.

Housing completions increased 7.8 percent to a rate of 1.319 million units in February. That was the highest level since January 2008. The number of single-family houses completed last month was the highest since March 2008.

There were 501,000 single-family housing units under construction in February, the most since June 2008. This should help to alleviate some of the property shortage and probably slow the house price inflation.

read more…

https://www.cnbc.com/2018/03/16/housing-starts-february.html

Cladding used in many U.K. high-rises ‘combustible’ | Mt Kisco Real Estate

LONDON — Tests on the exterior cladding of tower blocks across Britain that use similar material found outside the building in west London where at least 79 people died in a fire have shown that some of them are “combustible,” British Prime Minister Theresa May said Thursday.

May said the tests were being carried out so that “all possible steps to ensure buildings are safe” were taken. Investigators believe that the type of exterior cladding used on the Grenfell Tower after a refurbishment last year may have caused the fire to spread more rapidly than if a different material was used. It had a plastic core.

The fire’s cause has not been established, although investigators suspect it may have started when a refrigerator exploded on one of the block’s lower floors.

There are thought to be approximately 4,000 tower blocks in Britain similar to the 24-storey residential complex in Kensington that went up in flames last week.

May said in an address to Parliament that authorities have been checking about 100 buildings a day and that the results come back within hours. Her office estimated that there are about 600 buildings in Britain that have the same type or similar cladding to that used in Grenfell Tower. However, May said it was still too early to draw conclusions about what caused the fire or why it appeared to spread so quickly.

“I urge any landlord who owns a building of this kind to send samples for testing as soon as possible. Any results will be communicated immediately to local authorities and local fire services. Landlords have a legal obligation to provide safe buildings and where they cannot do that we expect alternative accommodation to be provided. We cannot and will not ask people to live in unsafe homes,” she said.

May’s address came as the chief administrator of the neighborhood where the fire took place resigned Thursday, effectively marking the disaster’s first formal departure of a high-level official in the wake of Britain’s worst blaze in decades.

Nicholas Holgate, chief executive of the Kensington and Chelsea council, said he was asked to leave by May’s government. The initial days after the June 14 inferno were marked by chaos as authorities struggled to deal with the scope of the aftermath.

Residents who survived the tower blaze lost everything, only to get little help or information on how to secure shelter or vital supplies. Of the 600 people who lived in the tower block, many were low-income workers, recent immigrants and refugees.

Researchers at the Universite Catholique de Louvain in Belgium believe the Grenfell Tower disaster is now the deadliest fire in mainland Britain since they started keeping close records at the start of the 20th century. A fire at Bradford City Stadium in northern England on May 11, 1985, killed 56 people.

read more…


https://www.usatoday.com/story/news/world/2017/06/22/london-fire-grenfell-tower/103097418/

Used home sales rise 1.1% | Mt Kisco Real Estate

Sales of previously owned houses in the United States went up 1.1 percent month-over-month to a seasonally adjusted annual rate of 5.62 million in May of 2017, following a downwardly revised 5.56 million in the previous month and beating market expectations of a 0.5 percent drop. Sales of single family houses went up 1 percent to 4.98 million after falling by 2.8 percent in the previous month and those of condos increased 1.6 percent to 0.64 million, following a flat reading in April. The median house price increased to an all-time high of $252,800 and the months’ worth of supply went up to 4.2 percent from 4.1 percent. In addition, the number of houses available in the market increased to 1.96 million from 1.92 million in April. Existing Home Sales in the United States averaged 3902.01 Thousand from 1968 until 2017, reaching an all time high of 7250 Thousand in September of 2005 and a record low of 1370 Thousand in March of 1970.

United States Existing Home Sales
CalendarGMTActualPreviousConsensusForecast (i)
2017-05-2402:00 PMApr5.57M5.70M5.65M5.7M
2017-06-2102:00 PMMay1.1%-2.5%-0.5%0.6%
2017-06-2102:00 PMMay5.62M5.56M5.55M5.6M
2017-07-2402:00 PMJun5.62M5641.63%
2017-07-2402:00 PMJun1.1%5641.63%
2017-08-2402:00 PMJul5620.38%

read more…

www.tradingeconomics.com

Homes are officially being sold at the highest prices, ever | Mt Kisco Realtor

Thanks to rising demand and shrinking supply, the median existing-home price for all housing types reached an all-time high in June.

According to the latest data from the National Association of Realtors, the median existing-homes sales price rose to $236,400, which exceeds the previous peak median sales price set in July 2006 of $230,400.

June’s total also rose 6.5% above June 2014.

In May, the median existing-home price for all housing types was $228,700, which was 7.9% above May 2014.

That marked the 39th consecutive month of year-over-year price gains, making June the 40th straight month of year-over-year price gains.

Despite record prices, existing-home sales also reached their highest pace in more than eight years.

Total existing-home sales, which are completed transactions that include single-family homes, townhomes, condominiums and co-ops, increased 3.2% to a seasonally adjusted annual rate of 5.49 million in June from a downwardly revised 5.32 million in May.

Sales are now at their highest pace since February 2007 (5.79 million), have increased year-over-year for nine consecutive months and are 9.6% above a year ago (5.01 million).

Lawrence Yun, NAR chief economist, said that buoyed by June’s solid gain in closings, this year’s spring buying season has been the strongest since the crisis began.

“Buyers have come back in force, leading to the strongest past two months in sales since early 2007,” Yun said. “This wave of demand is being fueled by a year-plus of steady job growth and an improving economy that’s giving more households the financial wherewithal and incentive to buy.”

According to NAR’s report, total housing inventory at the end of June rose slightly by 0.9% to 2.30 million existing homes available for sale, which is is 0.4% higher than the same time period a year ago (2.29 million).

Unsold inventory is at a 5.0-month supply at the current sales pace, down from 5.1 months in May.

“Limited inventory amidst strong demand continues to push home prices higher, leading to declining affordability for prospective buyers,” said Yun. “Local officials in recent years have rightly authorized permits for new apartment construction, but more needs to be done for condominiums and single-family homes.”

According to NAR’s report, the percent share of first-time buyers fell to 30% in June from 32% in May, but remained at or above 30% for the fourth consecutive month.

One year ago, first-time buyers represented 28% of all buyers.

NAR President Chris Polychron said that Realtors are reporting “drastic imbalances” of supply in relation to demand in many metro areas — especially in the West.

“The demand for buying has really heated up this summer, leading to multiple bidders and homes selling at or above asking price,” Polychron said. “Furthermore, tight inventory conditions are being exacerbated by the fact that some homeowners are hesitant to sell because they’re not optimistic they’ll have adequate time to find an affordable property to move into.”


read more…


http://www.housingwire.com/articles/34546-homes-are-officially-being-sold-at-the-highest-prices-ever

Housing Starts in U.S. Surge to Second-Highest Level Since 2007 | Mt Kisco Real Estate

New-home construction in the U.S. climbed in June to the second-highest level since November 2007 as builders stepped up work on apartment projects.

Housing starts rose 9.8 percent to a 1.17 million annualized rate from a revised 1.07 million in May that was stronger than previously estimated, figures from the Commerce Department showed Friday in Washington. The median estimate of economists surveyed by Bloomberg was a 1.11 million rate. Ground-breaking on multifamily dwellings jumped 29.4 percent.

Building permits for single and multifamily properties, a gauge of future construction, climbed to an almost eight-year high, the report showed. Steady job gains, low mortgage rates and a gradual easing of lending standards are propelling sales, indicating housing will become a bigger source of strength for the economy.

“They’re pretty positive numbers,” said Lewis Alexander, chief economist at Nomura Securities International Inc. in New York. “You’ve got decent employment growth that’s been particularly good for young people, you’ve got relatively low interest rates, somewhat easing of credit standard — all of those things are helping.”

Estimates for housing starts in the Bloomberg survey of 76 economists ranged from 1.03 million to 1.23 million. The May figure was revised up from 1.04 million.

The gain in starts of multifamily homes followed a 16.9 percent decrease the previous month and a 37.5 percent April surge. Data on these projects, which have led housing starts in recent years, can be volatile.

Single-Family Homes

Starts of single-family houses eased to a 685,000 rate from 691,000 a month earlier, the report showed.

Three of four regions had a decrease in single-family construction in June, paced by a 27.3 percent drop in the Northeast and a 7.1 percent decline in West, according to the report.

Building permits increased 7.4 percent in June to a 1.34 million annualized rate, the highest since July 2007. They were projected to fall to 1.15 million.


read more…


http://finance.yahoo.com/news/housing-starts-u-surge-highest-123001192.html

Detroit-area homeowners apply to avoid foreclosure | Mt Kisco Real Estate

More than 13,000 Detroit-area property owners have entered into payment plans hoping to avoid losing their homes to tax foreclosure, but another 16,000 living in their homes have yet to take advantage of the offer ahead of Tuesday’s deadline.

Hundreds of applicants sat in a hotel ballroom waiting for the chance to plead their cases before Wayne County Treasury workers. Many had lined up before 7 a.m. to be heard before the 4:30 p.m. deadline.

“I’m downhill and I can’t get out,” said Kevin Franklyn, who was waiting his turn to see if the more than $15,000 he owes on his home and a dozen or so rental properties can be turned into something more manageable.

“I’m going to try to pay what I can,” said Franklyn, 46, who blamed his tenants’ nonpayment of rent for his struggles.

More than 60,000 of the county’s 76,000 foreclosed properties are in Detroit, threatening neighborhoods hard hit by the national mortgage crisis. About $326 million in taxes, interest and fees are owed on the foreclosed homes, lots and other buildings in Detroit.

City officials fear that more foreclosures will only add to the glut of vacant houses in Detroit and blight that keeps potential homebuyers away.

Taxes have been paid in full for about 20,700 of the foreclosed properties, partly through the payment plan, according to Chief Deputy Treasurer David Szymanski.

Of the 38,100 properties still facing foreclosure, only 15,900 are occupied.

“Those are the ones we want to get to,” Szymanski said. The county has to collect property taxes by law.

City and county officials urged state lawmakers to pass foreclosure prevention bills and Gov. Rick Snyder signed the legislation in January to provide homeowners facing financial hardship with the option to sign up for a payment plan to avoid foreclosure. The bills also cut interest rates, reduced down payments and capped past due taxes.

Szymanski said more than 13,000 homeowners have entered into payment assistance plans already.

Bryan Ely, 28, of Detroit, said he owes about $20,000 in back taxes on his home on Detroit’s northwest side.


read more…


http://finance.yahoo.com/news/1000s-detroit-area-homeowners-apply-151653604.html

Down Payment Assistance Available to Most Buyers | Mount Kisco Real Estate

A study to make home buyers realize that they could qualify for a free down payment without winning the lottery found that 87 percent U.S. of US homes qualify for down payment help.

“Many homebuyers, especially Millennials, haven’t fully investigated their home financing options because they are pessimistic about qualifying for a mortgage. Our Homeownership Program Index highlights the wide range and availability of down payment programs available to today’s homebuyers. In fact, 91 percent of the 2,290 programs in our registry have funds available to lend to eligible buyers. Plus, income limits vary depending on the market and programs extend beyond just first-time homebuyers,” said Rob Chrane, president and CEO of Down Payment Resource. “It’s important for buyers to research down payment programs as part of their loan shopping process.”

“Historically low homeownership rates across nearly every age demographic have led to a public policy push to lower the barrier to homeownership through down payments as low as 3 percent, but the fact is that the barrier to homeownership is often much lower than even that 3 percent for borrowers who take advantage of one of the myriad down payment help programs available across the country,” said Daren Blomquist, vice president at RealtyTrac. “Prospective buyers — or their agents — willing to put in a few minutes of time to find out what programs are available to them will put themselves in a much better position to successfully purchase a home.”

RealtyTrac looked at 2,290 down payment programs from Down Payment Resource’s Homeownership Program Index and found that out of more than 78 million U.S. single family homes and condos in 1,792 counties with sufficient home value data, more than 68 million (87 percent) would qualify for a down payment program available in the county where they are located based on the maximum price requirements for those programs and the estimated value of the properties.


read more..


http://www.realestateeconomywatch.com/2015/02/down-payment-assistance-available-to-most-buyers/


The Home from ‘Paranormal Activity’ Sold in a Hot Second | Mt Kisco Real Estate

The San Diego home from Paranormal Activity was listed withColdwell Banker on January 21, but it didn’t stay that way for long. The sale history on Zillow shows that the listing was taken down just eight days later. Given what looks like a quick turnaround, it probably went for the full asking price of $749K, if it did indeed sell. In which case, congrats to the new owners on your demon house!

Aside from being the one of the best found-footage horror films ever (let’s all forget the sequels ever happened), Paranormal Activity stood out because the dread was so directly centered on a very average American home. Covering a really extroverted demon’s attempts to reach out to a young couple, it was genuinely scarier to watch at home, and having your significant other with you might have made it even scarier.

Scan the listing photos below, and note that the bed is oriented differently than in it was in the film, affording a greater distance between it and the hallway door.


read more…


http://curbed.com/archives/2015/02/02/paranormal-activity-house-for-sale-sold.php

New Year Mortgage Rates | Mt Kisco Homes

Fannie Mae today released the results of its Primary Mortgage Market Survey® (PMMS®), showing average fixed mortgage rates starting 2015 by diving amid sliding bond yields to their lowest level since May 23, 2013, when the 30-year fixed averaged 3.59 percent.

News Facts

  • 30-year fixed-rate mortgage (FRM) averaged 3.73 percent with an average 0.6 point for the week ending January 8, 2014, down from last week when it averaged 3.87 percent. A year ago at this time, the 30-year FRM averaged 4.51 percent.
  • 15-year FRM this week averaged 3.05 percent with an average 0.5 point, down from last week when it averaged 3.15 percent. A year ago at this time, the 15-year FRM averaged 3.56 percent.
  • 5-year Treasury-indexed hybrid adjustable-rate mortgage (ARM) averaged 2.98 percent this week with an average 0.5 point, down from last week when it averaged 3.01 percent. A year ago, the 5-year ARM averaged 3.15 percent.
  • 1-year Treasury-indexed ARM averaged 2.39 percent this week with an average 0.4 point, down from last week when it averaged 2.40 percent. At this time last year, the 1-year ARM averaged 2.56 percent.

Average commitment rates should be reported along with average fees and points to reflect the total upfront cost of obtaining the mortgage. Visit the following links for theRegional and National Mortgage Rate Details and Definitions. Borrowers may still pay closing costs which are not included in the survey.

Quotes
Attributed to Frank Nothaft, vice president and chief economist, Freddie Mac.

“Mortgage rates fell to begin the year as 10-year Treasury yields slid beneath 2 percent for the first time in three months. Meanwhile, the Fed minutes indicated ongoing discussion regarding the timing of the first rate hike. Of the few economic releases this week, ADP Research Institute reports the private sector added an estimated 241,000 jobs in December, which exceeded market expectations and followed an upward revision of 19,000 jobs in November.”