Tag Archives: housing starts

Housing starts report 22% decline | Bedford Corners Real Estate

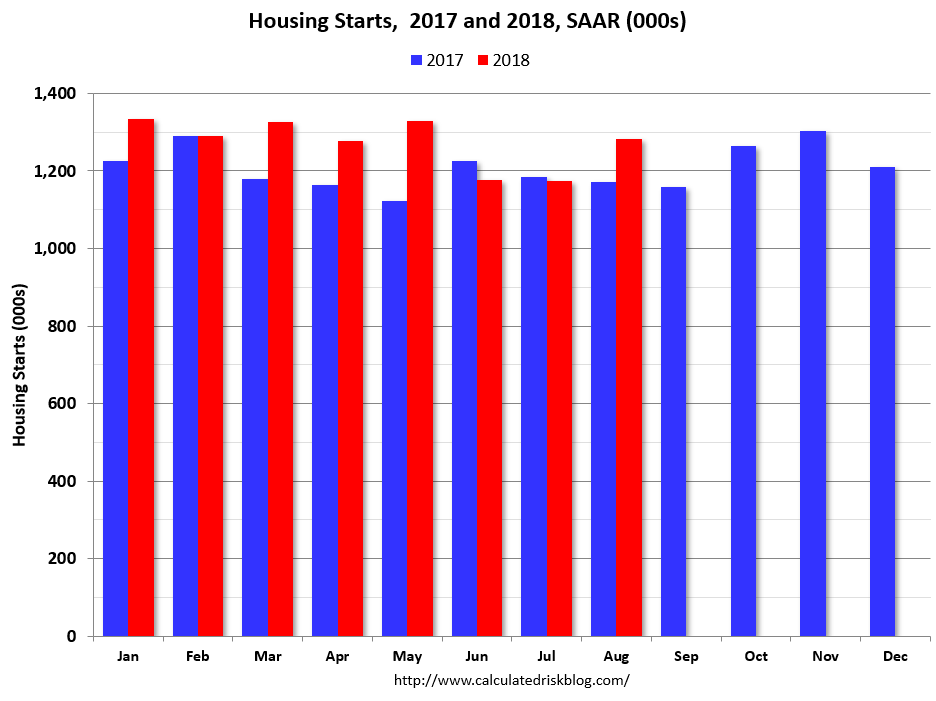
New residential construction slowed sharply in March as the coronavirus pandemic swept across the United States. Privately-owned housing starts declined last month to an annualized rate of 1.2 million, the US Census Bureau said Thursday. That represents a 22% decline from the pace in February.All four geographical segments in the United States were down, led by a 43% plunge in the Northeast, which is getting hit hardest by the health crisis.

22 million Americans have filed for unemployment benefits in the last four weeks

22 million Americans have filed for unemployment benefits in the last four weeksThe worse-than-expected declines in housing starts reflects the economic impact caused bythe pandemic.”Unprecedented economic uncertainty and mandatory distancing guidelines squashed homebuyer demand and builders’ ability to confidently invest in new housing projects,” Zillow economist Matthew Speakman wrote in an email Thursday.Despite the sharp month-over-month drop, housing starts were still up from a year ago.Many construction projects have been classified as essential work, meaning they could continue despite stay-at-home orders across the country. Yet social distancing requirements can slow that work and mounting job losses gave homebuilders pause.Building permits, a more forward-looking indicator, also slowed. Privately-owned housing units authorized by permits in March dropped to an annual rate of 1.4 million, Census said. That’s 7% below the February pace. The drop was led by single-family authorizations. However, authorizations of multi-unit buildings rose by 5% from the February pace.

Record plunge in homebuilder confidence

It’s the latest sign that the pandemic will have hurt America’s once-booming housing market.Industry executives have become significantly more pessimistic about the outlook for the housing market.US homebuilder confidence for single-family homes plunged in April by a record 42 points, according to a National Association of Homebuilders index released Wednesday.”The unfolding nightmare in the labor market has removed large numbers of potential homebuyers from the pool,” Ian Shepherdson, chief economist at Pantheon Macroeconomics, wrote in a report Wednesday.New numbers released Thursday show that another 5.2 million Americans filed for unemployment benefits in the week ended April 11. All told, 22 million people have filed for first-time claims since mid-March.

The stock market is acting like a rapid recovery is a slam dunk. It's not

The stock market is acting like a rapid recovery is a slam dunk. It’s notThe government is attempting to avoid a wave of foreclosures caused by the mass layoffs by allowing homeowners hurt by the coronavirus pandemic to postpone payments.Yet many Americans may be less willing to buy homes when they read the dreary economic headlines and look at sharp declines in their investment portfolios.”Everything will get revalued. If the stock market is lower, that has massive wealth effects,” said Peter Boockvar, chief investment officer at Bleakley Advisory Group.Yet others argue that historically-low borrowing costs and a limited amount of supply of homes will insulate the real estate market.”I don’t expect a collapse in prices,” said David Kelly, chief global strategist at JPMorgan Asset Management. “There’s no reasons to sell your home at a loss this year if you can get a better price next year.”

read more…

cnn.com

US housing starts increase | Pound Ridge Real Estate

U.S. Housing Starts Increased Along With Permits in October

U.S. new-home construction rose in October as single-family starts registered the strongest pace since the beginning of the year. The highest level of permits since 2007 shows healthy homebuilding ahead.

Residential starts advanced 3.8% to a 1.31 million annualized rate, in line with the median estimate in a Bloomberg survey of economists, after a revised 1.27 million pace in the prior month, according to Commerce Department figures released Tuesday. Permits, a proxy for future construction, rose 5% to a 1.46 million pace, the most since May 2007.

The starts data are in line with recent reports that indicate the housing market is improving. Lower mortgage rates are luring homebuyers who may have been on the fence, boosting optimism among developers and contributing to more construction.Single-family home starts increased 2% to 936,000 in October, the strongest reading since January, while permits for new construction of those dwellings climbed 3.2% to a 909,000 pace that was the fastest since August 2007.U.S. homebuilder sentiment ticked down in November after four consecutive months of gains, private data showed Monday as the outlook of builders in the South soured. The gauge remains elevated and optimism for sales over the next six months rose to the highest since May 2018. Groundbreakings for the multifamily category, which tends to be volatile and includes apartment buildings and condominiums, increased 8.6% while permits rose 8.2%. Data out later this week is forecast to show existing home sales, which make up the vast majority of home transactions in the U.S., increased in October from the prior month in a sign that the housing market continues apace. Also, new-home sales, which comprise about 10% of sales but are a timelier indicator, remained close to an almost 12-year high.

Three of four regions posted an increase in starts last month, led by a 17.6% surge in the West to the fastest pace since March 2018. Starts also rose in the Midwest and South. About 181,000 homes were authorized but not yet started, the most since March and indicating a growing backlog for builders.The report, produced jointly by the U.S. Census Bureau and the Department of Housing and Urban Development, has a wide margin of error.

read more…

bloomberg.com

Housing starts jump | South Salem Real Estate

Total housing starts posted a 12.3 percent increase in August (1.364 million units) compared to an upwardly revised July estimate of 1.215 million units, according to the joint data release from the Census Bureau and HUD. Relative to August 2018, total starts are 6.6 percent above the annual pace of 1.279 million units.

Single-family production in August posted a monthly increase of 4.4 percent to a seasonally adjusted annual rate of 919,000. Single-family starts in July were revised up to 880,000 units. The three-month moving average for single-family in August is 888,000 units.

On a year-to-date basis, single-family starts are 2.7 percent lower as of August relative to the first eight months of 2018. Single-family permits, a useful indicator of future construction activity, rose 4.5 percent in August (866,000 units) compared to July but have registered a 4.1 percent loss thus far in 2019 compared to last year.

Regional data show, on a year-to-date basis, positive conditions for single-family construction only in the South (+1.1 percent). Single-family construction is down 6.9 percent in the West, 4.8 percent in the Midwest, and 11.9 percent in the Northeast.

Multifamily starts (2+ unit production) registered an increase of 32.8 percent in August to a 445,000 annual rate compared to July. On a year-to-date basis, multifamily 5+ unit production is slightly up 0.4 percent thus far in 2019, while multifamily 5+ unit permitting is trending higher with an increase of 4.2 percent relative to the first eight months of 2018.

read more…

http://eyeonhousing.org/2019/09/housing-starts-rebounds-in-august/

Housing starts drop in May | North Salem Real Estate

aerial neighborhood houses

Housing starts reversed course in May, signaling a slowdown in production, according to the latest report from the U.S. Dept. of Housing and Urban Development and the U.S. Dept. of Commerce.

According to the analysis, housing starts fell 0.9% in May 2019 to a seasonally adjusted annual rate of 1.269 million units.

Navy Federal Credit Union Economist Robert Frick said another weak housing report shows the housing industry is far from producing homes at a rate to satisfy demand.

 “Housing starts in May were below both the annualized April rate and the rate from May a year ago, and housing completions in May were also below April’s rate and May 2018’s rate,” Frick said. “Permits rose strongly in May from April, which is good news, but were down from May of last year. Together the numbers show the housing industry continues to slip from last year.”

Single-family production retreated 6.4% from last month to 820,000 units while multifamily starts came in at a seasonally adjusted annual rate of 436,000 units.

Additionally, single-family completions decreased 5% in 2019 to a rate of 890,000, while multifamily starts came in at 319,000 units.

However, permits grew 0.3% in May to a seasonally adjusted annual rate of 1.29 million.  

Single-family authorizations increased 3.7% from last month’s rate to 815,000 permits and multifamily permits came in at an annualized rate of 442,000.

“At the current rate, the industry this year will build fewer than the 200,000 needed to keep up with population growth and demand,” Frick said. “Sub 4% mortgage rates should boost demand, but while the rate of home price increases is slowing, it is still rising, putting the dream of homeownership out of the reach of more Americans.”

“Given the restrictions of too little land zoned for housing, restrictive local building codes, and expensive labor and materials, home builders are hard-pressed to meet the growing demand for new homes,” Frick concluded.

read more…

Housing starts fall year over year | Katonah Real Estate

US Housing Starts Rise Above Forecast

Housing starts in the US rose 5.7 percent from a month earlier to a seasonally adjusted annual rate of 1,235 thousand units in April 2019, more than an expected 1,205 thousand and following a revised 1.7 percent advance in March. 

Single-family homebuilding, which accounts for the largest share of the housing market, rose 6.2 percent to a rate of 854 thousand units in April and starts for the volatile multi-family housing segment advanced 4.7 percent to a rate of 381 thousand units. Increases in housing starts were recorded in the Northeast (84.6 percent to 144 thousand) and Midwest (42 percent to 186 thousand), while declines were seen in the South (-5.7 percent to 581 thousand) and West (-5.5 percent to 324 thousand). Starts for March were revised to 1,168 thousand from 1,139 thousand.

Building permits were up 0.6 percent to a rate of 1,296 thousand units in April, while markets had expected a 0.5 percent gain. Permits for the volatile multi-family housing segment increased 8.9 percent to 514 thousand, while single-family authorizations fell 4.2 percent to 782 thousand. Across regions, permits were higher in the West (5.3 percent to 339 thousand) and Midwest (2.2 percent to 188 thousand), but dropped in the Northeast (-4 percent to 120 thousand) and South (-1.2 percent to 649 thousand).

Year-on-year, housing starts dropped 2.5 percent and building permits decreased 5 percent.

read more…

https://tradingeconomics.com/united-states/housing-starts

Housing starts fall | South Salem Real Estate

Total housing starts fell 8.7% in February to a seasonally adjusted annual rate of 1.16 million units from an upwardly revised reading in January, according to a report from the U.S. Housing and Urban Development and Commerce Department that was delayed due to the partial government shutdown.

The February reading of 1.16 million is the number of housing units builders would begin if they kept this pace for the next 12 months. Within this overall number, single-family starts fell 17% to 805,000 units following an unusually high reading of 970,000 units in January. Meanwhile, the multifamily sector, which includes apartment buildings and condos, increased 17.8% to 357,000.

“The overall lower starts numbers are somewhat deceiving given the revised single-family starts figure in January was at a post-recession high,” said Danushka Nanayakkara-Skillington, AVP for forecasting and analysis at the National Association of Home Builders (NAHB). “Absent the surge last month, the drop in single-family production in February is not as huge as it appears. Still, builders continue to remain cautious due to affordability concerns, as illustrated by the flat permits data.”

“The February starts figures are somewhat in line with flat builder expectations and serve as a cautionary note that affordability factors continue to affect the marketplace,” said Greg Ugalde, chairman of NAHB and a home builder and developer from Torrington, Conn. “Excessive regulations, a scarcity of buildable lots, persistent labor shortages and tariffs on lumber and other key building materials are having a negative effect on housing affordability.”

Regionally, combined single-family and multifamily starts in February fell 29.5% in the Northeast, 18.9% in the West and 6.8% in the South. Starts posted a 26.8% increase in the Midwest.

Overall permits, which are often a harbinger of future housing production, edged 1.6% lower in February to 1.30 million units. Single-family permits held steady at 821,000, while multifamily permits fell 4.2% to 475,000.

Looking at regional permit data, permits rose 1.5% in the Northeast, 4% in the South and 1.1% in the Midwest. Permits fell 15% in the West.

read more…

US Housing Starts Beat Forecasts | Mt Kisco Real Estate

Housing starts in the United States jumped 3.2 percent from a month earlier to an annualized rate of 1,256 thousand in November of 2018, beating market forecasts of a 0.2 percent drop. Starts went up in the Northeast and the South but slumped in the Midwest and the West. Housing Starts in the United States averaged 1432.19 Thousand units from 1959 until 2018, reaching an all time high of 2494 Thousand units in January of 1972 and a record low of 478 Thousand units in April of 2009.

United States Housing Starts

CalendarGMTActualPreviousConsensusTEForecast
2018-09-1912:30 PMHousing Starts1.282M1.174M1.235M1.171M
2018-10-1712:30 PMHousing Starts1.201M1.268M1.22M1.25M
2018-11-2001:30 PMHousing Starts1.228M1.21M1.23M1.22M
2018-12-1801:30 PMHousing Starts1.256M1.217M1.225M1.22M
2019-01-1701:30 PMHousing Starts1.256M1330
2019-02-2001:30 PMHousing Starts
2019-03-1912:30 PMHousing Starts


US Housing Starts Beat Forecasts

Housing starts in the United States jumped 3.2 percent from a month earlier to an annualized rate of 1,256 thousand in October of 2018, beating market forecasts of a 0.2 percent drop. Starts went up in the Northeast and the South but slumped in the Midwest and the West.

Starts for the volatile multi-family housing segment jumped 24.9 percent to a rate of 417 thousand. On the other hand, single-family homebuilding, which accounts for the largest share of the housing market, went down 4.6 percent to a rate of 824 thousand units, the third straight monthly fall and the the lowest level since May 2017. Starts increased in the South (15.1 percent to 687 thousand) and the Northeast (37.8 percent to 134 thousand) but fell in the West (-14.2 percent to 289 thousand) and the Midwest (-19.2 percent to 156 thousand). Starts for October were revised to 1,217 thousand from 1,228 thousand.
Building permits rose 5 percent from the previous month to a seasonally adjusted annual rate of 1,328 thousand, compared to market expectations of a 0.4 percent fall. Single-family authorizations edged up 0.1 percent to 848 thousand and multi-family permits advanced 14.8 percent to 480 thousand. Across regions, permits went up in the South (10.5 percent to 708 thousand) and the West (1.6 percent to 323 thousand) while in the Northeast permits were unchanged (at 120 thousand) and in the Midwest dropped (-4.8 percent to 177 thousand).
Year-on-year, housing starts fell 3.6 percent and building permits edged up 0.4 percent.
read more…
https://tradingeconomics.com/united-states/housing-starts

Housing starts up y-o-y | Bedford Hills Real Estate

Total housing starts posted a decline in September due to flat conditions for single-family construction and a pullback for apartment development. Total starts declined 5.3% in September but are 6.4% higher for 2018 on a year-to-date basis, according to the joint data release from the Census Bureau and HUD.

The pace of single-family starts was roughly flat in September, decreasing 0.9% to a seasonally adjusted annual rate of 871,000. Slight gains off the summer soft patch for single-family mirror a minor uptick of the NAHB/Wells Fargo Housing Market Index, now registering a score of 68. While builders are benefitting from recent declines in lumber prices (at least relative to spring and summer’s elevated levels), they continue to report concerns about labor access issues.

On a year-to-date basis, single-family starts are 6% higher as of September relative to the first nine months of 2017. Single-family permits, a useful indicator of future construction activity, were up slightly (2.9%) in September and have registered a 5.6% gain thus far in 2018 compared to last year.

Multifamily starts (2+ unit production) pulled back in September to a 330,000 annual rate. After a strong start to the year, multifamily development is moving closer to our forecast of leveling-off conditions. On a year-to-date basis, multifamily 5+ unit production is 7.3% higher thus far in 2018, while multifamily 5+ unit permitting is trending lower with just a 0.8% year-to-date increase relative to 2017.

With respect to housing’s economic impact, 54% of homes under construction in September were multifamily (607,000). The current count of apartments under construction is down slightly from a year ago. In September, there were 522,000 single-family units under construction, a gain of more than 9% from this time in 2017.

Regional data show – on a year-to-date basis – mixed conditions. Single-family construction is down 1% for the year in the Midwest and flat in the Northeast. Single-family starts are up in the larger building regions of the South (4.9%) and the West (14.6%).

read more…

http://eyeonhousing.org/2018/10/single-family-starts-flat-in-september

Housing starts analysis | Mt Kisco Real Estate

Comments on August Housing Starts


Earlier: Housing Starts Increased to 1.282 Million Annual Rate in August

Housing starts in August were above expectations,  and starts for June and July were revised up.  Most of the increase, and upward revisions, were due to the multi-family starts that are volatile month-to-month.

The housing starts report released this morning showed starts were up 9.2% in August compared to July (and August starts were revised up), and starts were up 9.4% year-over-year compared to August 2017.

Multi-family starts were down 38% year-over-year, and single family starts were down slightly year-over-year.

This first graph shows the month to month comparison for total starts between 2017 (blue) and 2018 (red).

image: https://1.bp.blogspot.com/-QB_1ld2C2zg/W6JFJO03NdI/AAAAAAAAwCw/oMfZl_MNKV4JQQ89VJQniVoY4Ye5wNn3wCLcBGAs/s320/Starts20172018Aug.PNG

Starts Housing 2017 and 2018Click on graph for larger image.

Starts were up 9.4% in August compared to August 2017.

Through eight months, starts are up 6.9% year-to-date compared to the same period in 2017.   That is a decent increase.

Note that 2017 finished strong, so the year-over-year comparisons will be more difficult in Q4.

Below is an update to the graph comparing multi-family starts and completions. Since it usually takes over a year on average to complete a multi-family project, there is a lag between multi-family starts and completions. Completions are important because that is new supply added to the market, and starts are important because that is future new supply (units under construction is also important for employment).

These graphs use a 12 month rolling total for NSA starts and completions.

image: https://4.bp.blogspot.com/-0xhVPfh9cYs/W6JIb4I3CSI/AAAAAAAAwC8/BEcLqA1gitQDc3A9Al4_nRmL5aFh0fUiwCLcBGAs/s320/MultiAug2018.PNG

Multifamily Starts and completionsThe blue line is for multifamily starts and the red line is for multifamily completions.

The rolling 12 month total for starts (blue line) increased steadily for several years following the great recession – but turned down, and has moved sideways recently.  Completions (red line) had lagged behind – however completions and starts are at about the same level now (more deliveries).

It is likely that both starts and completions, on rolling 12 months basis, will now move mostly sideways.

As I’ve been noting for a few years, the significant growth in multi-family starts is behind us – multi-family starts peaked in June 2015 (at 510 thousand SAAR).

image: https://4.bp.blogspot.com/-2POZ_G_0KLM/W6JIeSHjiXI/AAAAAAAAwDA/WqiMP6SJVeMzG5uNm7yh_15gaMoqvNRDACLcBGAs/s320/SingleAug2018.PNG

Single family Starts and completionsThe second graph shows single family starts and completions. It usually only takes about 6 months between starting a single family home and completion – so the lines are much closer. The blue line is for single family starts and the red line is for single family completions.

Note the relatively low level of single family starts and completions.  The “wide bottom” was what I was forecasting following the recession, and now I expect a couple more years, or more, of increasing single family starts and completions.

Note: Two months ago, in response to numerous articles discussing the “slowing housing market” and some suggesting “housing has peaked”, I wrote: Has Housing Market Activity Peaked? and Has the Housing Market Peaked? (Part 2). My view – that there will be further growth in housing starts – remains the same.

Read more at https://www.calculatedriskblog.com/#o2tyGm3q82iFADMX.99

Housing starts up 9.4% year over year | Waccabuc Real Estate

United States Housing Starts  1959-2018 

Housing starts in the US jumped 9.2 percent from a month earlier to an annualized rate of 1,282 thousand in August of 2018, recovering  from a 0.3 percent drop in July and beating market expectations of a 5.8 percent rise. Starts increased in the South, the Midwest and the West and were flat in the Northeast. Housing Starts in the United States averaged 1433.04 Thousand units from 1959 until 2018, reaching an all time high of 2494 Thousand units in January of 1972 and a record low of 478 Thousand units in April of 2009.


United States Housing Starts


US Housing Starts Above Forecasts

Housing starts in the US jumped 9.2 percent from a month earlier to an annualized rate of 1,282 thousand in August of 2018, recovering from a 0.3 percent drop in July and beating market expectations of a 5.8 percent rise. Starts increased in the South, the Midwest and the West and were flat in the Northeast.

Single-family homebuilding, which accounts for the largest share of the housing market, increased 1.9 percent to a rate of 876 thousand units in August; and starts for the volatile multi-family housing segment surged 27.3 percent to a rate of 392 thousand. Starts rose in the Midwest (9.1 percent to 191 thousand), the West (19.1 percent to 318 thousand) and the South (6.5 percent to 674 thousand), but were steady in the Northeast (at 99 thousand). Starts for July were revised to 1,174 thousand from 1,168 thousand.
Building permits dropped 5.7 percent to a seasonally adjusted annual rate of 1,229 thousand, the lowest reading since May of 2017. It compares with market expectations of a 0.1 percent decline to 1,310 thousand and follows a 1.5 percent rise in July. Single-family authorizations fell 6.1 percent to 820 thousand and multi-family permits decreased 4.9 percent to 409 thousand. Declines were seen in all regions: Northeast (-19.2 percent to 101 thousand), the Midwest (-1.7 percent to 178 thousand), the West (-8.4 percent to 304 thousand) and the South (-2.9 percent to 646 thousand).

Year-on-year, housing starts increased 9.4 percent while building permits fell 5.5 percent.

read more…
https://tradingeconomics.com/united-states/housing-starts