Tag Archives: Mt Kisco NY Realtor

Strong house price rises continue in Europe and parts of Asia | Mt Kisco Real Estate

During the year to Q2 2018:

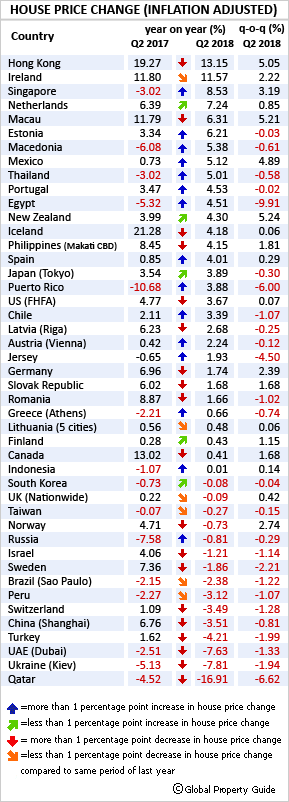
  • House prices rose in 25 out of the 39 world’s housing markets which have so far published housing statistics, using inflation-adjusted figures.
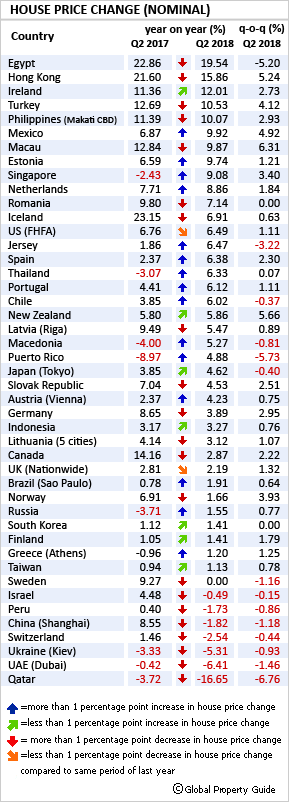
  • The more upbeat nominal figures, more familiar to the public, showed house price rises in 32 countries. House prices fell in only 6 countries and remained stable in 1 country.

Most of Europe continues to experience strong price rises, especially Ireland and the Netherlands.  In Asia Hong Kong and Macau have risen strongly over the past year. There have also been notable turnarounds in Thailand, Egypt, and Puerto Rico. But China, Ukraine, and most of the Middle East are experiencing either house price falls – or a sharp deceleration of house price rises

The strongest housing markets in our global house price survey during the year to Q2 2018 included: Hong Kong (+13.15%), Ireland (+11.57%), Netherlands (+7.24%), Macau (+6.31%), and Mexico (+5.12%) using inflation-adjusted figures.

The biggest y-o-y house-price declines were in Qatar (-16.91%), Kiev, Ukraine (-7.81%), Dubai, UAE (-7.63%), Turkey (-4.21%), and Shanghai, China (-3.51%), again using inflation-adjusted figures.


Momentum. Only 16 of the world’s housing markets for which figures are available showed stronger upward momentum during the year to Q2 2018, while 23 housing markets showed weaker momentum, according to Global Property Guide’s research. Momentum is a measure of the “change in the change”; simply put, momentum has increased if a property market has risen faster this year than last (or fallen less).

Inflation-adjusted figures are used throughout this survey. In the case of Kiev, Ukraine, the Global Property Guide adjusts using the official U.S. inflation rate since Ukrainian secondary market dwelling sales are denominated in U.S. dollars.

The strongest performing markets:

Hong Kong is now the strongest housing market in our global survey, up from fourth place in the previous quarter. Residential property prices surged 13.15% during the year to Q2 2018, after y-o-y rises of 12.28% in Q1 2018, 12.78% in Q4 2017, 13.41% in Q3 2017 and 19.27% in Q2 2017. Quarter-on-quarter, house prices increased 5.05% in Q2 2018.

The boom continues despite stamp duties being raised for all non-first time homebuyers (November 2016) and allowable loans on residential and commercial properties being cut in May 2017. In addition, Chief Executive Carrie Lam revealed in June 2018 another series of cooling measures, including a tax against vacant flats.

Ireland‘s economy grew by 7.8% last year. It is not surprising that the housing market is growing at breakneck speed. Residential property prices were up by 11.57% during the year to Q2 2018, after y-o-y rises of 12.4% in Q1 2018, 11.7% in Q4 2017, 11.75% in Q3 2017, and 11.8% in Q2 2017. During the latest quarter, Irish house prices increased 2.22%. Ireland’s surging house prices are being driven by strong demand and supply shortages..

The Netherlands‘ housing market continues to perform very well, mainly due to robust demand, coupled with inadequate housing supply. The average purchase price of all dwellings rose by 7.24% during the year to Q2 2018, slightly up from the previous year’s 6.39% growth. On a quarterly basis, house prices were up 0.85% during the latest quarter.

During 2017, home sales surged 13% from a year ago. However in the first seven months of 2018, home sales dropped more than 7% from a year earlier due to supply shortages.

Macau’s housing market remains strong. The average transaction price of residential units rose by 6.31% during the year to Q2 2018, following y-o-y rises of 4.22% in Q1 2018, 4.93% in Q4 2017, 9.59% in Q3 2017 and 11.79% in Q2 2017. House prices increased by 5.21% q-o-q during the latest quarter. Macau’s housing market is buoyed by massive infrastructure investments, which will transform Macau’s connections to China and Hong Kong.

Mexico‘s housing market is strengthening, amidst improving economic conditions. The nationwide house price index rising by 5.12% during the year to Q2 2018, up from a y-o-y growth of just 0.73% in Q2 2017. On a quarterly basis, house prices increased 4.89% during the latest quarter.


THE REGIONS:

Most Europe remains vibrant

European house price rises continue unabated. House prices have risen over the past year in no less than 13 of the 20 European housing markets for which figures were available.

Ireland remains the best performer in Europe, buoyed by its very strong economy. Residential property prices were up by 11.57% during the year to Q2 2018, after y-o-y rises of 12.4% in Q1 2018, 11.7% in Q4 2017, 11.75% in Q3 2017, and 11.8% in Q2 2017. During the latest quarter, Irish house prices increased 2.22%. Ireland’s surging house prices are mainly driven by strong demand as well as supply shortages. The Irish economy grew by around 7.8% last year and is projected to expand by another 5.6% this year, according to the European Commission.

The Netherlands‘ housing market remains strong, mainly due to robust demand, coupled with lack of adequate housing supply in the market. The average purchase price of all dwellings rose by 7.24% during the year to Q2 2018, slightly up from the previous year’s 6.39% growth. On a quarterly basis, house prices were up 0.85% during the latest quarter. During 2017, home sales surged 13% from a year ago, fuelled by low interest rates and robust economic growth. In the first seven months of 2018, home sales dropped more than 7% from a year earlier to 124,615 units, according to Statistics Netherlands. The Dutch economy grew by 3.1% in 2017, the highest growth since 2007. GDP is expected to grow by another 3.2% this year and by 2.4% in 2019, according to the IMF.

Portugal’s housing prices continue to rise strongly, fuelled by surging demand as well as improved economic conditions. Nationwide property prices rose by 4.53% during the year to Q2 2018, from y-o-y rises of 4.7% in Q1 2018, 3.03% in Q4 2017, 4.04% in Q3 2017 and 3.47% in Q2 2017. During the latest quarter, house prices were almost stable.

After more than three years of depression, house prices in Portugal started to recover in 2014. The Portuguese economy is expected to expand by 2.4% this year, after GDP growth of 2.7% in 2017, 1.6% in 2016, 1.8% in 2015, and 0.9% in 2014.

Other strong European housing markets included Iceland, with house prices rising by 4.18% during the year to Q2 2018, Spain (4.01%), and Riga, Latvia (2.68%). All, expect Latvia, recorded positive quarterly growth during the latest quarter. In terms of momentum, only Spain had stronger performance in Q2 2018 compared to a year earlier.

Minimal annual house price rises during the year to Q2 2018 were registered in Jersey (1.93%), Germany (1.74%), Slovak Republic (1.68%), Romania (1.66%), Athens, Greece (0.66%), Lithuania (0.48%) and Finland (0.43%). Only Germany, Slovak Republic, Finland and Lithuania saw quarterly growth during the latest quarter. On the other hand, only Jersey, Greece and Finland performed better in Q2 2018 compared to the previous year.

Other strong European housing markets included Jersey, with house prices rising by 8.91% during the year to Q1 2018, Macedonia (6.1%), Riga, Latvia (5.72%), Romania (4.71%), Portugal (4.7%), Germany (4.19%), and Estonia (3.72%). All recorded positive quarterly growth during the latest quarter. In terms of momentum, only Macedonia, Latvia, Portugal and Jersey had stronger performances in Q1 2018 compared to a year earlier.

Modest to very minimal annual house price rises during the year to Q1 2018 were registered in Sweden (2.97%), Slovak Republic (2.41%), Spain (2.37%), Vienna, Austria (1.68%), Finland (0.29%), and Lithuania (0.1%). Only Slovak Republic, Spain, and Austria saw quarterly growth during the latest quarter. On the other hand, only Spain, Austria and Finland performed better in Q1 2018 compared to the previous year.

The U.K.’s house prices were unchanged during the year to Q1 2018. London was the worst-performing region, with house prices falling by 3.4% y-o-y in Q1 2018. Some high-end London districts have experienced significant price-falls.


Europe’s weakest housing markets

Ukraine‘s housing market remains depressed, despite improved economic conditions. Secondary market apartment prices in Kiev fell by 7.81% (inflation-adjusted) during the year to Q2 2018, to an average price of US$ 1,071 per square metre (sq. m.) – worse than the previous year’s 5.13% decline. House prices fell 1.94% quarter-on-quarter in Q2 2018.

House prices in Ukraine have been falling over the past five years, particularly in 2014 (with prices plunging 37.38%) because of hryvnia devaluation due to the Russian war. Ukraine’s economy is expected to expand by 3.2% this year, after expansions of 2.5% in 2017 and 2.4% in 2016, and contractions of 9.8% in 2015, 6.6% in 2014 and 0.03% in 2013.

Turkey’s housing market continues to weaken, amidst its plummeting currency (the lira), record-high inflation, and the country’s political conflict with the US. Nationwide residential property prices fell by 4.21% during the year to Q2 2018, in contrast with a 1.62 y-o-y rise in a year earlier – the fourth consecutive quarter of y-o-y price declines. On a quarterly basis, house prices dropped 1.99% during the latest quarter.

In June 2018, inflation rose to 15.39%, the highest level since 2004. The Turkish lira plunged to record lows, having shed more than 40% of its value against the US dollar in the past year. The government recently cut its 2018 GDP growth forecast to 3% – 4% from its earlier estimate of 5%.

Switzerland’s house prices fell 3.49% y-o-y in Q2 2018, the fourth consecutive quarter of annual price declines and the biggest fall in almost two decades. During the latest quarter, prices fell by 1.28% q-o-q.

After about 15 years of uninterrupted house price rises, the Swiss government’s efforts to cool the country’s overheated property market have finally succeeded. The Swiss economy is expected to expand by 2.3% this year and by another 2% in 2019, following annual growth of 1.1% in 2017, 1.4% in 2016, 1.2% in 2015 and 2.5% in 2014, according to the IMF.

Other weak European housing markets included Sweden, with house prices falling by 1.86% during the year to Q2 2018, Russia(-0.81%), Norway (-0.73%), and the UK (-0.09%). Only Norway and the UK saw quarterly growth during the latest quarter. All, except Russia, performed better in Q2 2018 compared to the previous year.


The Asia-Pacific region remains strong, but China slowing rapidly

Two of the five strongest housing markets in our global survey are in Asia-Pacific, with house prices rising in 6 of the 9 housing markets for which figures were available during the year to Q2 2018.

Hong Kong‘s housing market continues to boom, with residential property prices surging 13.15% during the year to Q2 2018, from y-o-y rises of 12.28% in Q1 2018, 12.78% in Q4 2017, 13.41% in Q3 2017, and 19.27% in Q2 2017. Quarter-on-quarter, house prices increased 5.05% in Q2 2018.

The latest house price rises come despite the government raising stamp duties for all non-first time homebuyers starting November 2016 and cutting allowable loans on residential and commercial properties in May 2017. In June 2018, Chief Executive Carrie Lam revealed another series of cooling measures, including a tax against vacant flats. In the first half of 2018, the total number of property transactions in Hong Kong increased 5.6% from a year earlier while sales values rose by 8.4%, according to the Ratings and Valuation Department (RVD). The economy expanded by 3.8% last year, the highest growth since 2011. The IMF recently raised its 2018 growth forecast for Hong Kong to 3.6%, up from its earlier estimate of 2.6%.

Macau’s housing market remains vibrant, amidst massive infrastructure investments, which will transform Macau’s connections to China and Hong Kong. The average transaction price of residential units rose by 6.31% during the year to Q2 2018, following y-o-y rises of 4.22% in Q1 2018, 4.93% in Q4 2017, 9.59% in Q3 2017 and 11.79% in Q2 2017. House prices increased strongly by 5.21% q-o-q during the latest quarter.

Macau’s economy grew by a spectacular 9.3% in 2017, a sharp turnaround from y-o-y declines of 0.9% in 2016, 21.6% in 2015, and 1.2% in 2014. Macau’s economy is expected to grow by 7% this year and by another 6.1% in 2019, according to the IMF.

Thailand’s housing market is rising strongly again, with nationwide house prices rising by 5.01% during the year to Q2 2018, in contrast to a y-o-y decline of 3.02% in the previous year. House prices fell slightly by 0.58% q-o-q in Q2 2018. During the first five months of 2018, nationwide land and building transactions rose by 3.2% y-o-y to THB 425.74 billion (US$ 13.1 billion). The Bank of Thailand recently raised its 2018 economic growth forecast for the fifth time to 4.4% from its earlier projection of 4.1% due to rising exports and strong private consumption.

Other Asia-Pacific housing markets with modest house price rises include New Zealand, with house prices rising by 4.3% during the year to Q2 2018, Tokyo, Japan (3.89%), and Indonesia (0.01%). All, except Japan, recorded positive quarterly growth during the latest quarter. In addition, all showed stronger upward momentum in Q2 2018 as compared to the previous year.

Sharp housing slowdown China

China’s housing market is now slowing, with new regulatory and monetary policies impacting developers and speculative buyers. In Shanghai, the price index of second-hand houses fell by 3.51% during the year to Q2 2018, in sharp contrast with a y-o-y rise of 6.76 in Q2 2017. During the latest quarter, house prices in Shanghai fell by 0.81%.

Despite this, the Chinese economy grew by 6.7% y-o-y in Q2 2018, only slightly lower than the 6.8% growth recorded the previous quarter. The economy is projected to expand by 6.6% this year, after expanding 6.9% in 2017 and 6.7% in 2016. China has achieved 27 straight years of above 6% growth.

Taiwan‘s housing market is still weak. Nationwide house prices fell by 0.27% during the year to Q2 2018, compared to a decline of 0.07% y-o-y in Q2 2017. Quarter-on-quarter, house prices fell by 0.15% in during the latest quarter.

South Korea‘s housing market is also fragile, with the nationwide housing purchase price index falling by 0.08% during the year to Q2 2018, from a y-o-y decline of 0.73% a year earlier. House prices dropped 0.04% q-o-q during the latest quarter.


Middle Eastern housing markets continue to struggle, but Egypt is an exception

The Middle East is now in the doldrums, with two of the three weakest housing markets in our global house price survey: Qatar and UAE. This is not surprising given the region’s ailing economy due to low oil prices and the ongoing political and diplomatic crisis. The Middle East’s economy grew by just 1.1% in 2017, the lowest level in eight years.

Qatar remains the weakest housing market in our global survey, amidst a sharp economic slowdown and the adverse impact of the blockade it is suffering from other Golf countries.

Qatar’s real estate price index dropped 16.91% during the year to Q2 2018, after y-o-y declines of 9.65% in Q1 2018, 10.42% in Q4 2017, 3.47% in Q3 2017, and 4.52% in Q2 2017. Property prices fell by 6.62% q-o-q during the latest quarter. The Qatari economy is expected to grow by a modest 2.6% this year, after annual average growth of 2.1% in 2016-17, 4.2% during 2012-15, and 15.7% in 2008-11.

Other Middle Eastern housing markets are also depressed.

In Dubai, residential property prices fell 7.63% during the year to Q2 2018, worse than the prior year’s 2.51% decline, amidst weak economic growth, low investor sentiment, and an oversupply of housing. During the latest quarter, house prices in Dubai dropped 1.33% q-o-q.

Likewise, Israel‘s decade-long house price boom is now over, with government cooling measures intensifying. The nationwide average price of owner-occupied dwellings fell by 1.21% during the year to Q2 2018, in sharp contrast with the previous year’s 4.06% growth. Israeli house prices fell  1.14% q-o-q in Q2 2018.

Egypt is an exception

Egypt’s housing market has risen over the past year, with the nationwide real estate index rising by 4.51% during the year to Q2 2018, in contrast with the y-o-y decline of 5.32% during the previous year. However house prices fell 9.91% quarter-on-quarter during the latest quarter.

Rapid house price rises should be expected in Egypt due to the dramatic inflation unleashed by more-than-halving of the currency’s value in November 2016.  That house prices have not risen more is surprising.

President Abdel Fattah el-Sisi recently removed the last restrictions on foreign ownership of land and property in Egypt. He also allowed the government, the biggest landowner in Egypt, to use its land for public-private partnership schemes. The economy is expected to grow strongly by 5.2% this year, the fastest pace in a decade, according to the IMF.


The Americas are mixed

The U.S. remains strong but Canada is slowing sharply.

In Latin America, Mexico is strengthening while Chile has rebounded strongly. House prices are still falling in Brazil, despite some improvement.

After five years of strong house price growth, the U.S. housing market remains surprisingly vibrant. The Federal Housing Finance Agency’s seasonally-adjusted purchase-only U.S. house price index increased 3.67% y-o-y in Q2 2018 (inflation-adjusted), after annual rises of 4.93% in Q1 2018, 4.64% in Q4 2017, 4.68% in Q3 2017 and 4.77% in Q2 2017. The FHFA index rose by 0.07% q-o-q during the latest quarter.

U.S. housing demand and construction activity are mixed. In July 2018, sales of new single-family houses rose by 12.8% y-o-y while existing home sales were down by 1.5%. Building permits authorized for new housing units rose by 4.2% in July 2018 from a year earlier. On the other hand, new housing starts fell by 1.4% y-o-y in July 2018, while completions were slightly down by 0.8%.

The world’s biggest economy grew by 4.1% y-o-y in Q2 2018, nearly double the 2.2% growth the previous quarter and the fastest pace since Q3 2014. Growth was mainly driven by consumers spending their tax cuts and exporters rushing to get their goods delivered ahead of retaliatory tariffs. Recently, the IMF raised its 2018 US growth forecast from 2.3% to 2.7% and finally to 2.9%, an acceleration from the expansions of 2.3% in 2017 and 1.5% in 2016.

In December 2017, President Donald Trump signed a landmark tax law (known as the Tax Cuts and Jobs Act or TCJA) considered to be the largest overhaul of the U.S. tax code in over 30 years.

Canada‘s housing market is slowing sharply, amidst the introduction of more market-cooling measures and rising mortgage interest rates. House prices in the country’s eleven major cities rose by a meagre 0.41% during the year to Q2 2018, a sharp deceleration from last year’s 13.02% growth. Quarter-on-quarter, house prices increased 1.68% q-o-q in Q2 2018.

The Canadian Real Estate Association (CREA) expects home sales to fall by 11% this year, mainly due to higher home prices and interest rates, supply shortages, and heightened uncertainty. Demand is weak. In July 2018, actual sales activity dropped 1.3% from a year earlier.  The Canadian economy grew by a healthy 3% in 2017, the highest growth since 2011. The economy is expected to expand by 2.1% this year and by another 2% in 2019.


The Latin Americas are improving

Mexico‘s nationwide house price index rose by 5.12% during the year to Q2 2018, up from just 0.73% y-o-y house price rises in Q2 2017. House prices increased 4.89% q-o-q during the latest quarter.

Chile‘s housing market continues to grow stronger, despite the introduction of a property sales tax in 2016. The average price of new apartments in Greater Santiago rose by 3.39% during the year to Q2 2018, up from the previous year’s 2.11% y-o-y growth. House prices fell by 1.07% q-o-q in Q2 2018.

Brazil’s house prices are still falling, but the outlook is now positive, amidst increasing construction and home sales, as well as a positive economic outlook. In Sao Paulo, house prices fell by 2.38% during the year to Q2 2018, after a y-o-y decline of 2.15% a year earlier. Quarter-on-quarter, house prices in Sao Paulo fell by 1.22% in Q2 2018.


read more…


http://www.globalpropertyguide.com

Rental Apartment Absorption Flat While Condominium Absorption Jumps | Mt Kisco Real Estate

The US Census Bureau, in collaboration with the US Department of Housing and Urban Development, releases data on completions and absorption rates for multifamily buildings with at least 5 apartments. The most recent release shows that completions of nonsubsidized, unfurnished, rental apartments amounted to 73,800 in the third quarter of 2016. This is 11,700 more than the second quarter of 2016, but 9,800 fewer than the third quarter of 2015 (Figure 1).

The absorption rate (apartments rented within 3 months of completion) for rental apartments completed in the third quarter of 2016 stood at 61 percent. This is 4 percentage points higher than the second quarter of 2016 (57 percent), but essentially unchanged compared to the rate from the third quarter of 2015 (60 percent) (Figure 1).

The release also revealed that the median asking rent of apartments completed in the third quarter of 2016 was $1,507. This is a significant increase compared to the median asking rent from the third quarter of 2015: $1,346.

In the third quarter of 2016, condominium completions rose considerably to 6,100, which is 2,800 units more than in the second quarter of 2016 and 1,800 higher than completions in the third quarter of 2015. The condominium absorption rate also posted an increase to 74 percent, which is 10 percentage points higher than the second quarter of 2016 and 23 percentage points higher compared to the third quarter of 2015 (Figure 2).

Figure 3 displays subsidized and tax credit unit completions as a share of total apartment completions. In the third quarter of 2016, subsidized or tax credit units represented approximately 6 percent (5,200 units) of total apartment completions. This is about the same share seen in the second quarter of 2016 (7 percent). It important to note that starting in 2010, the share of these units completed surged, but started to decrease significantly starting in 2014.


read more…


http://eyeonhousing.org/2017/03/rental-apartment-absorption-flat-while-condominium-absorption-jumps/

Home Affordability Improves | Mt Kisco Real Estate

Buying a home was at the most affordable level in two years in the first quarter of 2015, according to a recent report jointly released by RealtyTrac® and Clear Capital, which shows that home­buying is becoming more affordable, despite the average U.S. home price increasing at more than twice the pace of the average weekly wage nationwide over the past year.

“Although home prices continue to outpace wage growth in the majority of local markets, this analysis somewhat surprisingly shows that affordability is actually improving in most markets thanks to falling interest rates and slowing home price growth, which is allowing wage growth to catch up in some markets,” says Daren Blomquist, vice president at RealtyTrac.

“At the national level, buying an average­priced home in the first quarter of 2015 was the most affordable it’s been in two years and nearly twice as affordable as it was in the second quarter of 2006—when affordability was its worst in the past 10 years.

At the local level, we’re seeing several bellwether markets where wage growth matched or even outpaced home price growth over the past year.” For the report, RealtyTrac analyzed recently released Q1 2015 average weekly wage data from the Bureau of Labor Statistics and average prices for single­family homes and condos derived from publicly recorded sales deed data collected by RealtyTrac in 582 U.S. counties with sufficient home price data.

Average interest rates on a 30­year fixed rate mortgage came from the Freddie Mac Primary Mortgage Market Survey. Clear Capital analyzed data from its Home Data Index to determine counties at highest risk and lowest risk based on affordability and potential for price growth.

Average home price appreciation outpaced average wage growth between the first quarter of 2014 and the first quarter of 2015 in 397 out of 582 (68 percent) U.S. counties analyzed for the report. But during the same time period, the average interest rate on a 30­year fixed rate mortgage dropped 57 basis points (13 percent), from 4.34 percent in the first quarter of 2014 to 3.77 percent in the first quarter of 2015.

The drop in interest rates—along with wage growth outpacing home price appreciation in 32 percent of counties—meant buying a home in the first quarter of 2015 required a smaller share of the average wage compared to a year ago in 339 of the 582 counties (58 percent).

Counties where wage growth outpaced home price growth Major markets where wage growth outpaced home price growth in the first quarter— counter to the national trend—included Cook County, Ill., in the Chicago metro area; Orange County, Calif., in the Los Angeles metro area; Brooklyn, N.Y.; Fairfax County, Va., in the Washington, D.C., metro area; and Riverside County in Southern Calif., where the average weekly wage in the first quarter was up 10 percent from a year ago, double the 5 percent growth in average home prices during the same time period.

Buying a home 48 percent more affordable than during 2006 housing bubble Assuming a 3 percent down payment, monthly payments on an average­priced U.S. home —including property taxes, home insurance and private mortgage insurance (PMI)— required 36.5 percent of the average wage nationwide in the first quarter of 2015, down from 37.6 percent in the previous quarter and down from 37.4 percent in the first quarter of 2014 to the most affordable level since the first quarter of 2013, when affordability was 33.5 percent.

Buying a home nationwide was at the most affordable level in the last 10 years in the first quarter of 2012, when monthly house payments required 32 percent of average wages, while buying a home nationwide was at the least affordable level in the last 10 years in the second quarter of 2006, when monthly house payments required 70.7 percent of average wages.

Home price growth outpacing wage growth 3 to 1 during housing recovery Since bottoming out in the first quarter of 2012, the average U.S. home price has risen 24 percent while the average weekly wage nationwide has risen 7 percent during the same time period. The average interest rate on a 30­year fixed rate mortgage has dropped 5 percent.


read more…


http://rismedia.com/2015-10-01/


Americans still reluctant to ramp up mortgage borrowing | Mt Kisco Real Estate

Americans are buying more homes and at higher prices, yet new data shows that mortgage debt is little changed.

The Federal Reserve Bank of New York said Thursday that outstanding U.S. mortgage debt slipped 0.7 percent in the April-June quarter to $8.12 trillion. That is up slightly from a year ago and about the same level as three years ago when the housing market bottomed.

The second quarter’s decline occurred even as Americans took out more new mortgages, either to refinance old loans or purchase homes. New mortgages totaled $466 billion in the second quarter, the most in almost two years.

Those trends suggest Americans are paying down mortgage debt at roughly the same pace as new loans are made, evidence that homeowners remain wary of housing-related debt. Total mortgage debt peaked at $9.29 trillion in the third quarter of 2008.

Overall, the New York Fed’s report indicates that there is little sign of a return to bubble-era excesses in mortgage financing, even as the housing market rebounds. Would-be buyers are bidding up prices on a scarce supply of available homes. Sales of existing houses climbed to an eight-year high in June.

And home prices rose nearly 5 percent in May from a year earlier, according to the S&P/Case-Shiller 20-city index. They jumped 10 percent in Denver, 9.7 percent in San Francisco and 8.4 percent in Dallas — big increases that are making homeownership increasingly unaffordable for the typical family.

Yet there are many signs in the New York Fed’s report that housing finance is much healthier than before the recession. Just 95,000 people received new foreclosure notices in the second quarter, the fewest in the 16-year history of the data. And total

And in another sign of caution, total borrowing on home-equity lines of credit fell $11 billion in the second quarter, to $499 billion. That’s far below the peak of $714 billion six years ago.

The amount of new mortgages has risen for four straight quarters, the New York Fed said, after falling to a 14-year low of $286 billion in last year’s second quarter.

Several trends have offset those increases to keep overall mortgage debt mostly unchanged, according to economists at the New York Fed. A wave of refinancing has lowered borrowing rates, allowing homeowners to pay down more principal each month and less interest. Many homebuyers are making larger down payments. And the proportion of investors and other buyers paying cash has been elevated for most of the economic recovery.


read more…


http://finance.yahoo.com/news/us-mortgage-debt-little-changed-150050678.html

Cash Sales Fall to Six Year Low; Distressed Sales Plummet | Mt Kisco Real Estate

Only one out of four single family home and condo sales in May–24.6 percent–were all-cash purchases, down from 30.4 percent a year ago to the lowest level since November 2009. Distress sales also fell to a new low of 10.5 percent of all sales in May, down from 18.3 percent a year ago to the lowest level since January 2011, according to RealtyTrac.

The cash sales share in May was close to its long-term average going back to January 2000 of 24.8 percent and well below its recent peak of 42.2 percent in February 2011. The top five metro areas with a population of at least 200,000 with the highest share of cash buyers were all in Florida: Naples-Marco Island (56.0 percent), Sarasota-Bradenton, (54.0 percent), Miami (53.4 percent), Ocala (49.9 percent), and Cape Coral-Fort Myers (49.7 percent).


RT Cash sales

Meanwhile, the median sales price of a distressed residential property was 43 percent below the median sales price of a non-distressed residential property in May, the biggest distressed discount since January 2006 when RealtyTrac first began tracking this metric.

The median sales price of distressed residential properties — those that were in some stage of foreclosure or bank-owned — that sold in May was $116,192, up less than 1 percent from the previous month but down 2 percent from a year ago. May was the first month with a year-over-year decrease in distressed median sale prices following 13 consecutive months with year-over-year increases.

“Distressed sales in May represented a significantly smaller share of a growing home sales pie as an increasing number of non-distressed sellers continued to cash out on the equity they’ve gained over the last three years of rising home prices,” said Daren Blomquist, vice president at RealtyTrac. “But those distressed sales are still acting as a drag on home prices, selling at a median price that is 43 percent below the median price of a non-distressed sale — the biggest gap we’ve seen since we began tracking that distressed discount in January 2006.

Metro areas with a population of at least 200,000 with the highest share of distressed sales were Flint, Michigan (26.0 percent), Tallahassee, Florida (24.2 percent), Memphis, Tennessee (24.1 percent), Pensacola, Florida (23.0 percent), and Ocala, Florida (21.7 percent).

Markets with highest share of cash sales and institutional investor sales

The share of institutional investors — entities purchasing at least 10 properties in a calendar year — dropped to 2.4 percent of single family home sales in May, a record low going back to January 2000, the earliest month with data available.

The top five metro areas with a population of at least 200,000 with the highest share of cash buyers were all in Florida: Naples-Marco Island (56.0 percent), Sarasota-Bradenton, (54.0 percent), Miami (53.4 percent), Ocala (49.9 percent), and Cape Coral-Fort Myers (49.7 percent).

The top five metro areas with a population of at least 200,000 with the highest share of institutional investor purchases were Rockford, Illinois (13.4 percent), Tulsa, Oklahoma (12.6 percent), Roanoke, Virginia (12.6 percent), Memphis, Tennessee (10.2 percent), and San Antonio, Texas (8.4 percent).

Bank-owned sales

Bank-owned sales accounted for 3.9 percent of all residential property sales in May, down from 6.9 percent the previous month and down from 9.0 percent a year ago to the lowest level since January 2011.


read more…


http://www.realestateeconomywatch.com/2015/07/


GDP Growth in the First Quarter – Stormy Weather? | Mt Kisco Real Estate

The Bureau of Economic Analysis (BEA) reported real GDP grew at a seasonally adjusted annual rate of 0.2% in the first quarter of 2015. Real GDP grew at an annual rate of 2.2% in the fourth quarter of 2014. The slowdown in economic growth was expected but the extent of the slowdown was a surprise. Harsh weather, a strong dollar, stalled trade at west coast ports and falling energy prices all played a role. In the same report the BEA reported that the price index tracking components of GDP, the broadest measure of price movements across the economy, declined by an annualized rate of 0.1% in the first quarter, after rising only 0.1% in the fourth quarter.

A strong dollar and stalled trade combined to shrink exports by an annual rate of 7.2% shaving almost a full percentage point from growth, but the stalled trade likely restrained imports given the rise in the value of the dollar, which would have depressed growth further. The trade dispute has been resolved, but the strong dollar is likely to persist and be a drag on growth in the near term.

Record low temperatures around the country in February can be considered a one-off event with little impact on growth going forward, but falling energy prices have put the brakes on a previously booming energy sector and contributed to an annualized 23.1% decline in the structures component of fixed investment. Investment in equipment, intellectual property and housing (residential fixed investment) all contributed to growth in total fixed investment, but less than in the previous quarter.

Inventory investment increased when it probably should have declined, adding nearly three quarters of a percentage point to growth in the current quarter, but will likely subtract from growth in the next quarter as payback. Personal consumption expenditures (PCE) slowed to 1.9% growth from an unsustainable 4.4% last quarter but will need to reaccelerate if the overall growth outlook is to improve.


read more…


http://eyeonhousing.org/2015/04/gdp-growth-in-the-first-quarter-stormy-weather/

Consumer Credit Expands on Auto, Student Loans | Mt Kisco Real Estate

The Federal Reserve Board recently reported that consumer credit outstanding rose by a seasonally adjusted annual rate of 4.2%, $138.7 billion, in January 2015. Consumer credit outstanding now totals $3.3 trillion.

The expansion of total consumer credit outstanding reflected an increase in the outstanding amount of non-revolving consumer credit. Non-revolving consumer credit includes auto loans and student loans. According to the report, non-revolving credit outstanding grew by a seasonally adjusted annual rate of 6.3%, $152.7 billion, in January 2015, 0.5 percentage points faster than the 5.8%, $140.2 billion, growth recorded in December 2014. There is now $2.4 trillion in outstanding non-revolving credit, 73.3% of the total amount of consumer credit outstanding.

The growth in non-revolving credit was partially offset by a contraction in the outstanding amount of revolving credit. Revolving credit outstanding is largely composed of consumer credit card debt. After recording an increase of 8.4%, $74.2 billion, in December 2014, revolving credit outstanding registered a 1.6% decrease, -$13.9 billion, in January 2015. As of January 2015, revolving credit outstanding totals $0.9 trillion, 26.7% of total consumer credit outstanding.

Presentation1

A previous post illustrated that depository institutions are the largest holders of outstanding consumer credit. According to data from the Federal Deposit Insurance Corporation (FDIC), which collects banking statistics from depository institutions as part of its responsibility to guarantee the safety of depositor’s accounts, the growth in the amount of loans to individuals, which includes credit cards, other revolving credit plans, automobile loans, and other loans to individuals, but excludes loans to individuals that are secured by real estate, has been accelerating since 2012. As a result, the gap between growth in outstanding loans to individuals and growth in total net lending has converged.

According to Figure 2, loans to individuals made by depository institutions fell by 2.9% in 2009, but total net loans and leases fell by 8.4% indicating that the contraction in loans to individuals was not as severe as other lending made by depository institutions in 2009. Total net loans and leases is equal to the total amount of loans and leases less the reserve for debts gone bad. In 2010, loans to individuals rose by 24.4% while total net loans and leases grew by 1.3%, indicating that growth in loans to individuals exceeded the growth of total net loans and leases. However, the 2010 increase in consumer lending of 24.4% reflects financial institutions’ implementation of the FAS 166/167 accounting rules which moved loans from pools of securitized assets to the balance sheets of lenders. Since 2011, the gap between the growth in loans to individuals and total net loans and leases has closed as growth in loans to individuals has accelerated.

Presentation2

In contrast, the gap between growth in single-family and multifamily lending compared to growth in total net loans and leases had steadily widened until 2014. In 2014, the gap between lending secured by single- and multifamily real estate and total net loans and leases converged. Figure 3 illustrates this result. According to the figure, between 2009 and 2013, the widening gap in growth rates occurred during a period in which lending secured my single-family and multifamily residences was declining and overall lending by depository institutions was growing. In 2014, the gap between the growth in single-and multifamily loans outstanding and total net loans and leases closed as loans for single- and multifamily real estate returned to growth.


read more…


http://eyeonhousing.org/2015/03/consumer-credit-expands-on-auto-student-loans-2/

U.S. News & World Report Ranks Northern Westchester Hospital Among Best | Mt Kisco Real Estate


Northern Westchester Hospital (NWH) announced that it has been ranked as one of the best hospitals in New York for 2014 – 2015 by U.S. News & World Report.

The annual U.S. News best hospitals rankings, now in their 25th year, recognize hospitals that excel in treating the most challenging patients. In addition to being recognized as a best hospital, Northern Westchester Hospital was recognized regionally for expertise in gynecology, urology, geriatrics, orthopedics and neurosurgery.

For 2014-2015, U.S. News evaluated hospitals in 16 adult specialties and ranked the top 50 in most of the specialties. Just 12 percent of the nearly 5,000 hospitals that were analyzed for best hospitals in 2014-2015 earned a regional ranking in even one specialty. NWH was ranked within five different specialties.

“Providing the highest level of quality, patient-centered care is our priority at Northern Westchester Hospital,” said Joel Seligman, president and CEO of Northern Westchester Hospital. “We have designed and implemented numerous processes that help to ensure that high quality care is consistently delivered to our patients.


read more…


http://bedford.dailyvoice.com/news/us-news-world-report-ranks-northern-westchester-hospital-among-best

Here Now, 7 Lovely Houses For Sale in World Cup Country | Mt Kisco Real Estate


imagereader-3.jpg

Today, on the opening day of the World Cup in Rio de Janeiro, we celebrate some of the realms Brazil rules: soccer—they’ve got the most World Cup wins, after all—and architecture. (There are other things—string bikinis, coffee, the largest rainforest in the world, for example—but let’s not touch those for now.) There’s a jumble of architectural styles on the luxury market right now in the Cidade Maravilhosa: French Neoclassical, contemporary, and Imperial dwellings, to name a few. The most intriguing of the Rio listings? Well, if one’s discounting the Airbnb offering listed by soccer stall Ronaldinho, it’s just too hard to choose, so, below, find eight mansions in the running.


read more…


http://curbed.com/archives/2014/06/12/rio-de-janeiro-mansions-for-sale.php

Abandoned hospitals look like condos to developers | Mt Kisco NY Real Estate


Demand for housing in New York has developers turning old hospitals — St. John’s Episcopal Hospital in Queens, Cabrini Medical Center in Gramercy, and Brooklyn’s Long Island College Hospital — into condos. Some people would rather “live in the psych ward with high ceilings as opposed to cookie-cutter buildings,” developer Don Peebles tells the New York Post. Source: nypost.com.


– See more at: http://www.inman.com/wire/abandoned-hospitals-look-like-condos-to-developers/?utm_source=20140303&utm_medium=email&utm_campaign=dailyheadlinespm#sthash.BxKmdHyO.dpuf