New residential construction slowed sharply in March as the coronavirus pandemic swept across the United States. Privately-owned housing starts declined last month to an annualized rate of 1.2 million, the US Census Bureau said Thursday. That represents a 22% decline from the pace in February.All four geographical segments in the United States were down, led by a 43% plunge in the Northeast, which is getting hit hardest by the health crisis.
22 million Americans have filed for unemployment benefits in the last four weeksThe worse-than-expected declines in housing starts reflects the economic impact caused bythe pandemic.”Unprecedented economic uncertainty and mandatory distancing guidelines squashed homebuyer demand and builders’ ability to confidently invest in new housing projects,” Zillow economist Matthew Speakman wrote in an email Thursday.Despite the sharp month-over-month drop, housing starts were still up from a year ago.Many construction projects have been classified as essential work, meaning they could continue despite stay-at-home orders across the country. Yet social distancing requirements can slow that work and mounting job losses gave homebuilders pause.Building permits, a more forward-looking indicator, also slowed. Privately-owned housing units authorized by permits in March dropped to an annual rate of 1.4 million, Census said. That’s 7% below the February pace. The drop was led by single-family authorizations. However, authorizations of multi-unit buildings rose by 5% from the February pace.
Record plunge in homebuilder confidence
It’s the latest sign that the pandemic will have hurt America’s once-booming housing market.Industry executives have become significantly more pessimistic about the outlook for the housing market.US homebuilder confidence for single-family homes plunged in April by a record 42 points, according to a National Association of Homebuilders index released Wednesday.”The unfolding nightmare in the labor market has removed large numbers of potential homebuyers from the pool,” Ian Shepherdson, chief economist at Pantheon Macroeconomics, wrote in a report Wednesday.New numbers released Thursday show that another 5.2 million Americans filed for unemployment benefits in the week ended April 11. All told, 22 million people have filed for first-time claims since mid-March.
The stock market is acting like a rapid recovery is a slam dunk. It’s notThe government is attempting to avoid a wave of foreclosures caused by the mass layoffs by allowing homeowners hurt by the coronavirus pandemic to postpone payments.Yet many Americans may be less willing to buy homes when they read the dreary economic headlines and look at sharp declines in their investment portfolios.”Everything will get revalued. If the stock market is lower, that has massive wealth effects,” said Peter Boockvar, chief investment officer at Bleakley Advisory Group.Yet others argue that historically-low borrowing costs and a limited amount of supply of homes will insulate the real estate market.”I don’t expect a collapse in prices,” said David Kelly, chief global strategist at JPMorgan Asset Management. “There’s no reasons to sell your home at a loss this year if you can get a better price next year.”
Over the past couple of years, rising pay and low mortgage rates finally converged to make make the dream of home ownership a reality for America’s millennials, many of whom had long been locked out of the housing market. But now, the door is on the verge of slamming on the under-35 crowd, leaving young families outside looking through the picture window—again.
That’s the scenario sketched by Mark Boud, chief economist for Metrostudy, a unit of real estate data and marketing company Hanley Wood. Metrostudy surveys housing trends in hundreds of towns and cities from the ground up, by visiting subdivisions to record how many homes are being built, going to contract, and sold—the latter evidenced by curtains on the windows and tricycles in the driveway.
During the housing-bubble frenzy from 2004 to 2006, as Boud recently recounted to Fortune, easy credit sent sales soaring, inflating prices and leading to a gigantic oversupply of new homes. In 2008 and 2009, the banks and other lenders, overwhelmed with defaults and foreclosures, throttled back so hard on credit that demand collapsed, and housing prices went into a tailspin.
The upshot: From 2009 to 2017, the housing market severely overcorrected, with prices steadily rising once again. “Housing went through a long period of undervalution,” says Boud. It wasn’t millennials, he points out, who benefited from the cheap prices and rescued the market. “The millennials had loads of college debt, and many had bad credit in general, often because their previous loans had been foreclosed on. And they were too young to be stable in their jobs,” he says. The upshot: The youthful cohort couldn’t get mortgages from lenders, who suddenly were rejecting all but class-A credits.
Instead, it was the affluent and investors that profited from low prices and soaked up the excess inventory. “The rich were the buyers without the credit problems,” says Boud. “And institutional investors bought houses cheap and rented them out.” In fact, he says, many of these new owners’ tenants were the very millennials shunned by the banks. In terms of home ownership, millennials became the lost generation.
A lost generation comes home
By 2015, the wealthy and the investors had absorbed the excess. America began generating far more new jobs than new homes, as construction was severely constrained by a shortage of ready-to-go lots. Starting around 2017, the millennials got back in the game, in a big way. The job rolls expanded, and wages jumped. The mortgage market reopened for the more well-to-do 30-somethings. So even though credit overall remained tight, sales to millennials rose, from 22% of new homes sales around 2011 to 50% in 2018—an extraordinary figure, given that millennials account for just one-third of the U.S. population.
Now says Boud, the market is once again turning against what’s now the biggest, and still hungriest, class of buyers. “Prices have risen a lot, and they’re still rising because we’re still way under-building compared to household formation,” he says. “At the same time, rates on home loans are rising, making it much harder for millennials to qualify.” The affordability problem will intensify because of the types of homes the builders are erecting. The only way to make money on expensive land is to build big houses, so “the average home size is 3,000 square feet, which is way too big most first-time buyers,” Boud says. “Ten years ago in Las Vegas, that sized house cost maybe $225,000 [thanks to the housing plunge]. Now it costs $350,000, way out of the reach of young buyers.”(
Hence, Boud sees sales shifting back to the affluent who’ve held high-paying jobs for decades, can qualify for more expensive mortgages, and want the big houses. Eventually, he says, the surge in prices will sow the seeds of a correction. But supply is so tight that the drop should be mild––unless America suffers a recession. “In that case, prices would be lower, but employment and incomes would also drop. So millennials could remain locked out.” Another problem: Millennials who secured a 3.5% fixed rate in 2016 or 2017 will stay in their existing home to keep the low monthly payment rather than trying to move up the housing ladder.
The solution, says Boud, is for builders to lower costs by shifting to factory-built homes they can offer at far lower prices. Homebuilders should also work with the banks to offer interest-only mortgages that would hold down monthly payments in the early years, and allow far more millennials to qualify for credit. He also notes that developers need to take steps to lower home owner association dues that can add $200 to a family’s monthly payments. More 2,000-square-foot houses would also be welcome, but for that to happen, municipalities would need to loosen zoning laws to allow far more lots to be subdivided, far more quickly. Today, towns are trending the wrong way, towards even tighter restrictions.
The outlook for sales is strong, Boud says, because so many Gen-Xers and baby boomers are renting, and more of them want to buy homes. Those folks can both afford to buy, and qualify for mortgages on $450,000-to-$700,000 homes. As for millennials, the generation that housing lost, then briefly found is about to be lost once more.
Welcome back to Period Dramas, a weekly column that alternates between rounding up historic homes on the market and answering questions we’ve always had about older structures.
Thanks to modern heating systems, we can enjoy the cozy picturesqueness of a fireplace without depending on it to keep our homes warm. But that wasn’t the case in 18th- and early 19th-century America.
“Up through about 1800, the wood-burning fireplace—very popular with English settlers—was the primary means of heating a home,” explains Sean Adams, professor of history at the University of Florida and author of Home Fires: How Americans Kept Warm in the Nineteenth Century. “The problem was that winters in America can be much harsher than in England. The weather quickly exposed how inefficient fireplaces are at heating a room.”
The majority of the heat in a fireplace goes up and out of the flue. What little heat does make its way into the room gets concentrated directly in front of the firebox, leaving the rest of the room quite cold.
A fireplace with a Franklin Stove insert. Photo by Robert Khederian
In 1741, Benjamin Franklin sought to improve the efficiency of the fireplace. He introduced a cast-iron insert for the firebox—called the “Franklin Stove”—in The Papers of Benjamin Franklin, volume 2. While it didn’t fundamentally change the design of a fireplace, it addressed his theory about heat.
“Franklin believed heat to be like liquid—he was trying to keep the heat in the room as long as possible, or else it would rush out of the room,” explains Adams.
The Franklin Stove had a series of baffles, or channels, within the stove to direct the flow of air, to keep as much of the heat circulating in the firebox and flowing out into the room as possible. However, the design had problems.
“The stove had to be very tight,” explains Adams. “If there were any leaks, smoke leaked out into the room. Wind would also blow the smoke back into the room. It wasn’t considered a real success.”
Toward the end of the 19th century, the inventor Count Rumford devised a fireplace designed along a set of proportions so it could be built on a variety of scales.
“In the fireplaces I recommend,” Count Rumford writes in a 1796 essay, “the back [of the fireplace] is only about one third of the width of the opening of the fireplace in front, and consequently that the two sides or covings of the fireplaces…are inclined to [the front opening] at an angle of about 135 degrees.”
The Rumford fireplace efficiently burned wood while its characteristically shallow firebox reflected as much heat as possible out into the room as possible. The handy design of the Rumford gained a strong following.
Thomas Jefferson installed eight of them at his country house Monticello. Rumford fireplaces became so mainstream that Henry David Thoreau wrote about them in Walden as a basic quality of the home, alongside copper pipes, plaster walls, and Venetian blinds.
By the 1820s and 1830s, Adams explains, coal was quickly becoming a dominating fuel type. Stoves that could burn either wood or coal—the type being pushed was Anthracite, or “hard” coal—became popular.
Iron stoves were not new technology. While English settlers brought fireplaces, German settlers had iron stoves that did a good job of heating a space.
But what was new was the type of fuel: coal. Adams explains that since coal was so different from the familiar fuel type of wood, it took a little while to gain popularity.
“Coal was first marketed in a similar way to how some new technology is marketed today,” says Adams. “You needed early investors willing to take the risk. It was billed at ‘the fuel of the fashionable,’ which would revolutionize home heating.”
To match, coal stoves became highly decorative, featuring intricate ironwork and decorative finials to make them just as desirable as they were utilitarian.
Coal became mainstream in post-Civil War America. Wealthier families might have burned coal in basement furnaces—with specific rooms dedicated for coal storage—while poorer families might have used little stoves in individual rooms in their home.
The architecture of the home also changed as heating technologies shifted. While Colonial houses of the 18th century needed big chimneys to support multiple fireplaces, houses built in the later half of the 19th century only needed ventilation space for stove pipes. That translated into skinnier chimneys.
Inside, mantlepieces sometimes remained as a backdrop for the stoves. Even though they were technically no longer needed, they continued to act as a focal point in a room.
A mantle that was never designed to surround a fireplace but rather be a backdrop for a coal stove.
Also coming into play in the 19th century was steam heating, which first appeared in the 1850s but gained popularity in the 1880s. Adams explains that this is just another form of coal heating, as coal would be used to heat the water that turns into steam.
Steam heating was first used in institutional buildings like hospitals but then moved to residences. One of the most elaborate examples of a steam-heating network in the 19th century was at Biltmore Estate, the Vanderbilt-owned mansion in Asheville, North Carolina.
Kiernan explains that the subbasement of Biltmore, which was completed in 1895, had three boilers capable of holding 20,000 gallons of water each. Those boilers created steam that circulated to radiators in a network of shafts around the house, a system that seems simple in theory but quickly intensifies when one realizes that the network had to heat 250 rooms.
“Of course—this heating system had help from 65 fireplaces, some more utilitarian, others wildly elaborate,” Kiernan adds.
Heating the largest private home in America was no small feat: In The Last Castle, Kiernan reports that 25 tons of coal were burned in two weeks during the winter of 1900. To prepare for the winter of 1904, the Vanderbilts placed a coal order for 500 tons to be shipped and ready.
Biltmore estate in Asheville, North Carolina. Courtesy of The Biltmore Company.
Regardless of how elaborate or rudimentary the heating system of choice was in the 19th century, something that seemed to connect all methods, whether it be wood or coal, was a reliance on oneself to light the fire and supply the heat. Something that changes in the 20th century, when national grids of electricity and gas fundamentally changed how we heat our homes—but that’s a different story.
“The hearth becomes industrialized throughout the 1800s, but people still wanted to make the fire themselves,” theorizes Adams. “Now, we’re very comfortable with the idea that we can flip a switch to turn the heat on, but that wasn’t the case a century ago. They were close enough to that era of open, roaring fireplaces that people wanted to control their own heat!”
NAR is OPPOSED to the “Tax Cuts and Jobs Act” tax reform plan released by the Senate Finance Committee, and its companion legislation H.R. 1 passed by the House of Representatives on November 16.
For more than a century American tax policy has recognized the value of homeownership to American middle-class wealth creation, strong and stable communities, and as a driver of our nation’s economy. Homeownership is not a special interest, it is our common interest, yet Congress would place the American Dream further out of reach for millions of Americans at a time when our homeownership rate is at a 50 year low. In short, the Tax Cut and Jobs Act is a serious step in the wrong direction.
The Tax Cuts and Jobs Act, the Senate Tax Reform Plan
This plan, like its companion in the House of Representatives, is a direct threat to homeowners and consumers. Not only will millions of homeowners not benefit from the proposal, many will get a tax increase. Additionally, homeowners could lose substantial equity from the more than 10 percent drop in home values likely to result if the bill is enacted.
The companion legislation unveiled by the Senate includes changes to the exemption on Capital Gains Tax from the sale of a primary residence, elimination of the deduction for state and local taxes, elimination of the Home Equity Loan Interest Deduction, restricts the deduction for moving expenses to only active duty military, restricts the deduction for personal casualty losses to Presidentially declared disasters. All this from a bill that is supposed to improve the current system.
H.R. 1, The Tax Cut and Jobs Act
As currently written, H.R. 1(link is external) would eviscerate the current-law tax incentives for purchasing and owning a home for all but a small percentage of Americans (6 percent, according to the Joint Committee on Taxation).
By nearly doubling the standard deduction while eliminating most itemized deductions, the bill would destroy or at least cripple the incentive value of the mortgage interest deduction (MID) for the great majority of current and prospective homebuyers, and sap the incentive value of the property tax deduction for millions more.
The direct result of these changes would be a plunge in home values across America in excess of 10 percent, and likely more in higher cost areas. Provisions in the bill that limit the deductibility of interest on new mortgage loans to $500,000, cap property tax deductibility at $10,000 for those who can still itemize, eliminate the deduction altogether for second homes, and restrict the utility of the exclusion of gain on the sale of a home would exacerbate the effect. Many of these changes are not indexed for inflation, increasing the pain on more and more homeowners over time.
NAR’s research indicates that the average first-time homebuyer makes a down payment of less than 10 percent, meaning that millions of owners of recently-purchased homes would go “under water” on their mortgages, and they would owe more than the homes are worth. This, of course, could lead to devastating results for families that must sell, as well as damage neighborhoods, communities, and the economy itself.
The hard-won equity of millions more homeowners could be ravaged as well. Parents planning to use the value of their homes to help finance the higher education costs of children could find their resources shot, and baby-boomer homeowners nearing retirement who hoped to use their home’s equity to pay for a portion of their retirement may have to delay or revise their plans.
The bottom line is that for tax purposes, owning a home would make less financial sense than renting for the great majority of Americans. This would reverse more than a century of pro-homeownership tax policy and result in untold negative economic and social implications.
While this tax reform legislation is being promoted as a tax cut for middle-income families, the reality is that millions of middle-class homeowners would immediately face tax increases, while those who see a tax cut will see significantly less tax relief if they own a home than if they are a renter.
H.R. 1 uses a “typical family of four” making $59,000 a year as an example of middle-class tax relief delivered by the bill. The family is renting a home, based on the facts presented, and is to receive a tax cut of $1,182 the first year after enactment. If the family owned a home with a typical mortgage for their income level, the tax savings would be 36 percent less.
This may seem a minor difference to some, but the difference grows quickly as income rises. Consider again this same “typical family of four,” but this time assign them a median family income of $73,000 rather than the median household income of $59,000 as per the Ways and Means example. In this case, the renting family receives a tax cut of $1,478 under the bill, but the home owning family would get a refund less than half what the same family would receive as renters.
Finally, looking at this same family, but with an income of $120,000, as renters, they would receive a tax cut under H.R. 1 of $3,408. However, as homeowners with a typical mortgage in a typical average-cost state, they would have a tax increase of $226. This hidden “homeowners penalty” would be an astounding $3,634. Further, the Tax Cuts and Jobs Act not only eliminates the current tax advantages of homeownership, and thus discourages homeownership for many, it would actually encourage renting by allowing investors in residential property to continue to be eligible for full deductions of all interest and property taxes.
To make things worse, the relatively small tax cuts that many middle-class homeowners receive from this proposal would vanish after just a few years. Based on the Congressional Budget Office forecast of inflation, income growth, and 10-year Treasury rates, coupled with the expiration of the family flexibility credit, most middle class families would see their modest tax cuts transform to tax increases under the plan compared to current law after five years. NAR does not believe vanishing tax cuts, coupled with vanishing home equity, is a formula for growing our economy.
Homeowners currently pay 83 percent of all Federal income taxes. This percentage is likely to increase significantly under the Tax Cuts and Jobs Act. At the same time, long standing federal tax policy that recognizes the importance of homeownership to our nation would be eliminated for all but a fortunate few. NAR cannot support these changes because REALTORS® know that tax reform can be better than this. A tax reform bill that is projected to add $1.5 trillion to our national debt should produce very few losers. Unfortunately, it appears America’s homeowners and owner-occupied real estate in general are by far the largest losers in this legislation.
John Lennon and his wife Cynthia lived here between 1964 and 1968. Photos via Knight Frank
Beatlemaniacs may be interested to know that a former home of John Lennon’s has come on the market in Surrey, in South East England. Known as Kenwood, the six-bedroom manse was built in 1913 in a mock-Tudor style and is located on St. Georges Hill estate.
The musician bought the home in 1964 for £20,000, enlisting Kenneth Partridge to design the interiors. Lennon lived there with his first wife Cynthia until 1968, when the couple divorced.
The 1.5-acre property has been significantly updated since then, but it’s still an impressive residence that, in addition to the six bedrooms, features six expansive reception rooms, six bathrooms, a huge kitchen, and beautifully landscaped grounds.
Period details like wood paneling, grand fireplaces, window seats, and exposed beams combine with contemporary finishes to create a bright, accommodating home ideal for entertaining.
Set on a “superb plateau position,” Kenwood enjoys uninterrupted views of the Surrey Hills, while mature gardens, fountains, and split-level lawn terraces offer additional outdoor living opportunities. A secondary building includes an indoor swimming pool with a shower, changing facilities, and a sauna,
All you need is £8.9 million, or about $11.7 million, to make it yours. You can’t buy love, but you can certainly get yourself a piece of rock-royalty real estate. Who knows, maybe Lennon’s musical genius will rub off on the lucky owner.
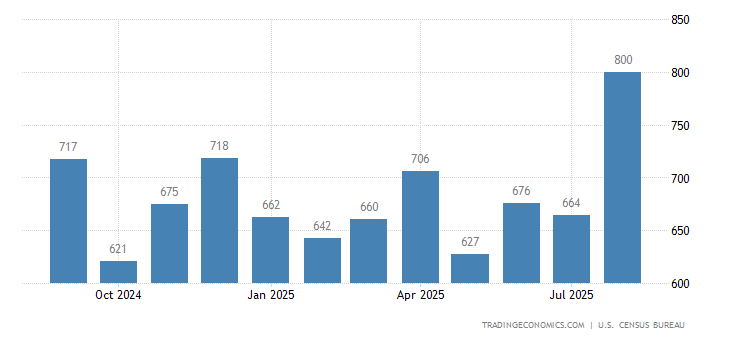
Sales of new single-family houses in the United States shrank 3.4 percent to a seasonally adjusted annual rate of 560 thousand in August of 2017 from an upwardly revised 580 thousand in July. It is a new low so far this year, well below market expectations of 588 thousand. Sales fell the most in the South, partly due to Hurricanes Harvey and Irma. New Home Sales in the United States averaged 650.80 Thousand from 1963 until 2017, reaching an all time high of 1389 Thousand in July of 2005 and a record low of 270 Thousand in February of 2011.
US New Home Sales Fall for 2nd Month
Sales of new single-family houses in the United States shrank 3.4 percent to a seasonally adjusted annual rate of 560 thousand in August of 2017 from an upwardly revised 580 thousand in July. It is a new low so far this year, well below market expectations of 588 thousand. Sales fell the most in the South, partly due to Hurricanes Harvey and Irma.
Sales fell in the Northeast (-2.6 percent to 38 thousand), the West (-2.7 percent to 146 thousand) and the South (-4.7 percent to 307 thousand) and were unchanged at 69 thousand in the Midwest. The counties in Texas and Florida accounted for about 14 percent of US single-family housing units authorized by permits in 2016, and about 27 percent of single-family housing units authorized in the South region. In August, information on the sales status was collected for only 65 percent of cases in Texas and Florida counties, compared to a normal 95 percent rate.
The median sales price of new houses sold was $300,200, above $298,900 a year earlier. The average sales price was $368,100, also higher than $355,100 in August of 2016.
The stock of new houses for sale went up to 284 thousand from 274 thousand in July, hitting the highest level since May of 2009. This represents a supply of 6.1 months at the current sales rate.
Year-on-year, new home sales shrank 1.2 percent.
Figures for July were revised up to 580 thousand from an initial estimate of 571 thousand. The June figure was revised down to 614 thousand from 630 thousand.
A Yorkville duplex that slipped onto the market earlier this week comes with a unique backstory: It was the onetime home of great American songwriter Irving Berlin. The “God Bless America” and “There’s No Business Like Show Business” songster moved into the duplex at 130 East End Avenue in 1931 at the age of 43 along with his family. At the time, Berlin already had hits like “Puttin’ on the Ritz” and “Blue Skies” under his belt, but would go on to write “I’ve Got My Love to Keep Me Warm” and “Say It Isn’t So” during the time he lived in the apartment.
Reflecting Ellin’s taste rather than [Irving’s], it was a formal, stately dwelling with impressive views of the East River. There was nothing showbizzy about the place; the antiques and floor-to-ceiling bookshelves quietly suggested the home of a wealthy, cultivated businessman possessed of exacting, if severe taste.
The Berlins lived in the apartment for the next 13 years, long enough for the space to be photographed by prolific American architectural photographer Samuel Gottscho. The photographs, on file with the Museum of the City of New York, show an apartment that today largely remains unchanged barring cosmetic upgrades like paint.
MCNY
Today, the apartment shows just as stately with its sweeping entry staircase, black and white marble foyer floor, and 28-foot living room with a wood-burning fireplace and views onto the East River.
The two-bedroom, four-bathroom penthouse is on the market for $7.9 million, with monthly maintenance charges of $7,585. (Surely more pricey than in Berlin’s day.) The listing is held by Jane R. Andrews at Warburg.
Rising wages and moderating home prices offset a rise in mortgage interest rates to give housing affordability a slight boost in the first quarter of 2017, according to the National Association of Home Builders/Wells Fargo Housing Opportunity Index (HOI).
In all, 60.3 percent of new and existing homes sold between the beginning of January and end of March were affordable to families earning the U.S. median income of $68,000. This is up from the 59.9 percent of homes sold that were affordable to median-income earners in the fourth quarter.
The national median home price fell to $245,000 in the first quarter from $250,000 in the final quarter of 2016. Meanwhile, average mortgage rates rose nearly half a point from 3.84 percent in the fourth quarter to 4.33 percent in the first quarter.
For the second straight quarter, Youngstown-Warren-Boardman, Ohio-Pa., was rated the nation’s most affordable major housing market. There, 92.7 percent of all new and existing homes sold in the first quarter were affordable to families earning the area’s median income of $54,600. Meanwhile, Kokomo, Ind., was rated the nation’s most affordable smaller market, with 96.3 percent of homes sold in the first quarter being affordable to families earning the median income of $62,500.
For the 18th consecutive quarter, San Francisco-Redwood City-South San Francisco, Calif., was the nation’s least affordable major housing market. There, just 11.8 percent of homes sold in the first quarter were affordable to families earning the area’s median income of $108,400.
All five least affordable small housing markets were also in California. At the very bottom of the affordability chart was Salinas, where 13.8 percent of all new and existing homes sold were affordable to families earning the area’s median income of $63,100.
Freddie Mac (OTCQB: FMCC) today released its Multi-Indicator Market Index® (MiMi®), showing three additional states — Indiana, Alabama and New Jersey — and one additional metro area — Dayton, Ohio — entering their historic benchmark levels of housing activity.
The national MiMi value stands at 85.7, indicating a housing market that’s on the outer edge of its historic benchmark range of housing activity with a +1.05 percent improvement from July to August and a three-month improvement of +1.22 percent. On a year-over-year basis, the national MiMi value improved +5.44 percent. Since its all-time low in October 2010, the national MiMi has rebounded 43 percent, but remains significantly off its high of 121.7.
News Facts:
Forty-one of the 50 states plus the District of Columbia have MiMi values within range of their benchmark averages, with Utah (99.2), Colorado (96.6), Hawaii (96.3), Idaho (96) and North Dakota (95.4) ranking in the top five with scores closest to their historical benchmark index levels of 100.
Eighty of the 100 metro areas have MiMi values within range, with Los Angeles, CA (101.1), Honolulu, HI (99.5), Provo, UT (100.8), Dallas, TX (98.9) and Ogden, UT (98.6) ranking in the top five with scores closest to their historical benchmark index levels of 100.
The most improving states month over month were Nevada (+2.95%), Florida (+2.14%), Illinois (+1.95%), Washington (+1.91%) and Alabama (+1.90%). On a year-over-year basis, the most improving states were Florida (+12.13%), Massachusetts (+9.94%), Nevada (+9.94%), Oregon (+9.43%) and Tennessee (+9.39%).
The most improving metro areas month over month were Las Vegas, NV (+3.00%), Palm Bay, FL (+2.63%), Tampa, FL (+2.59%), Orlando, FL (+2.40%) and Sarasota, FL (+2.40%). On a year-over-year basis, the most improving metro areas were Orlando, FL (+18.21%), Tampa, FL (+14.78%), Chattanooga, TN (+14.51%), Palm Bay, FL (+14.25%) and Lakeland, FL (+13.66%).
In August, 33 of the 50 states and 73 of the top 100 metros were showing an improving three-month trend. The same time last year, all 50 states and 96 of the top 100 metro areas were showing an improving three-month trend.
Quote attributable to Freddie Mac Deputy Chief Economist Len Kiefer:
“Housing markets are on track for their best year in a decade, and that’s reflected in MiMi. The National MiMi stands at 85.7, a 5.4 percent year-over-year increase. The MiMi purchase applications indicator is up over 18 percent from last year and is at its highest level since December 2007.
“The housing market is showing strength across the country. The South continues to show some the biggest improvements, especially in Florida. MiMi’s purchase applications indicator is up more than 30 percent in Florida compared to last year. Meanwhile, in the West, the battle between low mortgage rates and rising house prices continues. So far, low mortgage rates have helped on the affordability front, but in hot markets like Denver, Fresno, Provo and Los Angeles it’s becoming increasingly difficult for the typical family to afford a median price home.”
The 2016 MiMi release calendar is available online.
MiMi monitors and measures the stability of the nation’s housing market, as well as the housing markets of all 50 states, the District of Columbia, and the top 100 metro markets. MiMi combines proprietary Freddie Mac data with current local market data to assess where each single-family housing market is relative to its own long-term stable range by looking at home purchase applications, payment-to-income ratios (changes in home purchasing power based on house prices, mortgage rates and household income), proportion of on-time mortgage payments in each market, and the local employment picture. The four indicators are combined to create a composite MiMi value for each market. Monthly, MiMi uses this data to show, at a glance, where each market stands relative to its own stable range of housing activity. MiMi also indicates how each market is trending, whether it is moving closer to, or further away from, its stable range. A market can fall outside its stable range by being too weak to generate enough demand for a well-balanced housing market or by overheating to an unsustainable level of activity.
Freddie Mac (OTCQB: FMCC) today released the results of its Primary Mortgage Market Survey® (PMMS®), showing average fixed mortgage rates largely unchanged ahead of this week’s employment report.
News Facts
30-year fixed-rate mortgage (FRM) averaged 3.42 percent with an average 0.5 point for the week ending October 6, 2016, unchanged from last week. A year ago at this time, the 30-year FRM averaged 3.76 percent.
15-year FRM this week averaged 2.72 percent with an average 0.5 point, unchanged from last week. A year ago at this time, the 15-year FRM averaged 2.99 percent.
5-year Treasury-indexed hybrid adjustable-rate mortgage (ARM) averaged 2.80 percent this week with an average 0.4 point, down from last week when it averaged 2.81 percent. A year ago, the 5-year ARM averaged 2.88 percent.
Average commitment rates should be reported along with average fees and points to reflect the total upfront cost of obtaining the mortgage. Visit the following link for the Definitions. Borrowers may still pay closing costs which are not included in the survey.
Quote Attributed to Sean Becketti, chief economist, Freddie Mac.
“The 10-year Treasury yield leaped to a two-week high following reports of the European Central Bank retreating from its bond-buying program ahead of its initial March deadline. In contrast, the 30-year fixed-rate mortgage remained unchanged at 3.42 percent. Over the past two weeks, mortgage rates have remained fairly flat while Treasury yields have fallen and risen. This Friday’s jobs report will provide clarity on whether or not mortgage rates follow the recent upward trend in Treasury yields.”


/cdn.vox-cdn.com/uploads/chorus_image/image/57806463/800px_RumfordFireplaceAlc1.0.jpg)
/cdn.vox-cdn.com/uploads/chorus_asset/file/9782385/IMG_2287.jpg)
/cdn.vox-cdn.com/uploads/chorus_asset/file/9782457/015206pr.jpg)
/cdn.vox-cdn.com/uploads/chorus_asset/file/9782549/IMG_0332.jpg)
/cdn.vox-cdn.com/uploads/chorus_asset/file/9782529/032__1_.jpg)
/cdn.vox-cdn.com/uploads/chorus_image/image/57619687/9f5a8e8e_a039_44b1_a1d1_8a86a014af7e_0.0.jpg)
/cdn.vox-cdn.com/uploads/chorus_asset/file/9688091/33b00087_8b63_40f4_ab86_16aa1f97cda0_0.jpg)
/cdn.vox-cdn.com/uploads/chorus_asset/file/9688093/4cbac91d_6521_49c2_a990_38e188836ae3_0.jpg)
/cdn.vox-cdn.com/uploads/chorus_asset/file/9688095/9bf2e331_9358_4462_98d7_569f468d05b8_0.jpg)
/cdn.vox-cdn.com/uploads/chorus_asset/file/9688097/9b1e360c_00d3_49a5_857e_002d73cf75e6_0.jpg)
/cdn.vox-cdn.com/uploads/chorus_asset/file/9688101/68abf952_b0f5_40b3_9fae_68512077da36_0.jpg)
/cdn.vox-cdn.com/uploads/chorus_asset/file/9688105/c1c46e16_630f_4aac_8a46_a03b5505ab4c_0.jpg)
/cdn.vox-cdn.com/uploads/chorus_asset/file/9688103/146658fd_c212_4dbf_949b_9e6b9e415d33_0.jpg)
/cdn.vox-cdn.com/uploads/chorus_asset/file/9688107/fda72eae_4fd6_4f98_912c_c0482fafb36c_0.jpg)
/cdn.vox-cdn.com/uploads/chorus_asset/file/9688125/1d85c23a_5cc6_4b36_a093_65f91b4fb1a1_0.jpg)
/cdn.vox-cdn.com/uploads/chorus_asset/file/9688117/c79b1b58_a900_40de_8b1b_26b68c28ca06_0.jpg)
/cdn.vox-cdn.com/uploads/chorus_asset/file/9688129/6b168155_d098_4d3b_89d2_5478533e1f04_0.jpg)
/cdn.vox-cdn.com/uploads/chorus_asset/file/9688143/d34efdc1_c1a8_4764_a8b0_6b4f6a0101c5_0.jpg)
/cdn.vox-cdn.com/uploads/chorus_asset/file/9688133/7aae30d9_21b7_4df4_a9e6_a71ebdc904b8_0.jpg)
/cdn0.vox-cdn.com/uploads/chorus_image/image/54831799/130EEndAveUnitPH_4857Print.0.jpg)
/cdn0.vox-cdn.com/uploads/chorus_asset/file/8536313/MNY197558.jpg)
/cdn0.vox-cdn.com/uploads/chorus_asset/file/8536317/MNY197561.jpg)
/cdn0.vox-cdn.com/uploads/chorus_asset/file/8536323/MNY197560.jpg)
/cdn0.vox-cdn.com/uploads/chorus_asset/file/8536315/MNY197564.jpg)
/cdn0.vox-cdn.com/uploads/chorus_asset/file/8536493/130EEndAveUnitPH_4822Print.jpg)
/cdn0.vox-cdn.com/uploads/chorus_asset/file/8536491/130EEndAveUnitPH_4812Print.jpg)
/cdn0.vox-cdn.com/uploads/chorus_asset/file/8536487/130EEndAveUnitPH_4840Print.jpg)
/cdn0.vox-cdn.com/uploads/chorus_asset/file/8536495/130EEndAveUnitPH_4892Print.jpg)
/cdn0.vox-cdn.com/uploads/chorus_asset/file/8536485/130_EEA_Andrews_1.jpg)
/cdn0.vox-cdn.com/uploads/chorus_asset/file/8536489/130_EEA_Andrews_3.jpg)
/cdn0.vox-cdn.com/uploads/chorus_asset/file/8539003/1663584_fp148026396.jpg)
