As New Yorkers struggle with higher gas and grocery prices amid record-high inflation rates, the cost of rent is also increasing — and isn’t expected to level off anytime soon, according to data and experts.
The net effective median rent in Manhattan increased by a whopping 10.1 percent between July and October and 20 percent since January as inflation jumped to the highest level seen since 1990, according to data compiled by Miller Samuel/Douglas Elliman.
In Queens, the third-quarter median asking rent was $2,200 this year, just $100 shy of the pre-pandemic peak set in quarter three of 2019, according to data from StreetEasy.
While numbers from Miller Samuel/Douglas Elliman show housing costs across Manhattan, Brooklyn and Northwest Queens are still lower than 2019, early numbers from real estate analytics company UrbanDigs show prices jumped beyond pre-pandemic levels this month.
So far, the median asking rent in Manhattan is up 27 percent this month compared to last year and up 4 percent compared to November 2019, the data show.
New York’s numbers reflect a nationwide trend that’s seen a 0.4 percent increase in housing cost for renters between September and October.
In Brooklyn, the median asking rent is up 15 percent so far this month compared to last year and up 5 percent compared to Nov. 2019.
“I wish I had better news on that one, I think a lot of tenants are likely to get sticker shock at their next lease renewal,” Greg McBride, the chief financial analyst at the personal finance website Bankrate.com, told The Post.
“If inflation does eventually moderate and we get back to that 2 percent rate of inflation, then OK, that’s an environment where rents would likely increase at a much more modest, pedestrian pace, but if inflation stays at 4 or 5 percent, that’s going to translate into similar increase in rents year after year.”
New York’s numbers reflect a nationwide trend that’s seen a 0.4 percent increase in housing cost for renters between September and October amid a dwindling supply of listings, high demand and a supply chain bottleneck that’s increased the cost of home building materials, Labor Department data show.
Earlier this year, rents in tech hubs like New York City, Los Angeles and Chicago were declining by 15.8 percent but in September, they jumped by 7.6 percent year over year, according to data from Realtor.
“In New York City, the vacancy rate here is already absurdly low and rents have been steadily rising post pandemic as there is more demand than supply. Additionally, if mortgage rates start to go up and affordability is affected it will force potential buyers to become renters as they are priced out of the market,” Pamela Liebman, the CEO of real estate giant Corcoran, told The Post.
“If mortgage rates rise, that will put additional pressure on an already robust rental market and we could see a serious rise in rent. And as landlords’ costs go up due to inflation, they will continue to pass the increases on to the tenants.”
Earlier this year, rents in tech hubs like New York City, Los Angeles and Chicago were declining by 15.8 percent but in September, they jumped by 7.6 percent year over year
“The rate of growth in 2021 has been like a rocket ship, but it’s coming from a very low place because rents fell to 25% during the early days of the pandemic and now are rising,” Miller explained.
“If we look at net-effective median rent for all of Manhattan compared to October of 2019, so pre-pandemic but the same seasonal period in the year, median rent is 0.8 percent below 2 years ago. It’s very close to parity.”
Still, with billions in stimulus dollars flowing through the region, expected wage growth and the return of international buyers, demand is only expected to go up and unless the housing supply increases, rent costs are slated to jump even more, too, said Miller.
In 2020, the number of new housing permits decreased by 26.3 percent citywide and in Manhattan, only 1,896 new housing permits were issued last year, down 65.6 percent from 2019 and the lowest level seen since the 2010 Great Recession, city statistics show.
Rents are expected to continue to grow throughout the end of the year and throughout next spring according to an economist at StreetEasy.
“Rents are going to continue to grow throughout the end of the year and throughout next spring,” said Nancy Wu, an economist with StreetEasy.
“We’re going to see a very busy rentals market [next year] and high demand is going to lead to higher rents, given the supply is pretty constant.”
At the start of the pandemic, New York implemented a moratorium on evictions barring landlords from booting tenants who can show they’re behind on their rents because of COVID-era financial difficulties but the program will end come January 15.
Beyond that, cash-strapped renters can apply for state aid through a federally financed program designed to help lower-income New Yorkers pay their housing costs but that program has a bottom, too.
So far, tenants have filed 252,000 applications, 73,000 of which have been paid out, totaling $913 million in aid.
An additional 73,000 applications, totaling $917 million in aid, have been tentatively approved.
Median sales prices rose for existing single-family homes in all but one of 183 measured markets in the third quarter of 2021, according to the latest quarterly report from the National Association of Realtors.
The report also found that 78% of the 183 markets experienced double-digit year-over-year price increases, a decrease from 94% in the prior quarter, and three metro areas saw price gains of over 30% from one year ago, also fewer than the number in the previous quarter.
The median sales price of single-family existing homes climbed 16% from one year ago to $363,700, a slower pace in comparison to the preceding quarter at 22.9%. All four major regions had double-digit year-over-year price growth, led by the Northeast at 17.5%, followed by the South at 14.9%, the Midwest at 10.7%, and the West at 10.3%.
“Home prices are continuing to move upward, but the rate at which they ascended slowed in the third quarter,” says Lawrence Yun, NAR chief economist. “I expect more homes to hit the market as early as next year, and that additional inventory, combined with higher mortgage rates, should markedly reduce the speed of price increases.”
The markets with the highest year-over-year price gains were: Austin-Round Rock, Texas; Naples-Immokalee-Marco Island, Florida; Boise-Nampa, Idaho; Ocala, Florida; Punta Gorda, Florida; Salt Lake City; Phoenix; Sebastian-Vero Beach, Florida; Port St. Lucie, Florida; and New York-Jersey City-White Plains, New Jersey.
“While buyer bidding wars lessened in the third quarter compared to early 2021, consumers still faced stiff competition for homes located in the top 10 markets,” continues Yun. “Most properties were only on the market for a few days before being listed as under contract.”
In the third quarter, the average monthly mortgage payment on an existing single-family home financed with a 30-year fixed-rate loan and 20% down payment rose to $1,214, an increase of $156 from one year ago.
Among all home buyers, the monthly mortgage payment as a share of the median family income increased to 16.6%, up from 14.9% a year ago. For first-time buyers, the typical mortgage payment on a 10% down payment loan increased to 25.2% of the median family income, up from 22.6% a year ago.
A family typically needed an income of more than $100,000 to affordably pay a 10% down payment mortgage in 17 markets, matching the prior quarter. In 83 markets, a family typically needed an income of less than $50,000 to afford a home, down from 85 markets in the prior quarter.
“For the third quarter—and for 2021 as a whole—home affordability declined for many potential buyers,” says Yun. “While the higher prices made it extremely difficult for typical families to afford a home, in some cases the historically low mortgage rates helped offset the asking price.”
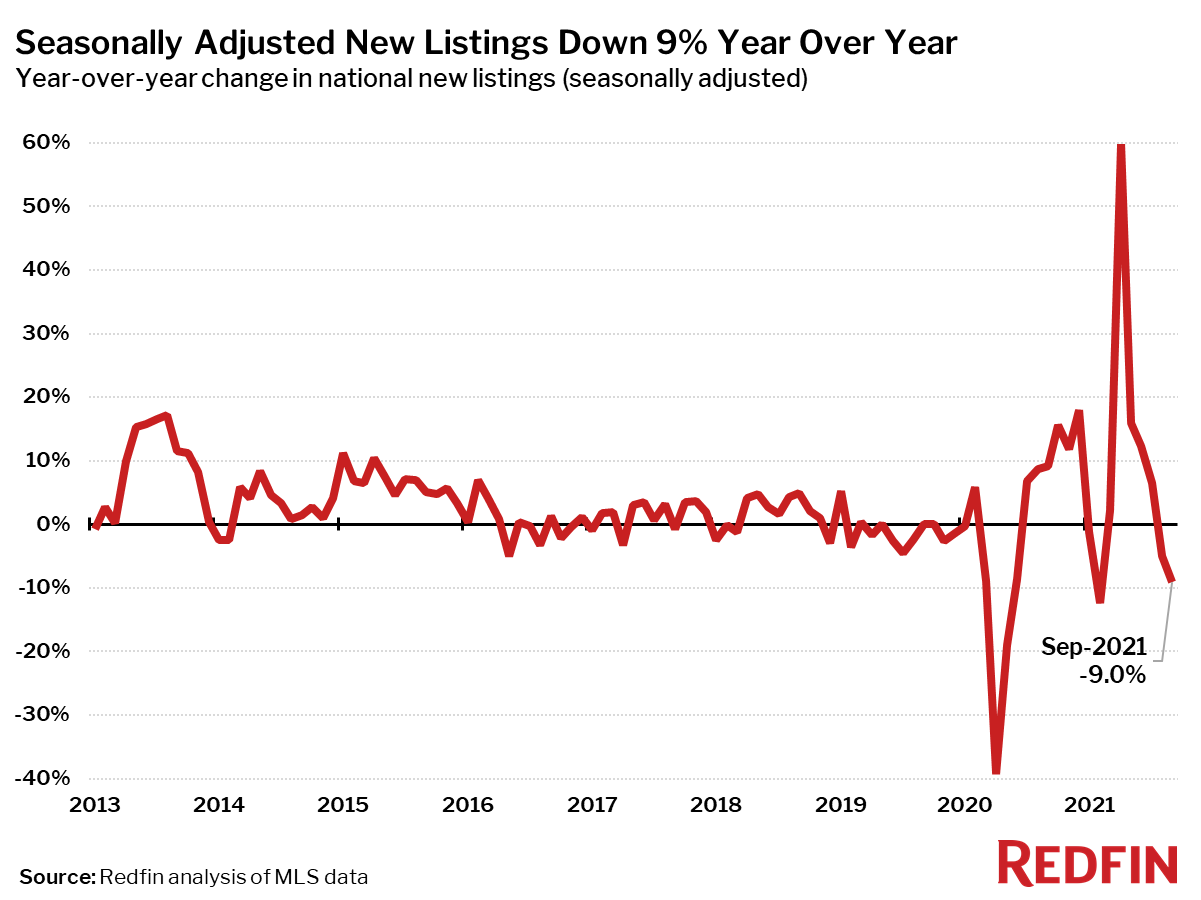
New listings of homes for sale fell 9% from a year earlier and closed home sales were down 5%.
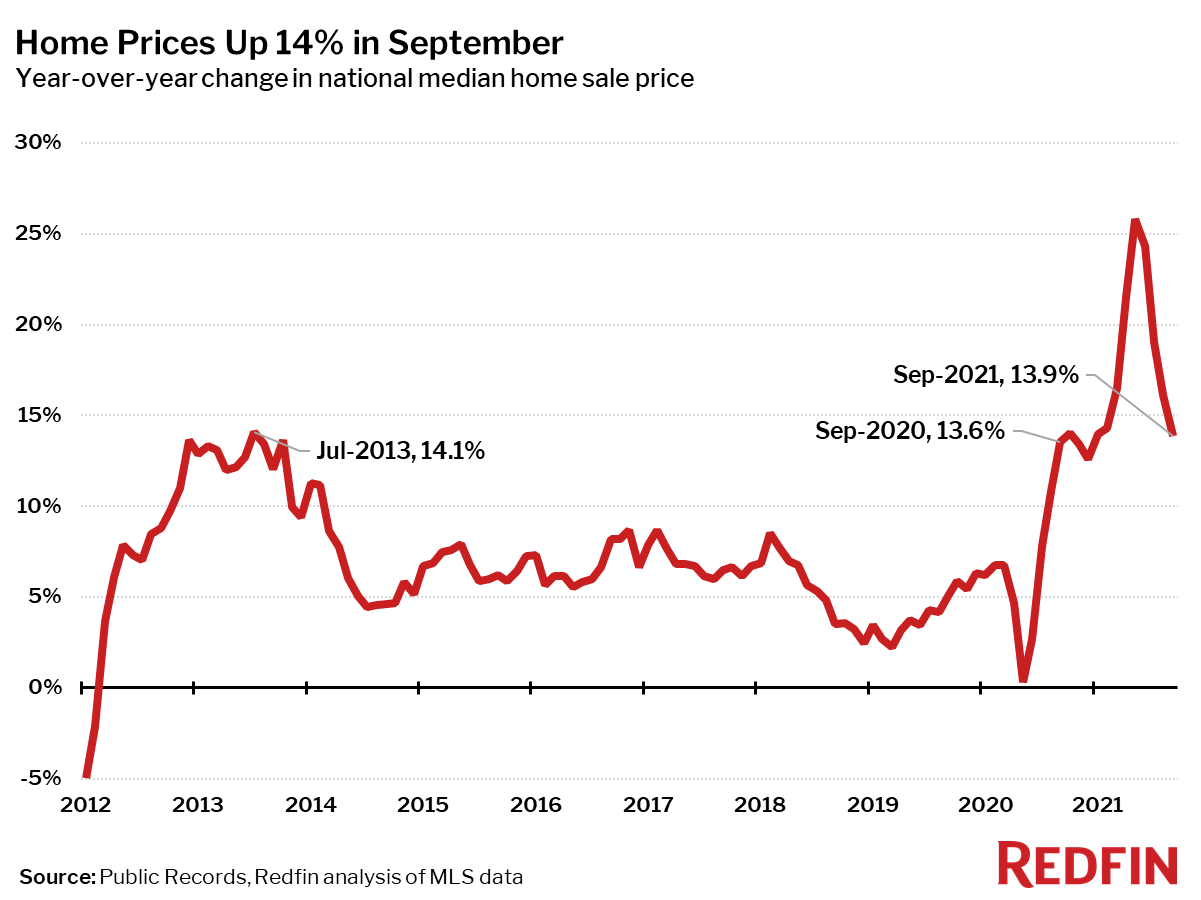
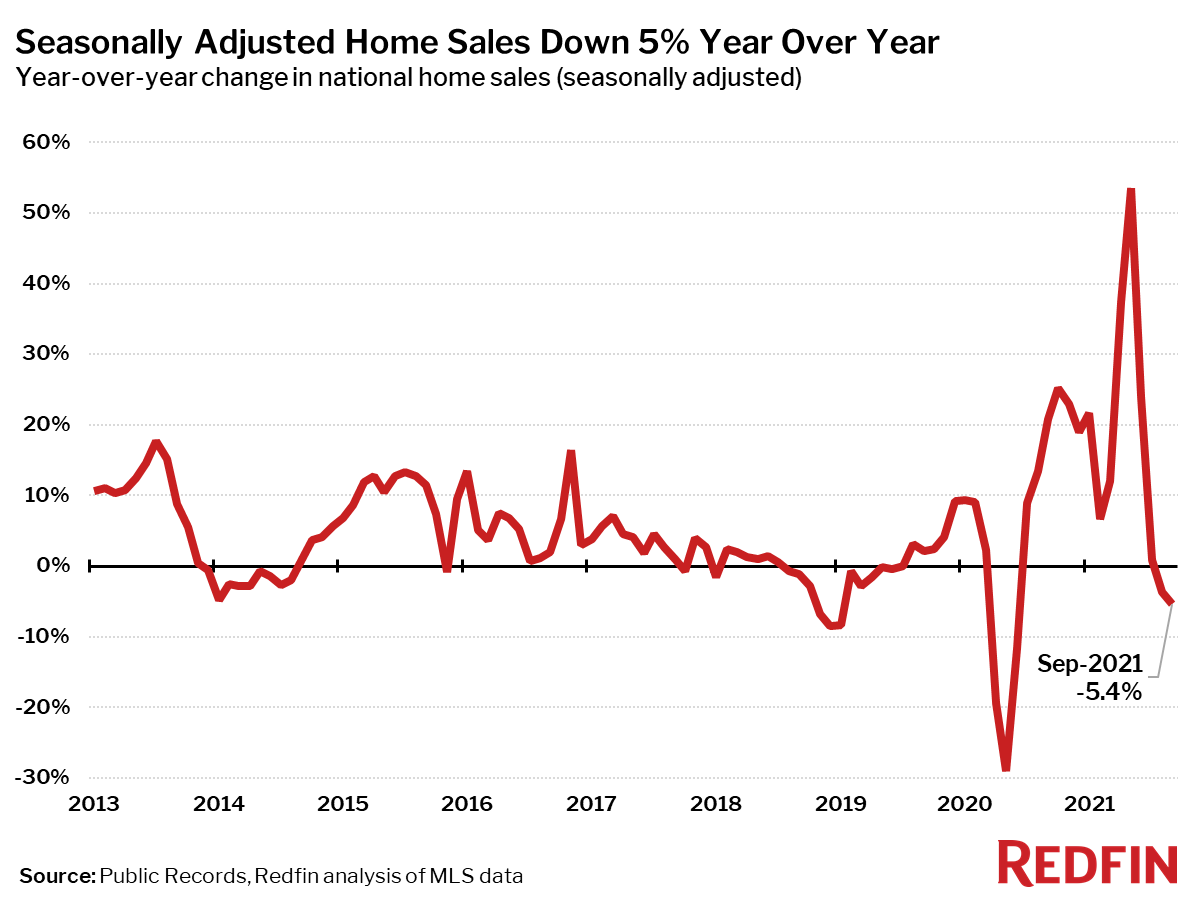
The median price of homes sold in September was $376,800, up 14% from a year earlier, the lowest growth rate since December 2020. September marked the 14th consecutive month of double-digit price gains. Closed home sales and new listings of homes for sale both fell from a year earlier, by 5% and 9% respectively.
“The severe lack of inventory is restricting home sales, said Redfin Chief Economist Daryl Fairweather. “Even though plenty of people bought homes last year, many homebuyers waited while the pandemic went from bad to worse and remote-work policies were finalized. The homebuyers who are just beginning their search are finding that the well has run dry. But I am hopeful that as it becomes easier to get building materials, we will finally have a strong year for new construction in 2022. That’s what the market needs more than anything.”
Median sale prices increased from a year earlier in all but one of the 85 largest metro areas Redfin tracks: Bridgeport, CT, where prices were down 2.2%. A year ago prices were up 32% in Bridgeport as the area experienced a sudden flood of interest from homebuyers looking to leave New York. The current price decline is likely a cooling from an extremely overheated state.
Seasonally-adjusted home sales in September were down 5% from a year earlier, the second annual decline in 16 months. Home sales fell in 66 of the 85 largest metro areas Redfin tracks. The biggest sales declines were seen in New Orleans (-42%), Bridgeport, CT (-24%) and Salt Lake City (-23%). The largest gains were in places where sales were still somewhat depressed in September 2020, including New York (+26%), Honolulu (+24%), and San Jose, CA (+15%).
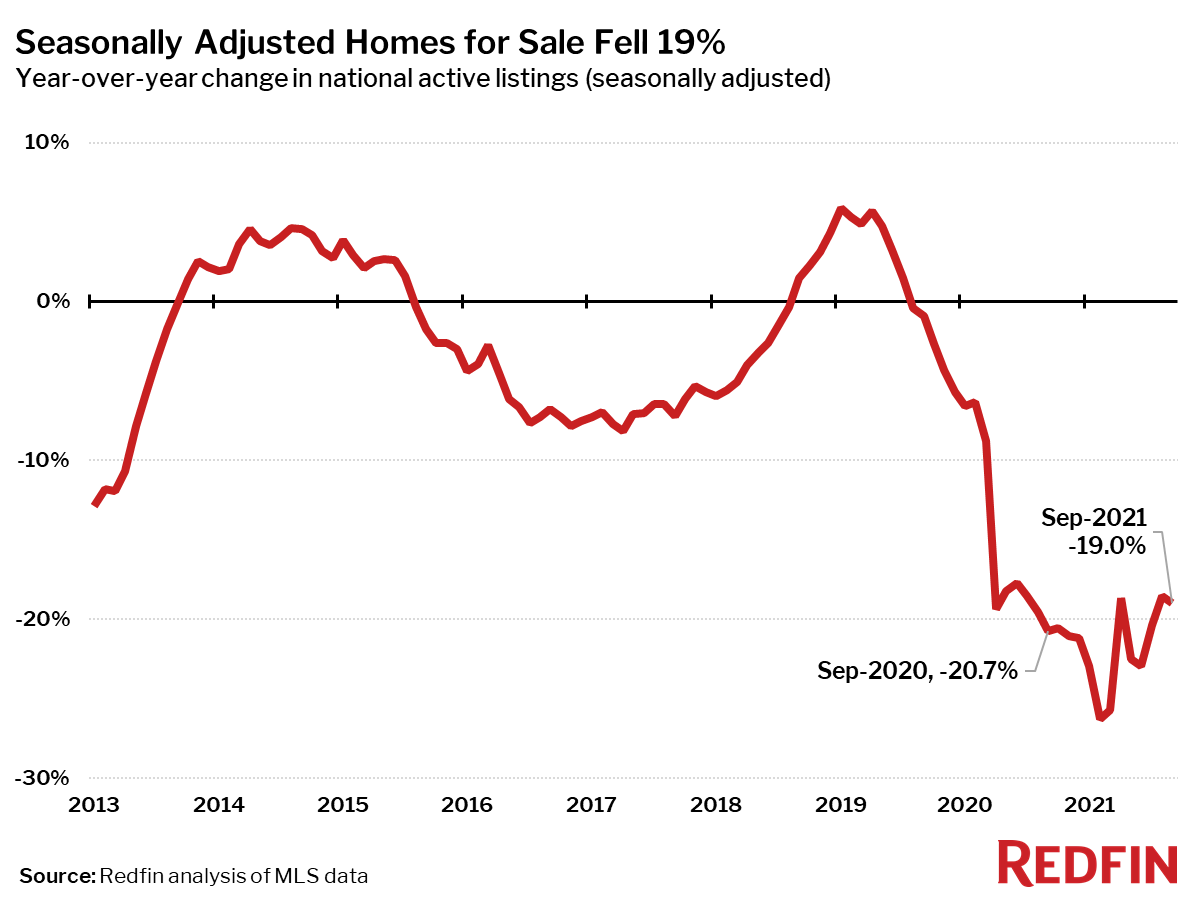
Seasonally adjusted active listings—the count of all homes that were for sale at any time during the month—fell 19% year over year in September, on par with the previous month.
Only three of the 85 largest metros tracked by Redfin posted a year-over-year increase in the number of seasonally adjusted active listings of homes for sale: Austin, TX (+3%), Tacoma, WA (+3%) and Columbus, OH (+0.3%). The biggest year-over-year declines in active housing supply in September were in Baton Rouge, LA (-53%), Salt Lake City (-50%) and Rochester, NY (-47%).
Seasonally adjusted new listings of homes for sale were down 9% in September from a year earlier, only the second decline since February. New listings fell from a year ago in 75 of the 85 largest metro areas. The biggest declines were in Baton Rouge (-59%), Allentown, PA (-57%) and Salt Lake City, UT (-51%). New listings rose the most from a year ago in Austin, TX (+18%), Tacoma, WA (+9%) and Portland, OR (+8%).
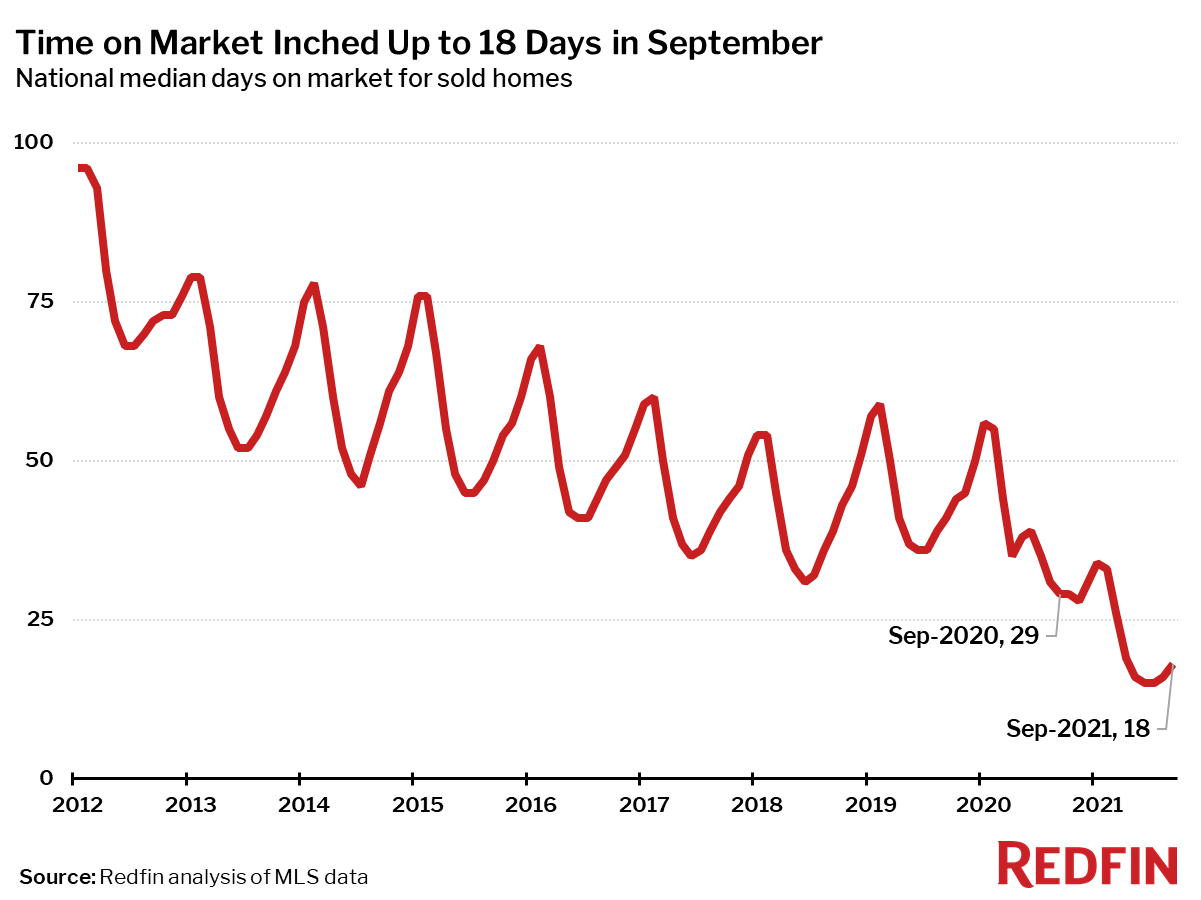
Measures of housing market competition based on completed home sales eased further in September.
The typical home that sold in September went under contract in 18 days—more than a week faster than a year earlier, when homes sold in a median 29 days, but up three days from the record low in June.
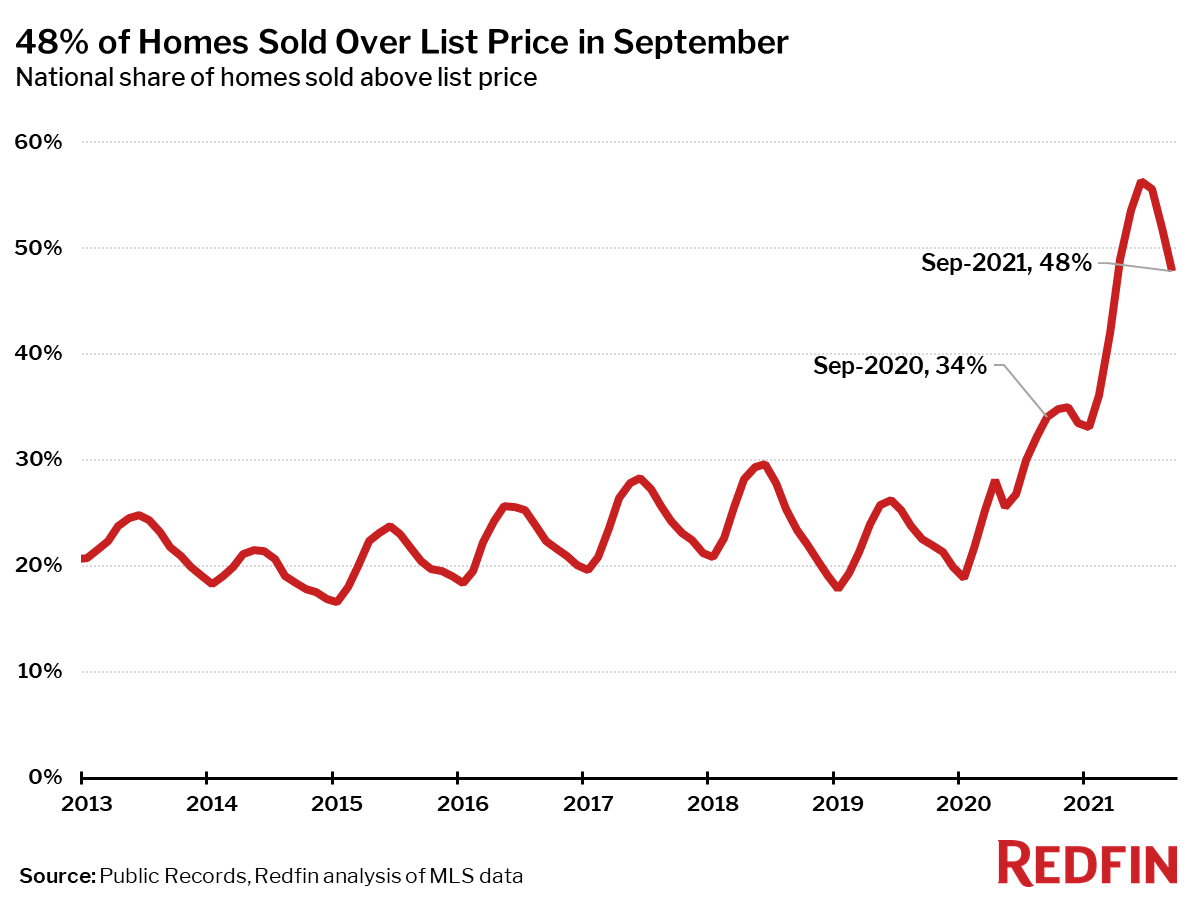
In September, 48% of homes sold above list price, down 8 percentage points from the record high in June, but up 14 percentage points from a year earlier.
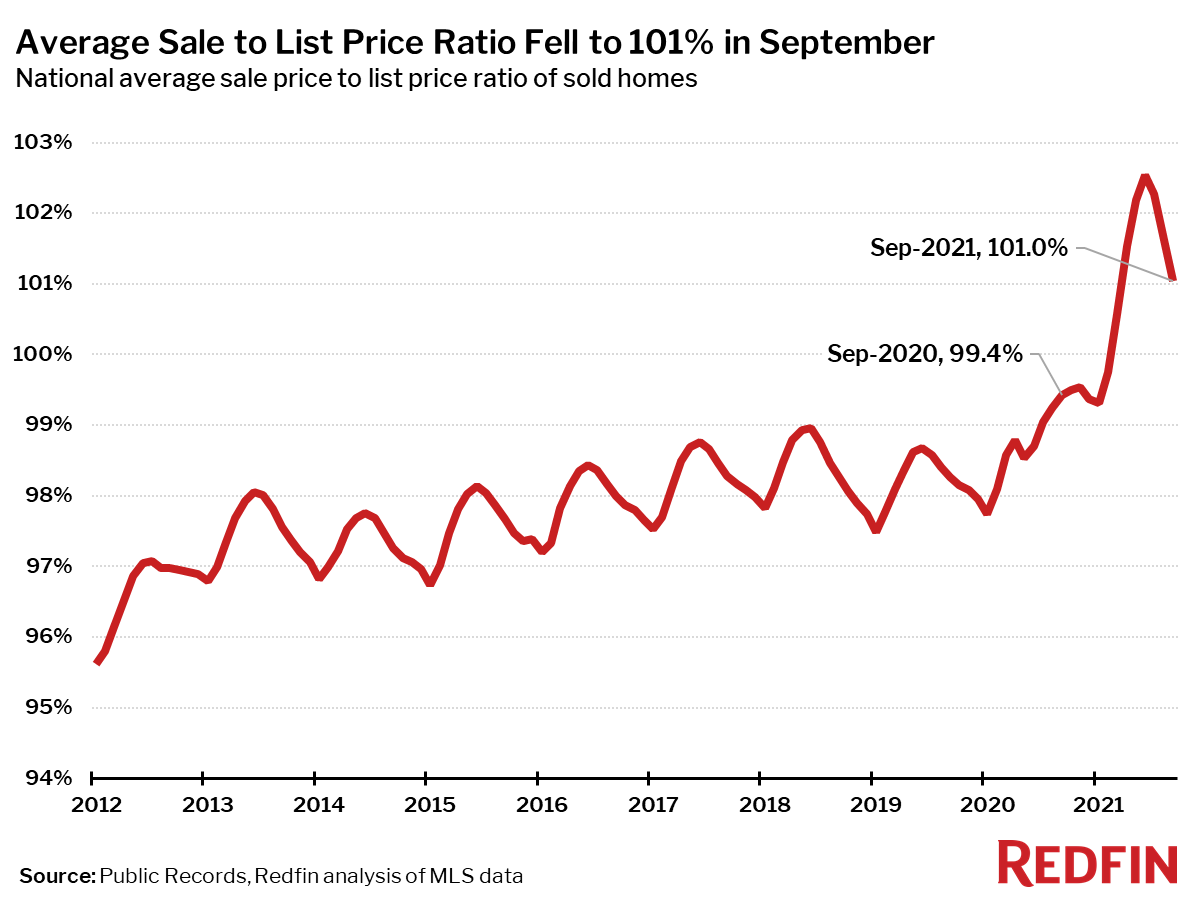
The average sale-to-list price ratio also dipped slightly in September to 101%, down from a record high of 102.5% in June but up from 99.4% a year earlier.
Other September Highlights
Competition
Indianapolis was the fastest market, with half of all homes pending sale in just 5 days, down from 7 days a year earlier. Denver was the next fastest market, with 6 median days on market, followed by Grand Rapids, MI, Seattle and Tacoma, WA all with 7 days on market.
North Port, FL had the nation’s highest price growth, rising 29.7% since last year to $389,000. Salt Lake City had the second highest growth at 27.8% year-over-year price growth, followed by Austin, TX (27.3%), Phoenix (25.6%), and McAllen, TX (25.1%).
1 metro saw price declines in September: Bridgeport, CT (-2.2%).
Sales
New York led the nation in year-over-year sales growth, up 25.9%, followed by Honolulu, HI, up 23.6%. San Jose, CA rounded out the top three with sales up 14.7% from a year ago.
New Orleans saw the largest decline in sales since last year, falling 41.7%. Home sales in Bridgeport, CT and Salt Lake City declined by 23.5% and 23.3%, respectively.
Inventory
Austin, TX had the highest increase in the number of homes for sale, up 3.3% year over year, followed by Tacoma, WA (2.6%) and Columbus, OH (0.3%).
Baton Rouge, LA had the largest decrease in overall active listings, falling 52.6% since last September. Salt Lake City (-50.3%), Rochester, NY (-46.9%), and North Port, FL (-42.6%) also saw far fewer homes available on the market than a year ago.
Redfin Estimate
Miami (86.3%) had the largest share of homes predicted to sell for below list price, according to Redfin Estimate data, followed by Fort Lauderdale, FL (82.0%) and West Palm Beach, FL (81.2%).
Oakland, CA (93.6%) had the largest share of homes predicted to sell at or above list price, followed by San Jose, CA (92.7%) and Portland, OR (87.9%).
Below are market-by-market breakdowns for prices, inventory, new listings and sales for markets with populations of 750,000 or more. For downloadable data on all of the markets Redfin tracks, visit the Redfin Data Center.
Housing affordability held steady at its lowest level in nearly a decade, as higher home prices offset lower mortgage rates to keep the affordability rate flat in the third quarter of 2021. In the months ahead, however, supply-chain disruptions and the prospect of higher interest rates will continue to threaten housing affordability.
According to the National Association of Home Builders (NAHB)/Wells Fargo Housing Opportunity Index (HOI), 56.6 percent of new and existing homes sold between the beginning of July and end of September were affordable to families earning the U.S. median income of $79,900. This is unchanged from the 56.6% of homes sold in the second quarter of 2021 and remains the lowest affordability level since the beginning of the revised series in the first quarter of 2012.
The HOI shows that the national median home price increased to a record $355,000 in the third quarter, up $5,000 from the second quarter and $35,000 from the first quarter. Meanwhile, average mortgage rates fell by 14 basis points in the third quarter to 2.95% from the rate of 3.09% in the second quarter. However, mortgage rates are currently running above 3.1%, and this higher trend could affect affordability later this year and into 2022.
Lansing, East Lansing, Mich. was the nation’s most affordable major housing market, defined as a metro with a population of at least 500,000. There, 89.1% of all new and existing homes sold in the third quarter were affordable to families earning the area’s median income of $79,100.
Meanwhile, Davenport-Moline-Rock Island, Iowa-Ill. was rated the nation’s most affordable smaller market, with 93.4% of homes sold in the third quarter being affordable to families earning the median income of $76,300.
For the fourth straight quarter, Los Angeles-Long Beach-Glendale, Calif., remained the nation’s least affordable major housing market. There, just 8.3% of the homes sold during the third quarter were affordable to families earning the area’s median income of $80,000.
Four of the five least affordable small housing markets were also in the Golden State. However, at the very bottom of the affordability chart was Corvallis, Ore., where 6% of all new and existing homes sold in the third quarter were affordable to families earning the area’s median income of $93,000.
Visit nahb.org/hoi for tables, historic data and details.
Freddie Mac (OTCQB: FMCC) today released the results of its Primary Mortgage Market Survey® (PMMS®), showing that the 30-year fixed-rate mortgage (FRM) averaged 2.98 percent.
“Despite the re-acceleration of economic growth, the recent bond rally drove mortgage rates down for the second consecutive week,” said Sam Khater, Freddie Mac’s Chief Economist. “These low mortgage rates, combined with the tailwind of first-time homebuyers entering the market, means that purchase demand will remain strong into next year. However, affordability pressures continue to be an ongoing concern for homebuyers.”
News Facts
30-year fixed-rate mortgage averaged 2.98 percent with an average 0.7 point for the week ending November 10, 2021, down from last week when it averaged 3.09 percent. A year ago at this time, the 30-year FRM averaged 2.84 percent.
15-year fixed-rate mortgage averaged 2.27 percent with an average 0.6 point, down from last week when it averaged 2.35 percent. A year ago at this time, the 15-year FRM averaged 2.34 percent.
5-year Treasury-indexed hybrid adjustable-rate mortgage (ARM) averaged 2.53 percent with an average 0.4 point, down slightly from last week when it averaged 2.54 percent. A year ago at this time, the 5-year ARM averaged 3.11 percent.
The PMMS® is focused on conventional, conforming, fully amortizing home purchase loans for borrowers who put 20 percent down and have excellent credit. Average commitment rates should be reported along with average fees and points to reflect the total upfront cost of obtaining the mortgage. Visit the following link for the Definitions. Borrowers may still pay closing costs which are not included in the survey.
Freddie Mac makes home possible for millions of families and individuals by providing mortgage capital to lenders. Since our creation by Congress in 1970, we’ve made housing more accessible and affordable for homebuyers and renters in communities nationwide. We are building a better housing finance system for homebuyers, renters, lenders, investors and taxpayers. Learn more at FreddieMac.com, Twitter @FreddieMac and Freddie Mac’s blog FreddieMac.com/blog.
Inflation across a broad swath of products that consumers buy every day was even worse than expected in October, hitting its highest point in more than 30 years, the Labor Department reported Wednesday.
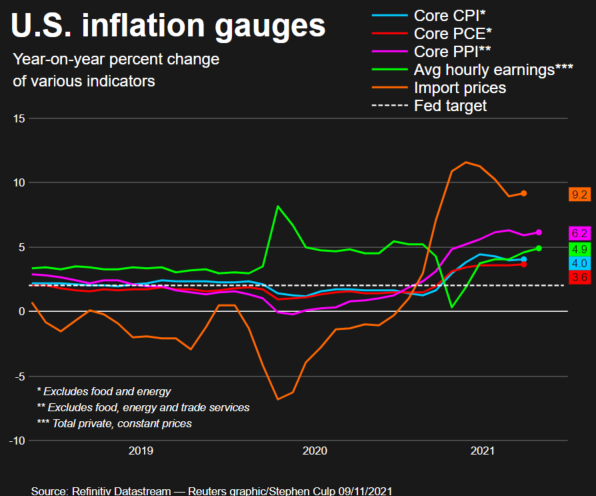
The consumer price index, which is a basket of products ranging from gasoline and health care to groceries and rents, rose 6.2% from a year ago. That compared to the 5.9% Dow Jones estimate.
On a monthly basis, the CPI increased 0.9% against the 0.6% estimate.
Stripping out volatile food and energy prices, so-called core CPI was up 0.6% against the estimate of 0.4%. Annual core inflation ran at a 6.2% pace, compared to the 4% expectation and the highest since November 1990.
Fuel oil prices soared 12.3% for the month, part of a 59.1% increase over the past year. Energy prices overall rose 4.8% in October and are up 30% for the 12-month period.
Used vehicle prices again were a big contributor, rising 2.5% on the month and 26.4% for the year. New vehicle prices were up 1.4% and 9.8% respectively.
Food prices also showed a sizeable bounce, up 0.9% and 5.4% respectively.
The price increases meant that workers fell further behind.
In a separate report, the Labor Department said real wages after inflation fell 0.5% from September to October, the product of a 0.4% increase in average hourly earnings that was more than offset by the CPI surge.
Shelter costs, which make up one-third of the CPI computation, increased 0.5% for the month and are now up 3.5% on a year-over-year basis, pointing to more reasons for concern that inflation could be more persistent than policymakers anticipate. The annual pace is the highest since September 2019.
The data comes as policymakers such as Fed Chairman Jerome Powell and Treasury Secretary Janet Yellen maintain that the current price pressures are temporary and related to pandemic-specific issues. While they have conceded that inflation has been more persistent than they expected, they see conditions returning to normal over the next year or so.
The average interest rates on 30- and 15-year mortgages fell to their lowest levels in more than a month as rates offered on home loans retreated across the board.
The average rate offered to homebuyers using a conventional 30-year fixed mortgage, the most popular type of home loan, fell to 3.25% from 3.29% the previous business day. The average for a 15-year fixed mortgage fell to 2.48% from 2.52% the previous business day. Both are the lowest they’ve been since early October.
Fixed mortgage rates tend to track 10-year Treasury yields, which usually rise with heightened inflation fears (and fall when those fears subside.) Investor concerns about soaring inflation have generally pushed yields to a much higher range since the summer, plus everyone is closely watching how the Federal Reserve interprets the latest inflation data and whether it will take drastic action to control it. Yields have fallen some since last week, when the Fed said it would begin to pull back on the easy money policies it put in place to help the economy through the pandemic.
The average 30-year rate hit a six-month high of 3.48% late last month, but even at that level, it was pretty low by historic standards. According to a Freddie Mac measure that dates back farther than our data, the 30-year hasn’t gone more than about half a percentage point higher than its record low of last winter. Three years ago, it was almost 5% and at the start of the 1990s, around 10%.
During the pandemic, these relatively low rates have bolstered buying power, allowing house hunters to buy more expensive homes with the same monthly budget and helping to fuel a fiercely competitive residential real estate boom that has only recently begun to cool slightly. For the same reasons, the uptick in rates over the past few months has discouraged borrowing, in particular refinancing activity. An index measuring the volume of applications to refinance an existing mortgage is at its lowest level since January 2020, according to the Mortgage Bankers Association.
Mortgage rates, like the rates on any loan, are going to depend on your credit score, with lower rates going to people with better scores, all else being equal. The rates shown reflect the average offered by more than 200 of the country’s top lenders, assuming the borrower has a FICO credit score of 700-759 (within the “good” or “very good” range) and a loan-to-value ratio of 80%.
30-Year Mortgage Rates Drop
A 30-year fixed mortgage is by far the most common type of mortgage because it offers a consistent and relatively low monthly payment. (Shorter-term fixed mortgages have higher payments because the borrowed money is paid back more quickly.)
Besides conventional 30-year mortgages, some are backed by the Federal Housing Authority or the Department of Veterans Affairs. FHA loans offer borrowers with lower credit scores or a smaller down payment a better deal than they might otherwise get; VA loans let current or past members of the military and their families skip a down payment.
30-year fixed: The average rate fell to 3.25%, down from 3.29% the previous business day. A week ago, it was 3.37%. For every $100,000 borrowed, monthly payments would cost about $435.21, or $6.61 less than a week ago.
30-year fixed (FHA): The average rate fell to 3.04% from 3.08% the previous business day. A week ago, it was 3.19%. For every $100,000 borrowed, monthly payments would cost about $423.76, or $8.16 less than a week ago.
30-year fixed (VA): The average rate fell to 3.08% from 3.12% the previous business day. A week ago, it was 3.25%. For every $100,000 borrowed, monthly payments will cost about $425.93, or $9.28 less than a week ago.
https://datawrapper.dwcdn.net/Q4ovs/35/
A lower rate can lower your monthly payment, but it can also give you more buying power, something you’ll want if you’re considering jumping into this fiercely competitive real estate market. For example, at 3% on a 30-year mortgage, your payments for a $380,000 home would be about $1,900 a month, assuming a 20% down payment, typical homeowners’ insurance costs, and property taxes, per our mortgage calculator. If you lock in a rate at 2.9%, though, you’ll have the same monthly payment for a $383,500 home.
15-Year Mortgage Rate Falls
The major advantage of a 15-year fixed mortgageis that it offers a lower interest rate than the 30-year and you’re paying off your loan more quickly, so your total borrowing costs are far lower. But for the same reason—that the loan is paid back over a shorter time frame—the monthly payments will be higher.
15-year fixed: The average rate fell to 2.48% from 2.52% the previous business day. A week ago, it was 2.57%. For every $100,000 borrowed, monthly payments would cost about $665.85, or $4.24 less than a week ago.
Besides fixed-rate mortgages, there are adjustable-rate mortgages (ARMs), where rates change based on a benchmark index tied to Treasury bonds or other interest rates. Most adjustable-rate mortgages are actually hybrids, where the rate is fixed for a period of time and then adjusted periodically. For example, a common type of ARM is a 5/1 loan, which has a fixed rate for five years (the “5” in “5/1”) and is then adjusted every one year (the “1”).
Jumbo Mortgage Rates Are Down
Jumbo loans, which allow you to borrow bigger amounts for more expensive properties, tend to have slightly higher interest rates than loans for more standard amounts. Jumbo means over the limit that Fannie Mae and Freddie Mac are willing to buy from lenders, typically $548,250 for a single-family home (except in Hawaii, Alaska, and a few federally designated high-cost markets, where the limit is $822,375).
Jumbo 30-year fixed: The average rate fell to 3.44% from 3.45% the previous business day. A week ago, it was 3.54%. For every $100,000 borrowed, monthly payments would cost about $445.70, or $5.58 less than a week ago.
Jumbo 15-year fixed: The average rate fell to 3.24% from 3.26% the previous business day. A week ago, it was 3.32%. For every $100,000 borrowed, monthly payments would cost about $702.18, or $3.90 less than a week ago.
Refinance Rates Decline
Refinancing an existing mortgage tends to be slightly more expensive than getting a new one, especially in a low-rate environment.
30-year fixed: The average rate to refinance fell to 3.36% from 3.4% the previous business day. A week ago, it was3.5%. For every $100,000 borrowed, monthly payments would cost about $441.27, or $7.77 less than a week ago.
15-year fixed: The average rate to refinance fell to $2.58% from 2.62% the previous business day. A week ago, it was 2.68%. For every $100,000 borrowed, monthly payments at that rate will cost about $670.56, or $4.74 less than a week ago.
Methodology
Our rates for “today” reflect national averages provided by more than 200 of the country’s top lenders one business day ago, and the “previous” is the rate provided the business day before that. Similarly, the week earlier references compare the data from five business days earlier (so bank holidays are excluded.) The rates assume a loan-to-value ratio of 80% and a borrower with a FICO credit score of 700 to 759—within the “good” to “very good” range. They’re representative of the rates customers would see in actual quotes from lenders, based on their qualifications, and may vary from advertised teaser rates.
U.S. producer prices increased solidly in October, driven by surging costs for gasoline and motor vehicle retailing, suggesting that high inflation could persist for a while amid tight global supply chains related to the pandemic.
The Federal Reserve last week restated its belief that current high inflation is “expected to be transitory.” A tightening labor market as millions remain at home is adding to price pressures, which together with shortages of goods sharply restrained economic growth in the third quarter.
The Fed this month started reducing the amount of money it is injecting into the economy through monthly bond purchases.
“The acceleration in inflation may not fade as quickly as previously thought, particularly for businesses because of the global supply-chain issues,” said Ryan Sweet, a senior economist at Moody’s Analytics in West Chester, Pennsylvania. “Elevated inflation is turning up the heat on the Fed but they haven’t shown signs of buckling as they will stomach higher inflation to get the labor market back to full employment quickly.”
The producer price index for final demand rose 0.6% last month after climbing 0.5% in September, the Labor Department said on Tuesday. That reversed the slowing trend in the monthly PPI since spring. In the 12 months through October, the PPI increased 8.6% after a similar gain in September.
Economists polled by Reuters had forecast the PPI advancing 0.6% on a monthly basis and rising 8.7% year-on-year.
More than 60% of the increase in the PPI last month was due to a 1.2% rise in the prices of goods, which followed a 1.3% jump in September. A 6.7% surge in gasoline prices accounted for a third of the rise in goods prices. There were increases in the prices of diesel, gas and jet fuel as well as plastic resins.
Wholesale food prices dipped 0.1% as the cost of beef and veal tumbled 10.3%. Prices for light motor trucks fell as the government introduced new-model-year passenger cars and light motor trucks into the PPI.
Exorbitant motor vehicle prices have accounted for much of the surge in inflation as a global semiconductor shortage linked to the nearly two-year long COVID-19 pandemic has forced manufactures to cut production, leaving virtually no inventory.
Services gained 0.2% last month after a similar rise in September. An 8.9% jump in margins for automobiles and parts retailing accounted for more than 80% of the increase in services. The cost of transportation and warehousing services jumped 1.7%, also reflecting snarled supply chains.
Surveys from the Institute for Supply Management this month showed measures of prices paid by manufacturers and services industries accelerating in October. Manufacturers complained about “record-long raw materials lead times, continued shortages of critical materials, rising commodities prices and difficulties in transporting products.”
Data on Wednesday is expected to showed strong gains in consumer prices in October, according to a Reuters survey of economists. Stocks on Wall Street retreated from record highs. The dollar was steady against a basket of currencies. U.S. Treasury prices rose.
Inflation
PORT CONGESTION
There is congestion at ports and widespread shortages of workers at docks and warehouses. There were 10.4 million job openings as of the end of August. The workforce is down 3 million from its pre-pandemic level.
Worker shortages were underscored by a report from the NFIB on Tuesday showing almost 50% of small businesses reported job openings they could not fill in October.
Also on Tuesday, Fed Chair Jerome Powell emphasized the U.S. central bank’s commitment to maximum employment, telling a virtual conference on diversity and inclusion in economics, finance and central banking that “an economy is healthier and stronger when as many people as possible are able to work.” read more
Wholesale prices of apparel, footwear and truck transportation of freight also rose last month as did the costs of food and alcohol retailing, hospital outpatient care as well as machinery, equipment parts and supplies.
Excluding the volatile food, energy and trade services components, producer prices shot up 0.4%. The so-called core PPI gained 0.1% in September. In the 12 months through October, the core PPI rose 6.2%. That followed a 5.9% advance in September.
Construction prices surged 6.6%, the largest gain since the series was incorporated into the PPI data in 2009.
“As companies feel the squeeze from higher energy and labor costs, as well as persistent logistics issues, producer price increases should be robust in the coming months,” said Will Compernolle, a senior economist at FHN Financial in New York.
Details of the PPI components, which feed into the personal consumption expenditures (PCE) price index, excluding the volatile food and energy component, were mixed. The core PCE price index is the Fed’s preferred measure for its flexible 2% target. Healthcare costs increased 0.4%. Airline tickets rebounded 0.3%, but portfolio management fees dropped 2.2%.
Though the October CPI data is still pending, economists believed that the core PCE price index moved higher last month after increasing 3.6% year-on-year in September.
“For now, we think the core PCE price index will be up 3.8% year-on-year in October,” said Daniel Silver, an economist at JPMorgan in New York.
A Belgian couple living in the department of Tarn have won €128,000 in damages due to a wind farm near their property.
As we have previously reported on these pages, wind farms are a hotly contested topic in France.
In legal cases each year, the courts often rule in favour of opponents, normally on grounds of protection of the environment or historically important buildings.
Less common are victories by complainants on grounds of nuisance from the wind farm, but in a landmark decision in the court of appeal sitting in Toulouse, a Belgian couple have won €128,000 damages on that basis.
The story began in 2004, when the couple purchased an old farmstead in the village of Fontrieu, located in the natural park of Haut-Languedoc.
The couple restored the property, in the process converting 3 farm buildings into gites.
In 2008/9, a wind farm comprising 6 turbines each 58 metres high was installed on land belonging to the local council, with the nearest turbine 700 metres and the furthest at 1300 metres from their property. The minimal legal distance of a turbine from a residential property is 500 metres.
At the time, the couple made no objections against the new development, and until 2013, the couple obtained relief from the sight and noise of the turbines by a wood located between them and the wind farm.
However, following loss of the woodland through felling that year, the couple began to suffer from a range of health problems, which they considered emanated from the noise created by the turbines. The main symptoms were headaches, dizziness, fatigue, tachycardia, and tinnitus.
The couple stated that the lighting of the wind farm was particularly intense: “The wind turbines emit a flash every two seconds. We were forced to illuminate outside to mitigate the effect of the flashes. In addition, they produce a continuous noise equivalent to that of a washing machine. “
The white flashes of light made them “feel like they were in a permanent thunderstorm. It was a really terrifying visual and auditory assault which was even more unbearable at night,” they stated.
The impact of the disturbance from the turbines on their health became so serious that in 2015, on the advice of their doctor, they vacated their farmstead and relocated to a rental property 17 kms away. Within months of doing so their symptoms had disappeared completely.
The couple made complaints to the wind farm operator without success, and those to the local and departmental councils similarly fell on deaf ears.
As a result, in 2015 they brought a legal action against the wind farm operator, but the local tribunal in Castres rejected their complaint, ruling that the noise and visual intrusion from the wind farm was not so abnormal as to constitute a neighbour nuisance (trouble anormal de voisinage).
The couple appealed the ruling to the court of appeal in Toulouse, who in July found in their favour.
During the proceedings the court heard from a range of experts, with those from the wind farm company stating that it could not be established that there was a causal link between infrasound from the turbines and disorders often invoked by the applicants. They considered that the couple may have been under stress caused by the sight of the wind turbines after the woodland was cut down.
Expert witnesses to the court who had reviewed the scientific literature on the health effects of low sound frequencies and infrasound due to wind turbines concluded that there was an illness known as ‘wind farm syndrome’. The symptoms are very diverse, including general (fatigue, nausea), neurological (headache, tinnitus) or psychological (stress, anxiety), among others. They considered the couple were indeed victims of this syndrome.
The court awarded the couple €128,000, made of up damages caused to their health and to the loss of value to their property. As the period to make an appeal has now passed, the ruling is a final one.
In their report, the court expert interestingly pointed out that although the law relating to the installation of wind farms requires the installation not to be the source of airborne or ground noise, giving maximum noise levels, it does not take into account either very low frequencies or infrasound.
Emmanuel Forichon on behalf of the regional campaign group Toutes Nos Énergies, who supported the couple in their action, stated: “These wind turbines allegedly complied with regulatory noise standards: proof if there were any that these standards need to be reviewed.”
The avocat for the couple Alice Terrace stated: “To my knowledge, this case has no precedent”. However, she cautioned that it could not be universally applied. “But be careful,” she stated, “This wind farm causes an abnormal nuisance in its configuration, but each case is particular and must be examined on its merits.”
Through September 2021 with Forecasts from September 2022
Introduction
The CoreLogic Home Price Insights report features an interactive view of our Home Price Index product with analysis through September 2021 with forecasts from September 2022.
CoreLogic HPI™ is designed to provide an early indication of home price trends. The indexes are fully revised with each release and employ techniques to signal turning points sooner. CoreLogic HPI Forecasts™ (with a 30-year forecast horizon), project CoreLogic HPI levels for two tiers—Single-Family Combined (both Attached and Detached) and Single-Family Combined excluding distressed sales.
The report is published monthly with coverage at the national, state and Core Based Statistical Area (CBSA)/Metro level and includes home price indices (including distressed sale); home price forecast and market condition indicators. The data incorporates more than 40 years of repeat-sales transactions for analyzing home price trends.
HPI National Change
September 2021 National Home Prices
Home prices nationwide, including distressed sales, increased year over year by 18% in September 2021 compared with September 2020. On a month-over-month basis, home prices increased by 1.1% in September 2021 compared with August 2021 (revisions with public records data are standard, and to ensure accuracy, CoreLogic incorporates the newly released public data to provide updated results).
Forecast Prices Nationally
The CoreLogic HPI Forecast indicates that home prices will increase on a month-over-month basis by 0.1% from September 2021 to October 2021, and on a year-over-year basis by 1.9% from September 2021 to September 2022.
“The pandemic led prospective buyers to seek detached homes in communities with lower population density, such as suburbs and exurbs. As we head into 2022, we expect some moderation in the current pattern of flight away from urban cores as the pandemic wanes.”
-Frank Martell President and CEO of CoreLogic
HPI & Case-Shiller Trends
This graph shows a comparison of the national year-over-year percent change for the CoreLogic HPI and CoreLogic Case-Shiller Index from 2000 to present month with forecasts one year into the future. We note that both the CoreLogic HPI Single Family Combined tier and the CoreLogic Case-Shiller Index are posting positive, but moderating year-over-year percent changes, and forecasting gains for the next year.
Economic Impact on Home Prices
Demand for homebuying remained strong through the end of the summer. However, the ongoing housing supply shortage has continued to drive up prices, which increased 18% year over year in September, to record highs creating additional challenges for entry into the homebuying market. High demand and low supply levels for entry-level homes, in particular, are sidelining many would-be first-time buyers.
As millennials continue to make up a large part of homebuying demand and flock to tech hubs like Seattle; San Jose, California and Austin, Texas, we may see this challenge intensify. This is reflected in a recent CoreLogic consumer survey, with 47.9% of this cohort stating they cannot afford to purchase a home in their preferred area.
“Remote work has allowed many employees to buy homes further away from their office. These homes are often in the suburbs or exurbs, where property prices and population density are lower and single-family detached housing more common.”
– Dr. Frank Nothaft Chief Economist for CoreLogic
HPI National and State Maps – September 2021
The CoreLogic HPI provides measures for multiple market segments, referred to as tiers, based on property type, price, time between sales, loan type (conforming vs. non-conforming) and distressed sales. Broad national coverage is available from the national level down to ZIP Code, including non-disclosure states.
Nationally, home prices increased 18% year over year in September. No states posted an annual decline in home prices. The states with the highest increases year-over-year were Idaho (30.1%) and Arizona (29.6%).
HPI Top 10 Metros Change
The CoreLogic HPI provides measures for multiple market segments, referred to as tiers, based on property type, price, time between sales, loan type (conforming vs. non-conforming) and distressed sales. Broad national coverage is available from the national level down to ZIP Code, including non-disclosure states.
These large cities continue to experience price increases in September, with Phoenix leading the way at 31% year over year.
Markets to Watch: Top Markets at Risk of Home Price Decline
While home price changes on the local level vary, September gains across all of the top 10 metros surpassed their 2020 levels. However, metro areas where affordability constraints are prevalent continue to persist as prices rise. For instance, in September, home prices in San Diego increased 22.6% year over year and are forecasted to increase an additional 6.5% over the next 12 months.
Conversely, The HPI Forecast also reveals the continued disparity in home price growth across metros. In markets like Houston, which was hit hard by the collapse of the oil industry and the recent hurricane season, home prices are expected to decline 1.6% by September 2022.
The CoreLogic Market Risk Indicator (MRI), a monthly update of the overall health of housing markets across the country, predicts that metros such Springfield, Massachusett, and Merced, California are at the highest risk (above 70% probability) of a decline in home prices over the next 12 months. Norwich-New London, Connecticut; Reading, Pennsylvia; and Worcester, Massachusetts are also at high risk (50-70%) of a decline.
Summary
CoreLogic HPI features deep, broad coverage, including non-disclosure state data. The index is built from industry-leading real-estate public record, servicing, and securities databases—including more than 40 years of repeat-sales transaction data—and all undergo strict pre-boarding assessment and normalization processes.
CoreLogic HPI and HPI Forecasts both provide multi-tier market evaluations based on price, time between sales, property type, loan type (conforming vs. non-conforming) and distressed sales, helping clients hone in on price movements in specific market segments.
Updated monthly, the index is the fastest home-price valuation information in the industry—complete home-price index datasets five weeks after month’s end. The Index is completely refreshed each month—all pricing history from 1976 to the current month—to provide the most up-to-date, accurate indication of home-price movements available.
Methodology
The CoreLogic HPI™ is built on industry-leading public record, servicing and securities real-estate databases and incorporates more than 40 years of repeat-sales transactions for analyzing home price trends. Generally released on the first Tuesday of each month with an average five-week lag, the CoreLogic HPI is designed to provide an early indication of home price trends by market segment and for the “Single-Family Combined” tier, representing the most comprehensive set of properties, including all sales for single-family attached and single-family detached properties. The indices are fully revised with each release and employ techniques to signal turning points sooner. The CoreLogic HPI provides measures for multiple market segments, referred to as tiers, based on property type, price, time between sales, loan type (conforming vs. non-conforming) and distressed sales. Broad national coverage is available from the national level down to ZIP Code, including non-disclosure states.
CoreLogic HPI Forecasts™are based on a two-stage, error-correction econometric model that combines the equilibrium home price—as a function of real disposable income per capita—with short-run fluctuations caused by market momentum, mean-reversion, and exogenous economic shocks like changes in the unemployment rate. With a 30-year forecast horizon, CoreLogic HPI Forecasts project CoreLogic HPI levels for two tiers — “Single-Family Combined” (both attached and detached) and “Single-Family Combined Excluding Distressed Sales.” As a companion to the CoreLogic HPI Forecasts, Stress-Testing Scenarios align with Comprehensive Capital Analysis and Review (CCAR) national scenarios to project five years of home prices under baseline, adverse and severely adverse scenarios at state, metropolitan areas and ZIP Code levels. The forecast accuracy represents a 95% statistical confidence interval with a +/- 2% margin of error for the index.
About Market Risk Indicator
Market Risk Indicators are a subscription-based analytics solution that provide monthly updates on the overall “health” of housing markets across the country. CoreLogic data scientists combine world-class analytics with detailed economic and housing data to help determine the likelihood of a housing bubble burst in 392 major metros and all 50 states. Market Risk Indicators is a multi-phase regression model that provides a probability score (from 1 to 100) on the likelihood of two scenarios per metro: a >10% price reduction and a ≤ 10% price reduction. The higher the score, the higher the risk of a price reduction.
About the CoreLogic Consumer Housing Sentiment Study 3,000+ consumers were surveyed by CoreLogic via Qualtrics. The study is an annual pulse of U.S. housing market dynamics concentrated on consumers looking to purchase a home, consumers not looking to purchase a home, and current mortgage holder. The survey was conducted in April 2021 and hosted on Qualtrics.
The survey has a sampling error of ~3% at the total respondent level with a 95% confidence level.
Source: CoreLogic The data provided are for use only by the primary recipient or the primary recipient’s publication or broadcast. This data may not be resold, republished or licensed to any other source, including publications and sources owned by the primary recipient’s parent company without prior written permission from CoreLogic. Any CoreLogic data used for publication or broadcast, in whole or in part, must be sourced as coming from CoreLogic, a data and analytics company. For use with broadcast or web content, the citation must directly accompany first reference of the data. If the data are illustrated with maps, charts, graphs or other visual elements, the CoreLogic logo must be included on screen or website.
For questions, analysis or interpretation of the data, contact Amy Brennan at newsmedia@corelogic.com. Data provided may not be modified without the prior written permission of CoreLogic. Do not use the data in any unlawful manner. The data are compiled from public records, contributory databases and proprietary analytics, and its accuracy is dependent upon these sources.
Illustrated Report Highlights
As a courtesy you can download the national historic HPI data here. (Note: this link is a national historical trend report and not the current month CoreLogic Home Price Insights report).
About CoreLogic
CoreLogic is a leading global property information, analytics and data-enabled solutions provider. The company’s combined data from public, contributory and proprietary sources includes over 4.5 billion records spanning more than 50 years, providing detailed coverage of property, mortgages and other encumbrances, consumer credit, tenancy, location, hazard risk and related performance information. The markets CoreLogic serves include real estate and mortgage finance, insurance, capital markets, and the public sector. CoreLogic delivers value to clients through unique data, analytics, workflow technology, advisory and managed services. Clients rely on CoreLogic to help identify and manage growth opportunities, improve performance and mitigate risk. Headquartered in Irvine, Calif., CoreLogic operates in North America, Western Europe and Asia Pacific. For more information, please visit www.corelogic.com.
CORELOGIC, the CoreLogic logo, CoreLogic HPI, CoreLogic HPI Forecast and HPI are trademarks of CoreLogic, Inc. and/or its subsidiaries.