Category Archives: Westchester NY

Rental Glut Sends Chill Through the Hottest U.S. Housing Markets | South Salem Real Estate

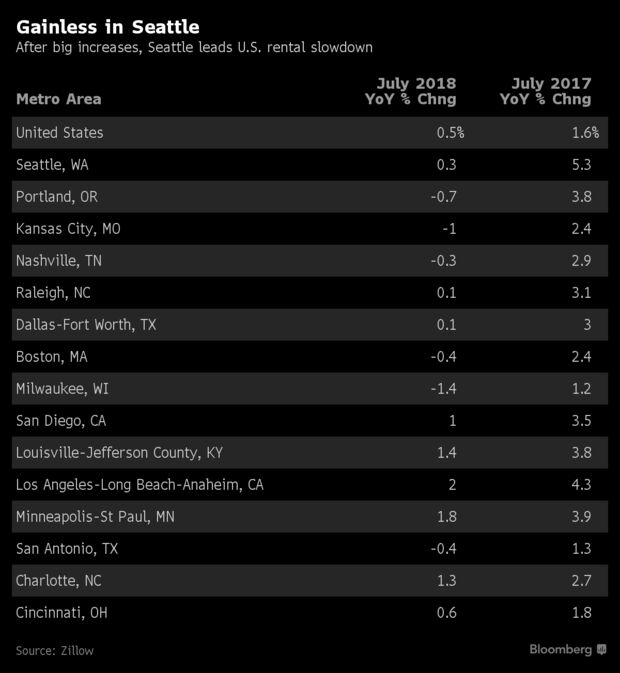
Seattle is known for its hip neighborhoods, soaring home prices, and being home to Amazon.com Inc., the world’s most valuable company. So why is its rental housing market experiencing the most severe slowdown in the U.S.?

Seattle-area median rents didn’t budge in July, after a 5 percent annual increase a year earlier and 10 percent the year before, according to Zillow data on apartments, houses and condos. While that’s the biggest decline among the top 50 largest metropolitan areas, it’s part of a national trend. Rents in Nashville and Portland, Oregon, have actually started falling. In the U.S., rents were up just 0.5 percent in July, the smallest gain for any month since 2012.

“This is something that we first started to see two years ago in New York and D.C.,” Aaron Terrazas, a senior economist at Zillow, said in a phone interview. “A year ago, it was San Francisco and most recently, Seattle and Portland. It’s spreading through what once were the fastest growing rental markets.”

Tenants are gaining the upper hand in urban centers across the U.S. as new amenity-rich apartment buildings, constructed in response to big rent gains in previous years, are forced to fight for customers. Rents are softening most on the high end and within city limits, Terrazas said. Landlords also have been losing customers to homeownership as millennials strike out on their own, often moving to more affordable suburbs.

Boom to Bust  –  Rents go from double-digit gains to declines in four years

Realtor Roy Powell last month was helping his clients, two women in their mid-20s find an apartment in Seattle. They looked at seven places and narrowed it down to two — a five-story building with a rooftop dog park and an air-conditioned gym, and a newly remodeled seven-story tower that won their business by throwing in a year of free underground parking, normally $175 a month.

Even condo owners with just one or two units to rent are offering concessions to compete with new buildings, Powell said. “A lot of them are going from absolutely no pets to allowing pets. That’s a big deal in Seattle, where everybody has a dog or cat.”

‘Tremendous Competition’

Batik, a new 195-unit Seattle apartment building, has views of the downtown skyline and Mount Rainier, a giant rooftop deck with a garden where tenants can grow fruits and vegetables, a community barbecue and an off-leash pet area. New tenants can receive Visa gift cards worth as much as $6,000, with half paid at signing and the rest a month later.

“There is tremendous competition for tenants,” said Lori Mason Curran, spokeswoman for landlord Vulcan Real Estate, Microsoft co-founder Paul Allen’s company, which launched Batik in March. “Over time, we think long-term demand is solid. But there is so much supply tamping down rent growth right now.”

In Seattle, another factor contributed to the glut of rentals. While the city is in the midst of a building boom — with more cranes dotting the skyline than any other in the U.S. — much of the residential multifamily construction has been apartments. Developers have shied away from condos because of state laws that allow buyers to more easily sue if there are defects in the construction.

Booming Construction

U.S. multifamily apartment construction for the past few years have been at levels not seen since the 1980s and rapid rent gains have also encouraged owners of single-family homes and condos to fill them with tenants. Projects opening now were conceived by developers a few years ago when rent gains in the U.S. were peaking at an annual gain of 6.6 percent, according to Zillow data.

The most expensive markets slowed first as new supply became available and tenants struggled to afford rapidly-rising lease rates. Rents in the San Francisco area jumped 19 percent in the year through July 2015. Now, they have been flat since last July. New York rents, which were up 7 percent in 2015, have been decelerating for a couple years, declining 0.4 percent in July.

For the first time since 2010, it’s now easier to build wealth over an eight-year period by renting a home and investing in stocks and bonds, rather than by buying and accumulating equity, according to a national rent-versus-buy index of 23 cities produced by Florida Atlantic University and Florida International University faculty. That’s because home prices are high and rising mortgage rates are adding to the cost of homeownership.

That could be bad for sellers, especially in markets like Dallas and Denver, where renting is now so much more favorable than buying, according to Ken Johnson, a real estate economist at Florida Atlantic University, a co-creator of the Beracha, Hardin & Johnson Buy vs. Rent Index.

Reminiscent of the Bubble

Already, housing markets in strong economies are cooling, in part because incomes haven’t kept pace with rising prices and borrowing costs. Dallas and Denver have reached so far into favorable rental territory that they look like Miami right before it crashed in the last decade, Johnson said.

The difference now is that neither market is experiencing the kind of speculation and risky lending that inflated the last housing bubble, he said.

“What’s interesting is that cities that suffered the least in 2007 and 2008 — Dallas and Denver — now are experiencing the most exposure to risk,” Johnson said.

The slowdown in the rental market coincides with a rise in homeownership among millennials, which jumped to 36.5 percent in the second quarter from 35.3 percent a year earlier.


read more…


https://www.bloomberg.com/news/articles/2018-09-07/rental-glut-sends-chill-through-the-hottest-u-s-housing-markets?srnd=premium

Mortgage rates average 4.54% | Waccabuc Real Estate

Mortgage Rates Move Up Again

MCLEAN, Va., Sept. 06, 2018 (GLOBE NEWSWIRE) — Freddie Mac (OTCQB: FMCC) today released the results of its Primary Mortgage Market Survey® (PMMS®), showing that mortgage rates increased marginally over the past week.

Sam Khater, Freddie Mac’s chief economist, says the 30-year fixed-rate mortgage inched higher for the second straight week. “Borrowing costs may be slowly on the rise again in coming weeks, as investors remain optimistic about the underlying strength of the economy,” he said. “It’s important to note that rates are now up three-quarters of a percentage point from last year and home prices – albeit at a slower pace – are still outrunning rising inflation and incomes.”

Added Khater, “This weakening in affordability is hindering many interested buyers this fall, even as the robust economy brings them into the market. The good news is that purchase mortgage applications have recently rebounded to above year ago levels.”

News Facts

  • 30-year fixed-rate mortgage (FRM) averaged 4.54 percent with an average 0.5 point for the week ending September 6, 2018, up from last week when it averaged 4.52 percent. A year ago at this time, the 30-year FRM averaged 3.78 percent.
  • 15-year FRM this week averaged 3.99 percent with an average 0.4 point, up from last week when it averaged 3.97 percent. A year ago at this time, the 15-year FRM averaged 3.08 percent.
  • 5-year Treasury-indexed hybrid adjustable-rate mortgage (ARM) averaged 3.93 percent with an average 0.3 point, up from last week when it with an average 3.85 percent. A year ago at this time, the 5-year ARM averaged 3.15 percent.

Average commitment rates should be reported along with average fees and points to reflect the total upfront cost of obtaining the mortgage. Visit the following link for the Definitions. Borrowers may still pay closing costs which are not included in the survey.

NYS median sales price rises 11.5% | Waccabuc Real Estate

Homebuyer activity remained strong in May, driving the New York State housing market to the second-highest sales total for the month with 10,348 closings, according to the housing market report released today by the New York State Association of REALTORS. May 2018 closed sales were 8.6 percent lower than the record of 11,322 set in May 2017. The median sales price growth trend continued, increasing by 11.5 percent compared to last May, ending the month at $262,000.

“Robust buyer demand continues to keep homes across the Empire State selling at a brisk pace, despite the lower number of homes listed for sale,” said Duncan R. MacKenzie, CEO of the New York State Association of REALTORS. “Newly listed homes are selling more quickly than a year ago as buyers faced with fewer options are eager to get to the closing table. We believe that without the headwind of lower inventory sales would be near the record-setting levels of a year ago.”

“While growing sales prices may entice current owners to bring greatly needed inventory to the market, the combination of higher prices and growing mortgage rates will begin to erode affordability, potentially dampening buyer enthusiasm,” said MacKenzie.

The May 2018 sales total of 10,348 represents a decrease of 8.6 percent from the May 2017 total of 11,322. Year-to-date (Jan. 1 – May 31) sales were 45,005, a decrease of 3 percent from the same period in 2017.

The May 2018 statewide median sales price was $262,000, an increase of 11.5 percent from the May 2017 median of $235,000. The year-to-date (Jan. 1 – May 31) median sales price was $259,000, an increase of 8.6 percent from the same period in 2017.

Pending sales decreased 4.3 percent in May compared to a year ago to reach 13,633.

The average days on market for home sales closed during May 2018 was 80, a decrease from 87 in May 2017. Year-to-date (Jan. 1 – May 31) days on market for closed sales was 85, down from 93 during the same period in 2017.

The months supply of homes for sale dropped 7.8 percent at the end of May to 5.9 months supply. It was at 6.4 months at the end of May 2017. A 6 month to 6.5 month supply is considered to be a balanced market. Inventory stood at 66,682, a decrease of 6.7 percent compared to May 2017.

Additional data is available at http://www.nysar.com/industry-resources/market-dataOpens a New Window.

Editor’s Note: All data is compiled from multiple listing services in the state of New York and the data include townhomes, condominiums and existing single-family homes.

Millennial homeownership suddenly drops | North Salem Real Estate

Homeownership was crawling slowly back from its record low two years ago, but it just stalled, and the youngest homebuyers are behind that.

Millennials had been driving the nation’s overall homeownership rate, showing the biggest gains throughout 2017, but they dropped back in the first quarter of this year.

Millennial homeownership fell from a three-year high of 36 percent in the fourth quarter of last year back to 35.3 percent in the first quarter of this year, according to the U.S. Census. Meanwhile, the homeownership rate for Americans aged 35 to 64 rose.

That caused the overall homeownership rate to stall at 64.2 percent, unchanged from the last quarter, after rising steadily from 63.6 percent one year ago. Homeownership fell to a 50-year low of 62.9 percent in 2016, after the worst housing crash in history.

The culprit is pretty clear: weakening affordability. Home prices have jumped dramatically in the past year, and the gains accelerated in the first quarter of this year, as the supply of homes for sale continued to drop to record lows. Mortgage interest rates also surged at the start of this year to the highest level in four years.

“Millennials make up the largest share of those seeking starter homes, a portion of the market that saw inventory plummet 14.2 percent and prices leap nearly 10 percent year-over-year in Q1 2017,” wrote Cheryl Young, a senior economist at Trulia.

The supply of starter homes is so lean that March sales were down in that sector over 21 percent compared with a year ago, according to the National Association of Realtors. Sales of higher-priced homes gained.

Homebuilders are moving some production to the lower end, but their focus is on move-up and luxury homes. The median price of a newly built home jumped 5 percent in March annually, reflecting not just housing inflation, but a continuing mix-shift to more expensive homes.

“The homeownership rate climbing out of its 50-year low should be seen as an opportunity for builders in the for-sale space,” noted Young. “The sharp increase in renter households coming out of the Great Recession has finally begun to moderate as older millennials and Gen Xers shift into homeownership, presenting a boon for new construction.

Vacancy rates are down for both owned properties and rentals, meaning there will be no easing of today’s high rents, which should be another impetus for renters to become homeowners. But those high rents make it hard for young buyers to save for a down payment.

And mortgage rates are continuing to move higher. The average rate on the popular 30-year fixed averaged 4.58 percent for the week ended April 26, up from 4.47 percent the previous week and 4.03 percent the same week one year ago.

“Mortgage rates are now at their highest level since the week of August 22, 2013,” said Sam Khater, chief economist at Freddie Mac. “Higher Treasury yields, driven by rising commodity prices, more Treasury issuances and the steady stream of solid economic news, are behind the uptick in rates over the past week.”


read more…

https://www.cnbc.com/2018/04/26/millennial-homeownership-suddenly-drops-after-a-good-run.html?__source=newsletter%7Ceveningbrief

Condemned Silicon Valley home sells for $1.23 million | Waccabuc Real Estate

A condemned home in Northern California — with holes in the roof and mildew inside — recently sold for $1.23 million, becoming the latest example of the Bay Area’s tight housing market.

The home in Fremont was originally listed for $1 million but ended up closing at $230,000 over its asking price, listing agent Larry Gallegos told KTVU.

“We had a couple of offers that were very close. Actually, my client, when I first met them, wanted a little bit more than that with the price they had in their mind. But they ended up being happy with this one,” he said.

A condemned home is seen Wednesday, April 18, 2018, in Fremont, Calif. The condemned Northern California house with holes in the roof and mildew in the pipes sold last month for $1.23 million. (AP Photo/Ben Margot)

The condemned Northern California house with holes in the roof and mildew in the pipes sold last month for $1.23 million.  (AP Photo/Ben Margot)

The home, located about 35 miles southeast of San Francisco, has three bedrooms, two bathrooms, and was condemned in 2013. The two investors who bought the property design green homes, according to Gallegos, and plan to put a 4,000 square-foot “masterpiece” on the lot in Fremont.

Gallegos told the Associated Press the buyers didn’t even enter the house because they had no interest in the actual building but on its location, which could offer a view of the bay from a second story.

Online property records show its assessment is years out of date — its taxable value is listed as $90,000.

David Stark of the Bay East Association of Realtors told KTVU there was “nothing surprising” about the sale.

“It’s a great example of location, location, location,” he said.

Stark told the television station that buying a tear-down to build a dream home reflects a 10-year trend, and that unlike in 2008, current home prices show no indication a crash is coming.

California Home 1

The home in Fremont was condemned in 2013, and has three-bedrooms, and two-bathrooms.  (KTVU)

“People are purchasing homes. They’re purchasing vacant properties like this. The demand is there. The supply isn’t. These prices are sustainable,” he told KTVU.

The median home price in Fremont, which connects to Silicon Valley through several highways and with easy access to San Francisco and Oakland by train, is $1 million as of late February, according to Zillow.com, compared to $1.3 million in San Francisco and $1.28 million in Berkeley.

For residents that have been in the neighborhood for years, the spike in home prices leaves them in a difficult situation.


read more…


http://www.foxnews.com/real-estate/2018/04/19/condemned-california-home-with-holes-in-roof-mildew-sells-for-1-23-million.html

NYS high taxes versus other states | Pound Ridge Real Estate

Tax season can be stressful for the millions of Americans who owe money to Uncle Sam. Every year, the average U.S. household pays more than $5,700 in federal income taxes, according to the Bureau of Labor Statistics. And while we’re all faced with that same obligation, there is significant difference when it comes to state and local taxes. Taxpayers in the most tax-expensive states, for instance, pay three times more than those in the cheapest states.

Surprisingly, though, low income taxes don’t always mean low taxes as a whole. For example, while the state of Washington’s citizens don’t pay income tax, they still end up spending over 8% of their annual income on sales and excise taxes. Texas residents also don’t pay income tax, but spend 1.86% of their income on real estate taxes, one of the highest rates in the country. Compare these to California, where residents owe a little over 4% of their income in sales and excise taxes, and just 0.79% in real estate tax.

As this year’s tax-filing deadline, April 17, comes closer, it’s fair to wonder which states give their taxpayers more of a break. WalletHub searched for answers by comparing state and local tax rates in the 50 states and the District of Columbia against national medians. To illustrate, we calculated relative income-tax obligations by applying the effective income-tax rates in each state and locality to the average American’s income. Scroll down for the complete ranking, commentary from a panel of tax experts and a full description of our methodology.


Main Findings


Taxes by State

Overall Rank (1=Lowest)StateEffective Total State & Local Tax Rates on Median U.S. Household*Annual State & Local Taxes on Median U.S. Household*% Difference Between State & U.S. Avg.**Annual State & Local Taxes on Median State Household***Adjusted Overall Rank (based on Cost of Living Index)
1Alaska5.67%$3,164-47.26%$4,3535
2Delaware6.11%$3,407-43.21%$3,9091
3Montana7.29%$4,066-32.23%$3,9114
4Nevada7.44%$4,145-30.90%$4,1036
5Wyoming7.45%$4,155-30.75%$4,4172
6Tennessee7.98%$4,449-25.84%$3,6673
7Idaho8.48%$4,730-21.16%$4,2167
8California8.77%$4,888-18.51%$7,16736
9Florida8.83%$4,921-17.97%$4,3739
10South Carolina9.02%$5,030-16.16%$4,27811
11Oregon9.20%$5,129-14.51%$5,67734
12Utah9.23%$5,144-14.25%$5,90210
13Colorado9.27%$5,170-13.82%$6,10013
14Alabama9.40%$5,241-12.64%$4,1778
15Arizona9.50%$5,299-11.67%$4,97712
16South Dakota9.75%$5,439-9.34%$4,75716
17North Dakota9.84%$5,488-8.53%$5,49318
18District of Columbia10.00%$5,574-7.09%$8,81146
19New Hampshire10.27%$5,725-4.57%$7,22133
20Hawaii10.33%$5,762-3.96%$8,27751
21West Virginia10.39%$5,791-3.48%$4,34319
22Louisiana10.39%$5,795-3.41%$4,75717
23Georgia10.54%$5,876-2.06%$5,23714
24North Carolina10.64%$5,934-1.09%$5,16720
25Oklahoma10.75%$5,993-0.11%$4,84815
26New Mexico10.82%$6,0310.53%$5,03823
27Virginia10.87%$6,0611.03%$7,27627
28Texas11.04%$6,1562.61%$5,34721
29Vermont11.04%$6,1582.64%$6,80041
30Missouri11.28%$6,2914.86%$5,43522
31Minnesota11.57%$6,4537.56%$7,08531
32Massachusetts11.61%$6,4707.85%$9,39045
33Washington11.68%$6,5148.57%$8,02337
34Maine11.75%$6,5549.24%$6,13342
35Indiana11.86%$6,61410.25%$5,66726
36Maryland11.96%$6,66611.12%$9,55244
37Kentucky12.06%$6,72312.06%$5,29329
38Mississippi12.21%$6,81013.51%$4,95424
39Arkansas12.30%$6,85814.32%$5,14225
40Kansas12.42%$6,92415.41%$6,10428
41Pennsylvania12.45%$6,94015.68%$6,64238
42Michigan12.81%$7,14519.09%$5,84330
43New Jersey12.87%$7,17519.59%$11,23747
44Iowa12.92%$7,20220.05%$6,35432
45Ohio13.09%$7,30021.68%$6,08135
46Wisconsin13.62%$7,59326.56%$7,19340
47Rhode Island13.69%$7,63427.26%$8,69748
48New York13.72%$7,64827.49%$9,75950
49Nebraska13.83%$7,71228.55%$6,77639
50Connecticut13.85%$7,72028.68%$10,41949
51Illinois14.89%$8,29938.34%$8,33043

*Assumes “Median U.S. Household” has an annual income of $55,754 (mean third quintile U.S. income); owns a home valued at $184,700 (median U.S. home value); owns a car valued at $24,000 (the highest-selling car of 2017); and spends annually an amount equal to the spending of a household earning the median U.S. income.
**National Average of State and Local Tax Rates = 10.78%
***Assumes “Median State Household” has an annual income equal to the mean third quintile income of the state; owns a home at a value equal to the median of the state; owns a car valued at $24,000 (the highest-selling car of 2017); and spends annually an amount equal to the spending of a household earning the median state income.

Artwork-Best-&-Worst-States-to-be-a-Taxpayer-2018-v1

Red States vs. Blue States


State & Local Tax Breakdown

All effective tax rates shown below were calculated as a percentage of the mean third quintile U.S. income of $55,754 and based on the characteristics of the Median U.S. Household*.

State

Effective Real-Estate Tax Rate

Real-Estate Tax Rank ($)

Effective Vehicle Property Tax Rate

Vehicle Property Tax Rank ($)

Effective Income Tax Rate

Income Tax Rank ($)

Effective Sales & Excise Tax Rate

Sales & Excise Tax Rank ($)

Effective Total State & Local Tax Rates on Median U.S. Household*

Alabama1.42%2
($791)
0.29%28
($163)
2.68%28
($1,494)
5.01%39
($2,793)
9.40%
Alaska3.93%33
($2,190)
0.00%1
($0)
0.10%6
($56)
1.65%4
($918)
5.67%
Arizona2.56%16
($1,427)
0.72%38
($403)
1.57%13
($873)
4.66%35
($2,595)
9.50%
Arkansas2.08%10
($1,161)
0.43%29
($239)
2.66%27
($1,483)
7.13%50
($3,975)
12.30%
California2.62%17
($1,461)
0.28%27
($156)
1.40%11
($781)
4.47%30
($2,491)
8.77%
Colorado1.90%7
($1,058)
0.77%40
($428)
2.54%25
($1,414)
4.07%24
($2,269)
9.27%
Connecticut6.70%48
($3,733)
1.09%47
($609)
2.25%19
($1,255)
3.81%18
($2,123)
13.85%
Delaware1.81%4
($1,009)
0.00%1
($0)
3.03%33
($1,689)
1.27%3
($708)
6.11%
District of Columbia1.84%5
($1,026)
0.00%1
($0)
3.72%46
($2,072)
4.44%28
($2,475)
10.00%
Florida3.38%27
($1,885)
0.00%1
($0)
0.00%1
($0)
5.45%44
($3,037)
8.83%
Georgia3.07%25
($1,712)
0.00%1
($0)
3.17%35
($1,768)
4.30%26
($2,396)
10.54%
Hawaii0.90%1
($501)
0.00%1
($0)
3.85%47
($2,147)
5.59%46
($3,115)
10.33%
Idaho2.52%13
($1,404)
0.00%1
($0)
2.13%16
($1,185)
3.84%20
($2,141)
8.48%
Illinois7.69%50
($4,288)
0.00%1
($0)
2.82%30
($1,572)
4.37%27
($2,439)
14.89%
Indiana2.88%23
($1,606)
0.54%33
($300)
3.71%45
($2,068)
4.73%36
($2,640)
11.86%
Iowa4.95%38
($2,762)
0.43%30
($240)
3.03%34
($1,691)
4.50%31
($2,509)
12.92%
Kansas4.63%37
($2,580)
0.89%43
($495)
1.78%15
($994)
5.12%40
($2,855)
12.42%
Kentucky2.83%21
($1,579)
0.52%31
($292)
4.87%51
($2,716)
3.83%19
($2,135)
12.06%
Louisiana1.68%3
($934)
0.04%25
($24)
2.17%18
($1,212)
6.50%49
($3,624)
10.39%
Maine4.38%35
($2,444)
1.03%45
($576)
2.54%26
($1,416)
3.80%17
($2,117)
11.75%
Maryland3.64%31
($2,030)
0.00%1
($0)
4.30%49
($2,395)
4.02%23
($2,241)
11.96%
Massachusetts4.01%34
($2,238)
0.97%44
($540)
3.67%44
($2,046)
2.95%6
($1,646)
11.61%
Michigan5.66%43
($3,158)
0.25%26
($142)
3.32%37
($1,850)
3.58%11
($1,995)
12.81%
Minnesota3.86%32
($2,155)
0.56%35
($311)
2.94%32
($1,640)
4.21%25
($2,347)
11.57%
Mississippi2.64%19
($1,470)
1.46%49
($813)
2.34%21
($1,303)
5.78%47
($3,224)
12.21%
Missouri3.30%26
($1,842)
1.08%46
($600)
2.91%31
($1,625)
3.99%22
($2,224)
11.28%
Montana2.82%20
($1,570)
0.55%34
($307)
2.76%29
($1,541)
1.16%2
($646)
7.29%
Nebraska6.05%45
($3,371)
0.69%36
($383)
2.53%24
($1,410)
4.57%32
($2,548)
13.83%
Nevada2.56%15
($1,425)
0.76%39
($423)
0.53%8
($295)
3.59%12
($2,002)
7.44%
New Hampshire7.24%49
($4,038)
0.77%41
($432)
0.60%9
($335)
1.65%5
($920)
10.27%
New Jersey7.96%51
($4,437)
0.00%1
($0)
1.40%11
($781)
3.51%9
($1,957)
12.87%
New Mexico2.53%14
($1,408)
0.00%1
($0)
2.16%17
($1,204)
6.13%48
($3,419)
10.82%
New York5.48%42
($3,057)
0.00%1
($0)
3.49%40
($1,945)
4.75%37
($2,647)
13.72%
North Carolina2.84%22
($1,581)
0.54%32
($299)
3.62%43
($2,018)
3.65%15
($2,035)
10.64%
North Dakota3.49%28
($1,947)
0.00%1
($0)
0.78%10
($432)
5.58%45
($3,108)
9.84%
Ohio5.18%40
($2,890)
0.00%1
($0)
3.34%38
($1,862)
4.57%33
($2,548)
13.09%
Oklahoma2.94%24
($1,638)
0.00%1
($0)
2.44%23
($1,360)
5.37%42
($2,994)
10.75%
Oregon3.53%30
($1,970)
0.00%1
($0)
4.74%50
($2,640)
0.93%1
($519)
9.20%
Pennsylvania5.14%39
($2,867)
0.00%1
($0)
3.90%48
($2,174)
3.40%8
($1,898)
12.45%
Rhode Island5.46%41
($3,047)
2.05%51
($1,144)
2.30%20
($1,282)
3.88%21
($2,162)
13.69%
South Carolina1.89%6
($1,056)
1.17%48
($651)
2.35%22
($1,310)
3.61%14
($2,013)
9.02%
South Dakota4.39%36
($2,446)
0.00%1
($0)
0.00%1
($0)
5.37%41
($2,992)
9.75%
Tennessee2.47%12
($1,376)
0.00%1
($0)
0.10%6
($56)
5.41%43
($3,017)
7.98%
Texas6.16%46
($3,435)
0.00%1
($0)
0.00%1
($0)
4.88%38
($2,720)
11.04%
Utah2.22%11
($1,240)
0.00%1
($0)
3.35%39
($1,869)
3.65%15
($2,035)
9.23%
Vermont5.89%44
($3,285)
0.00%1
($0)
1.61%14
($896)
3.55%10
($1,977)
11.04%
Virginia2.63%18
($1,467)
1.74%50
($971)
3.49%41
($1,947)
3.00%7
($1,675)
10.87%
Washington3.52%29
($1,962)
0.00%1
($0)
0.00%1
($0)
8.16%51
($4,552)
11.68%
West Virginia1.94%8
($1,082)
0.71%37
($398)
3.29%36
($1,833)
4.44%29
($2,478)
10.39%
Wisconsin6.46%47
($3,602)
0.00%1
($0)
3.56%42
($1,985)
3.60%13
($2,006)
13.62%
Wyoming2.03%9
($1,130)
0.77%41
($432)
0.00%1
($0)
4.65%34
($2,593)
7.45%

*Assumes “Median U.S. Household” has an income equal to $55,754 (mean third quintile U.S. income); owns a home valued at $184,700 (median U.S. home value); owns a car valued at $24,000 (the highest-selling car of 2017); and spends annually an amount equal to the spending of a household earning the median U.S. income.


Ask the Experts: Best Tax Advice

For more insight into the impact state and local taxes have on migration and public policy, we turned to a panel of leading tax and policy experts. You can check out their bios and responses below.

  1. Do people usually consider taxes when deciding where to live? Should they?
  2. How can state and local tax policy be used to attract new residents and stimulate growth?
  3. Which states have particularly complicated tax rules for families?
  4. How has the total amount families pay in state and local taxes changed as a result of the new tax code?
  5. Which states have the best mix of taxes and government services?
  6. Should people pay taxes based on where they live or where they work?

read more…


https://wallethub.com/edu/best-worst-states-to-be-a-taxpayer/2416/

New home sales fall again | Waccabuc Real Estate

Sales of new single-family houses in the United States shrank 0.6 percent month-over-month to a seasonally adjusted annual rate of 618 thousand in February of 2018 from an upwardly revised 622 thousand in January. It is the lowest reading in four months and compares with market forecasts of a 4.4 percent rise to 623 thousand. Sales fell in the West and the Midwest. New Home Sales in the United States averaged 650.65 Thousand from 1963 until 2018, reaching an all time high of 1389 Thousand in July of 2005 and a record low of 270 Thousand in February of 2011.


US New Home Sales Fall for 3rd Month

Sales of new single-family houses in the United States shrank 0.6 percent month-over-month to a seasonally adjusted annual rate of 618 thousand in February of 2018 from an upwardly revised 622 thousand in January. It is the lowest reading in four months and compares with market forecasts of a 4.4 percent rise to 623 thousand. Sales fell in the West and the Midwest.

Sales fell in the West (-17.6 percent to 164 thousand) and the Midwest (-3.7 percent to 79 thousand) but rose in the South (9 percent to 338 thousand) and the Northeast (19.4 percent to 37 thousand).
The median sales price of new houses sold was $326,800, above $298,000 a year earlier. The average sales price was $376,700, also higher than $370,500 in February of 2017.
The stock of new houses for sale went up 2 percent from the previous month to 305 thousand, the highest level since March of 2009. This represents a supply of 5.9 months at the current sales rate.
Year-on-year, new home sales edged up 0.5 percent.
read more…
https://tradingeconomics.com/united-states/new-home-sales

Fed raises rates | Pound Ridge Real Estate

Federal Reserve officials, meeting for the first time under Chairman Jerome Powell, raised the benchmark lending rate a quarter-point and forecast a steeper path of hikes in 2019 and 2020, citing an improving economic outlook. Policy makers continued to project a total of three increases this year.

“The economic outlook has strengthened in recent months,” the policy-setting Federal Open Market Committee said in a statement Wednesday in Washington. Officials repeated previous language that they anticipate “further gradual adjustments in the stance of monetary policy.”

The upward revision in their rate path suggests Fed officials are looking through soft first-quarter economic reports and expect a lift this year and next from tax cuts passed by Republicans in December. Financial conditions have tightened since late January as investors look for signs that the central bank might raise rates at a faster pace, while forecasters predict stronger U.S. growth and tight labor markets.

The vote to lift the federal funds rate target range to 1.5 percent to 1.75 percent was a unanimous 8-0.

The latest set of quarterly forecasts forecasts showed that policy makers were divided over the outlook for the benchmark interest rate in 2018. Seven officials projected at least four quarter-point hikes would be appropriate this year, while eight expected three or fewer increases to be warranted.

In the forecasts, U.S. central bankers projected a median federal funds rate of 2.9 percent by the end of 2019, implying three rate increases next year, compared with two 2019 moves seen in the last round of forecasts in December. They saw rates at 3.4 percent in 2020, up from 3.1 percent in December, according to the median estimate.

Inflation Pickup

In another change to the statement, the Fed said inflation on an annual basis is “expected to move up in coming months,” after saying “move up this year” in the January statement. Price gains are still expected to stabilize around the Fed’s 2 percent target over the medium term, the FOMC said.

The central bank’s preferred price gauge rose 1.7 percent in the 12 months through January and officials projected it to rise to 2 percent in 2019 and hit 2.1 percent the following year, the latest estimates showed. The estimates for inflation excluding food and energy, which officials see as a better way to gauge underlying price trends, rose to 2.1 percent in 2019 and 2020 from 2 percent seen in December.

“Job gains have been strong in recent months, and the unemployment rate has stayed low,” the FOMC said. The statement said that household spending and business investment “have moderated” from strong fourth-quarter readings.

The statement also repeated previous language that “near-term risks to the economic outlook appear roughly balanced.”

Powell will hold his first post-FOMC press conference at 2:30 p.m. local time.

Supply, Demand

The Fed’s goal is to keep supply and demand in balance in the economy amid a tight labor market, without lifting borrowing costs so quickly that the economy stalls.

Officials have had to factor in the impact of fiscal stimulus signed by President Donald Trump since their previous projections.

The median estimate for economic growth this year rose to 2.7 percent from 2.5 percent in December, signaling confidence in U.S. consumers despite recent weak readings on retail sales that have pushed down tracking estimates of first-quarter activity. The 2019 estimate rose to 2.4 percent from 2.1 percent.

The committee’s forecast for the long-run sustainable growth rate of the economy was unchanged at 1.8 percent, suggesting policy makers are still skeptical of the effect of tax cuts on the economy’s capacity for growth. The 2020 gross domestic product growth median projection was also unchanged at 2 percent.

While U.S. unemployment of 4.1 percent is the lowest since 2000, wage growth has remained moderate and inflation has been below the Fed’s target for most of the last five years.

The median projection for the long-run fed funds rate ticked up to 2.9 percent from 2.8 percent in December. The Fed had been gradually reducing its estimate of the long-run neutral fed funds rate since it began publishing its calculations in January 2012.


read more…


https://www.bloomberg.com/news/articles/2018-03-20/

London prices falling | Waccabuc Real Estate

House prices in some of London’s wealthiest boroughs plummeted as much as 14.9% in the year to January, dragging down the average price in the capital—and in England—according to a report Monday by real estate consultants Acadata.

Prices in the capital fell 0.8% in January from December, to £593,396 (US$825,318). That’s down 2.6% annually, the report said, the biggest fall since August 2009, when the recession was still in full swing.

Price growth across the U.K. has likely been weighed down by uncertainties surrounding Brexit, along with 2016’s 3% surcharge on second homes and buy-to-let properties. “Subsequent to the introduction of this tax, the rates of price growth have been falling, and at an accelerated rate since September 2017,” the report said.

No doubt the fall is more acutely felt in London, a hotspot for international investors.

The biggest drops were logged in the priciest boroughs.

Wandsworth saw the largest dip, with the average price declining 14.9% in the year to January, to £685,567 (US$953,514) from £805,460 (US$1.12 million) the prior year. The City of London followed, where prices are now £844,768 (US$1.17 million), down 10.8% from last January and in Islington, prices are down 8.8% to £684,869 (US$952,543).

But in the city’s most expensive borough, Kensington and Chelsea, prices rose 4.6% up to £2.16 million (US$3 million).

Combined, the most expensive 11 boroughs fell by 3.8%, while mid-priced boroughs are down an average 2.7%, according to the report.

The less expensive boroughs fared better. More than half logged price rises over the last year, led by Bexley, which saw its average price rise 4.5% to £363,082 (US$504,988). In Barking and Dagenham, which has the lowest priced property in the capital, according to the report, prices inched up 0.1% to £300,627 (US$418,124).

Brent, in northwest London and home to Wembley Stadium, logged the largest price increases, up 8.5% to £587,372 (US$816,940).


read more…

www.mansionhomes.com

Mid century modern homes | Waccabuc Real Estate

In September, this renovated four-bedroom, two-bath midcentury wowed us with a black exposed-steel frame, white glazed brick, and huge floor-to-ceiling glass sliders.
 Photo by Carlos Marques with Marcott Studios and courtesy of Houlihan Lawrence

It doesn’t seem possible, but midcentury modern design likely became even more popular in 2018 than before. The meteoric rise of the architectural and design style has been aided by shows like Mad Men and pushed into homes through big-box retailers like Target. But a good Eames chair aside, nothing quite compares to a midcentury modern building.

Boasting timeless design in a hot real estate market, the homes of 2018 were a diverse blend of styles from the 1950s and 1960s. We saw a wealth of midcentury gems, ranging from boxy glass houses to post-and-beam stunners. Whether your taste skews organic and natural or colorful and bold, there’s something for everyone on this list.

Without further ado, here are 11 incredible midcentury modern homes that came on the market this year.

1. A cantilevered midcentury home near San Francisco

Courtesy of Red Oak Realty

Designed by AIA Gold Medal architect Joseph Esherick, this multi-level wood-framed home towers above a sloped site in Montclair Hills and frames breathtaking views of the Golden Gate and Bay Bridges. Almost treehouse like in its aesthetics, the 2,391-square-foot four-bedroom boasts a series of decks, balconies, walkways, cantilevers, and staircases that creates a dynamic space both inside and out.

2. A Mies-inspired glass house in Tennessee

Photo by Robert Batey Photography and courtesy of Barbara Apking of Coldwell Banker

A boxy one-bedroom, one-bath home where you can live out your Farnsworth House dreams. Built by longtime University of Tennessee architecture professor William Starke Shell, the 1,600-square-foot home features a flat roof, 40-by-40 steel beams, and huge glass panels. According to the Knoxville News Sentinel, Shell earned a master’s of architecture from Columbia University before working with Mies in Chicago.

3. A modest 1950s home ripped straight out of a magazine

Flat-roofed wood-framed house on woodsy lot.Photo courtesy of Lori Foulke/Keller Williams

Not every home we loved this year was a starchitect-designed multi-million dollar listing. This modest home in Bayside, Wisconsin, listed for a reasonable $410,000 but boasted original details. The flat-roofed wooden construction unfurls across 2,100 square feet, with an open-concept living, a teal kitchen, and a dining area running the entire length of the house. Here, walls of glass frame views of the yard, while new Acid Brick Flooring complements a double-faced stone fireplace and wood paneling.

4. A circular midcentury house in Florida

Photo by Rich Montalbano courtesy of Modern Sarasota

Here’s another fantastic midcentury home from the Sarasota School of Architecture, a regional modernist style that emerged after the war in and around Sarasota, Florida, and which counts Paul Rudolph and William Rupp among its notable architects. What sets this one apart is its completely circular design. Measuring approximately 2,714 square feet, the home features 18-foot ceilings, a cantilevering flat roof, clerestory windows circling the top of the curved walls, and soaring, double-height spaces.

5. An affordable midcentury gem in Illinois

Photo courtesy of Lora Smith Keller Williams

The 2,522-square-foot house was built in 1962 by Verne Lars Solberg, a successful commercial architect in northern Illinois. While at the University of Oklahoma, Solberg met Ross and Eleanor Graves—whose father worked Wright’s land in Wisconsin—and it was Ross Graves who introduced Solberg to Wright’s organic style. When a doctor in Polo asked Solberg to design a house, the architect was given free range to design whatever he saw fit; this Usonian-style, three-bedroom, two-bath stunner was the result.

6. A post-and-beam jewel on Bainbridge Island

Post-and-beam home with glass walls tucks into side of mountain in forest.Photo via Sotheby’s International Realty

Designed in 1965 for Jack Christiansen, the pioneering engineer behind Seattle’s Kingdome roof and many other iconic buildings throughout the state, the post-and-beam waterfront residence appears to be virtually untouched and beautifully maintained over the years. The structure features an expansive deck propped on a concrete dais with a plethora of midcentury details—think glass and wood construction, Japanese-inspired beams, wood screens, and glazed expanses that frame stunning water and mountain views.

7. A renovated masterpiece in New York

Photo by Carlos Marques with Marcott Studios and courtesy of Houlihan Lawrence

Located in Armonk, New York, about 50 minutes north of the city, this four-bedroom, two-bath midcentury was built in 1957 by architect Arthur Witthoefft of Skidmore, Owings & Merrill. The home is a 25-by-95 foot rectangle featuring a black exposed-steel frame, white glazed brick, and huge floor-to-ceiling glass sliders. It sits on a sloping site, surrounded by the forrest of Westchester County, and multi-year renovations overseen by Witthoefft in 2007 brought the home back to its glory days.

8. A stunning midcentury by a Wright apprentice in Memphis

Photo courtesy of Crye-Leike/Luxury Portfolio International®

This four-bedroom, three-and-a-half-bath home was designed by E. Fay Jones in 1964 to respect and highlight the serene forest on the 1.27-acre property. A Frank Lloyd Wright apprentice with a lengthy career of his own, Jones made a name for himself building airy structures in forested areas, many in the Ozarks. It’s a masterclass in the Prairie style; an interior of cypress wood, Arkansas field stone, and flagstone floors is carefully balanced with giant floor-to-ceiling glass windows that provides views into the trees outside.

9. An Oregon A-frame midcentury home with a gorgeous atrium

Photo by Boone Brothers Media, courtesy of Marisa Swenson Modern Homes Portland – Living Room Realty

Built by prolific Portland builder Robert Rummer in 1969, the house boasts Rummer’s classic post-and-beam design with a soaring atrium. The high-pitched, double-gable design anchors a floor plan that wraps around the central atrium, resulting in rooms flooded with light. Giant skylights also create an airy ambiance, but the home feels cozy thanks to Rummer’s use of wood and paneling.

10. A Palm Springs pad perfect for indoor-outdoor living

Low, flat-roofed home with a facade made up of stone isosceles trapezoidal piers with mountains and palm trees surrounding.Photo by Patrick Ketchum via Zillow and HomeSmart

This groovy midcentury modern home located in the Twin Palms neighborhood of Palm Springs starts with an unforgettable facade of stone “isosceles trapezoidal piers” and aquamarine double doors and culminates in impressive outdoor spaces that include a pool and multiple patios.

11. An untouched time capsule in Georgia

Photo by Home Tour America, courtesy of Bedgood and Associates

Sitting on the top of a hill on a one acre lot about 45 minutes from Atlanta, this four-bedroom Eichler-inspired house maintains most of its original features. The large and open living room area boasts soaring tongue and groove ceilings with a massive crab orchard stacked stone fireplace. East facing clerestory windows and a glassed sunroom extends the length of the rear of the home to let in light, contrasting with the warm wood-paneled interiors.

read more…

https://www.curbed.com/2018/12/26/18148640/midcentury-modern-homes-for-sale