Category Archives: blog

Property taxes are only part of the picture | South Salem Real Estate

Cul-de-sac image via Shutterstock.Cul-de-sac image via Shutterstock.

Do you think your state’s property tax burden is too high?

Before you start complaining how high property taxes are in your state, take a look at the charts below to see not only property taxes are in your state, but total taxes.

Your property taxes may be high for a reason — for example, if, like Florida, your state has no income tax.

First, see how property taxes in your state compare with those in the other 49 states. The following chart shows the amount of local and state property taxes collected per capita in each state in 2009.

Property tax collections by state

StateProperty tax collections, per capitaRank
Alabama$50350
Alaska$1,72810
Arizona$1,11932
Arkansas$54949
California$1,46515
Colorado$1,27724
Connecticut$2,4732
Delaware$71243
Florida$1,58913
Georgia$1,09234
Hawaii$98335
Idaho$81340
Illinois$1,7829
Indiana$1,12431
Iowa$1,30522
Kansas$1,35319
Kentucky$66346
Louisiana$70245
Maine$1,64011
Maryland$1,20527
Massachusetts$1,8748
Michigan$1,45216
Minnesota$1,34620
Mississippi$79341
Missouri$92937
Montana$1,30123
Nebraska$1,43717
Nevada$1,31821
New Hampshire$2,2403
New Jersey$2,6631
New Mexico$60647
New York$2,1365
North Carolina$86738
North Dakota$1,16529
Ohio$1,13530
Oklahoma$59748
Oregon$1,17228
Pennsylvania$1,22725
Rhode Island$2,0187
South Carolina$97036
South Dakota$1,11133
Tennessee$74842
Texas$1,47514
Utah$86339
Vermont$2,0566
Virginia$1,43118
Washington$1,22626
West Virginia$70944
Wisconsin$1,63312
Wyoming$2,2854

Source: taxfoundation.org.

– See more at: http://www.inman.com/2013/05/03/property-taxes-are-only-part-of-the-picture/#sthash.rztFC7l4.dpuf

NY losing all its old churches | Katonah NY Real Estate

Neighbors and parishioners of an East Village church are steaming mad over a developer’s plans to demolish the 96-year-old building for market-rate apartments — and it’s just one of many historic holy houses in need of divine intervention.

Douglas Steiner, head of the Brooklyn Navy Yard’s Steiner Studios, bought Mary Help of Christians on East 12th Street for $41 million in November. Now he has permits to raze the sacred site, which includes a rectory, school and parking lot, for residential property with ground-floor retail.

But preservationists say the Roman Catholic church can be saved.

Mary Help of Christians, built in 1917 in the East Village, will be razed for residential.

Helayne Seidman
Mary Help of Christians, built in 1917 in the East Village, will be razed for residential.
The Church of the Redeemer, built in 1866 in Boerum Hill, may face the wrecking ball.

J.C. Rice
The Church of the Redeemer, built in 1866 in Boerum Hill, may face the wrecking ball.

“This is heartbreaking,” said Andrew Berman, executive director of the Greenwich Village Society for Historic Preservation. “We hope [Steiner] can see the light and realize it’s advantageous to use something that’s special rather than demolishing it for something that’s a dime a dozen.”

The church closed in September as part of the Archdiocese’s plan to shut down 21 parishes due to declining attendance.

Nicholas Serracino, the Archdiocese’s chief architect at the time, styled the Italian Renaissance Revival church after Italy’s Basilica of Mary Help of Christians.

Also likely condemned to the wrecking ball is the 140-year-old St. Vincent de Paul on West 23rd Street in Chelsea.

The church’s former pastor, the Rev. Gerald Murray, told The Post the Archdiocese plans to sell the building, which was given a Classical Revival limestone façade in 1939.

In Soho, the century-old Our Lady of Vilnius is on the market for $13 million — more than a year after parishioners lost a lawsuit against the Archdiocese to stop the Romanesque Revival church’s demolition.

Boerum Hill locals have so far delayed the demise of Church of the Redeemer, which was rumored to be knocked down for a new residential building and church hybrid.

The 150-year-old Gothic Revival building closed last summer because it is structurally unsound. A spokesman for the Episcopal Diocese of Long Island, which owns the property, says church officials are still weighing their options for the site.

Meanwhile, Harlem residents are bristling at the partial demolition of St. Thomas the Apostle, a 106-year-old Roman Catholic parish on West 118th Street. The Gothic Revival church was first established for Irish immigrants.

Still, miracles do happen. St. Brigid’s Church in the East Village was spared the wrecking ball in 2008 after an anonymous $20 million donation. It reopened in January


http://www.nypost.com/p/news/local

Positive Equity is Driving Down Defaults | Bedford Hills Real Estate

Homeowners with positive equity in their homes have fewer problem loans and are outperforming the national average for defaults. Their default rates are close to pre-crisis norms.

The latest data from Lender Processing Servicers shows that the overall equity trend has been a very positive one. “LPS’ latest data shows that the share of loans with LTVs greater than 100 percent has fallen 41 percent from a year ago. In total, there were approximately 9 million such loans, or about 18 percent of active mortgages. Some states, including the so-called ’sand states’ (Arizona, Florida, Nevada and California), are still well above the national level, at an average 28 percent, but they, too, have seen improvement over the last year, with negative equity dropping over 40 percent across those four states since January 2012, said LPS Applied Analytics Senior Vice President Herb Blecher.

However, March data also showed that the further underwater a borrower gets, the higher those problem rates rise. Borrowers with loan-to-value (LTV) ratios of just 100-110 percent are actually defaulting at more than twice the national average. For those 50 percent or more underwater, we see new problem rates of 4 percent.

“There has always been a clear correlation between higher levels of negative equity and new problem loan rates,” Blecher said.

LPS reported foreclosure starts were down 8.2 percent month over month, while foreclosure sales rose 10.1 percent. LPS looked more specifically at that situation in California, where the recent passage of the Homeowner Bill of Rights (HBoR) appears to have slowed down the foreclosure sale process considerably. In Q1 2013, foreclosure sales nationally (excluding California) increased 13 percent from Q4 2012, whereas in California they fell 35 percent during that same period.

However, the HBoR does not seem to have had a similar effect on the state’s foreclosure starts which, while down significantly from 2012 levels, are in line with the rest of the nation’s decline in referral activity following the attorneys general mortgage settlement and FHA modification initiatives.


http://www.realestateeconomywatch.com/2013/05

8 Ways to Create the Perfect Facebook Post | Armonk Realtor

We recently updated our Superlist of Social Media and Content Marketing Case Studies and one of the enhancements that people really like is the Facebook Page section.  This section provides examples of the myriad ways smart  companies are using their Facebook pages successfully to engage customers and grow their businesses.

I recently discovered a terrific Blueprint for the Perfect Facebook Page Infographic from Salesforce that provides great tips for creating the perfect Facebook post.   In sum, the recommendations are:

  1. Keep your post copy short and your tone personal.
  2. Target your audience by location or language.
  3. Use a call-to-action hyperlink to a page on your website.
  4. Achieve more impact by including an attractive, relevant photo with your post.
  5. Reach more fans with a sponsored story within 24 hours of your posting.
  6. Don’t be a passive poster. Engage by asking questions and adding comments.
  7. Post with mobile users in mind: short simple copy , images and video.
  8. Evaluate what’s working and what’s not by reviewing the “Engaged Fans” metric on your Insights Page.If you want to see examples of how companies are using Facebook

Go grab this terrific infographic right now and keep it handy.

Read more: http://www.interactiveinsightsgroup.com/blog1/ways-to-create-the-perfect-facebook-post/#ixzz2SVy0IF25

A Step-by-Step Guide to Building an Excel Graph [Quick Tip] | Chappaqua NY Realtor

Building graphs is part of most people’s jobs — they’re the best way to present information in a clear, easily digestible manner that can then serve to influence the decision-making process within an organization. But there are some people out there that get a little bit intimidated by the prospect of poking around in Excel. I, however, adore the thing (I work in Marketing Ops, so it’s pretty much a requirement).

So I thought I’d share some step-by-step instructions for anyone out there that cringes at the thought of sorting a spreadsheet full of data into a chart that actually, you know,means something. Here are the simple steps you need to build a graph in Excel.

Step 1: Get your data into Excel.

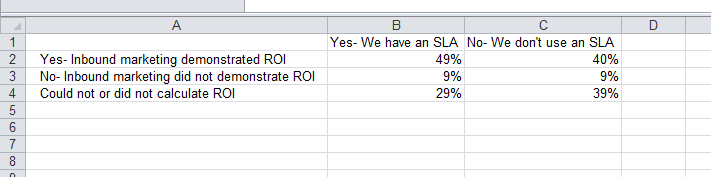
First, you need to input your data into Excel. This is the easy part! You may have exported the data from elsewhere, like a piece of marketing software or a survey tool. Or, you might be inputting it manually.

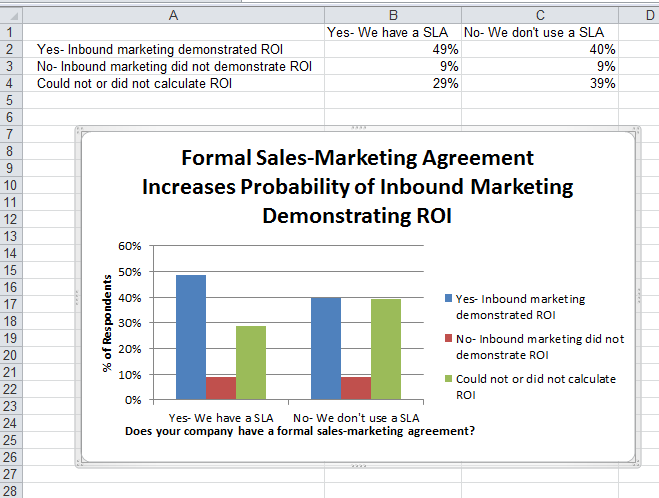
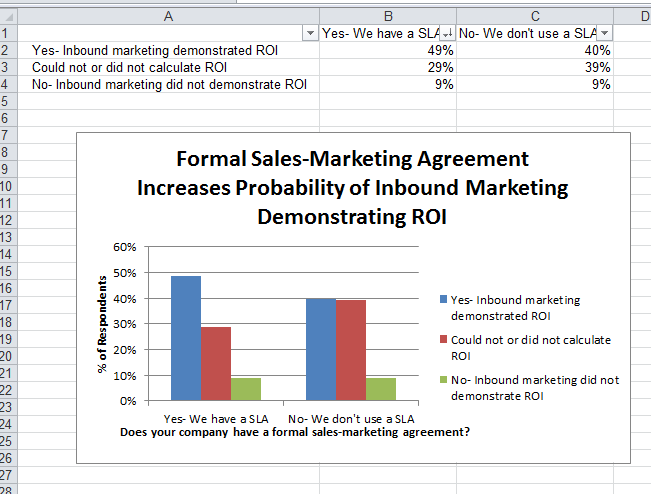
In the example below, in Column A, I have a list of the responses to the question “Did inbound marketing demonstrate ROI?”, and in Columns B,C, and D, I have the responses to the question “Does your company have a formal sales-marketing agreement?”. For example, Column C, Row 2 illustrates that 49% of people who have an SLA also say that inbound marketing demonstrated ROI.

excelgraphblogpostpicture1

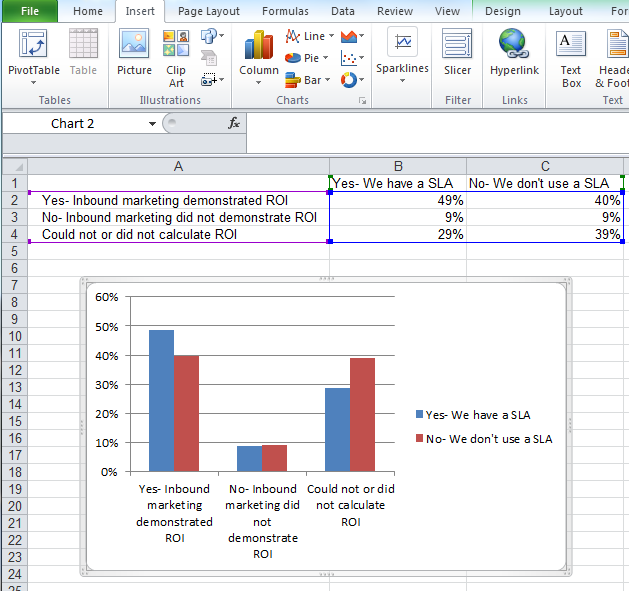
Step 2: Choose a type of graph to create.

You have plenty of choices for charts and graphs to create. This data will look best in a bar graph, so let’s pursue making that one. To make a bar graph, highlight the data and include the titles of the X and Y axis. Go to the ‘Insert’ tab, click ‘Charts,’ click ‘Column,’ and choose the graph you wish (in this example I will be picking the first 2-D Column choice — just because I prefer it over the 3-D look).

finalgraphmay4blogstep2

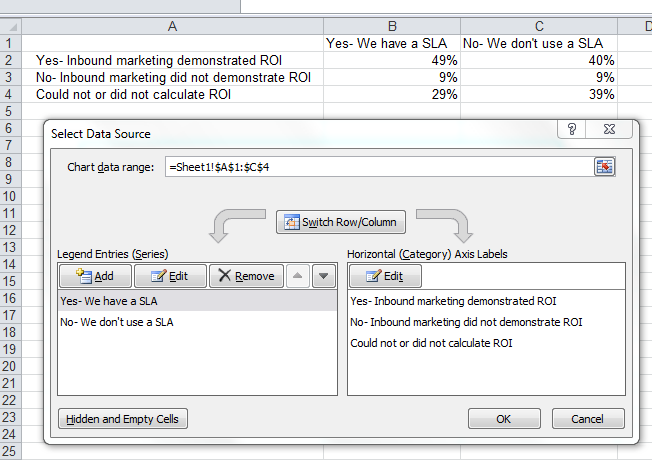
Step 3: Switch axes, if necessary.

If you want to switch what appears on the X and Y axis, right click on the bar graph, click ‘Select Data,’ and click ‘Switch Row/Column.’

finalgraphmay4blogstep3

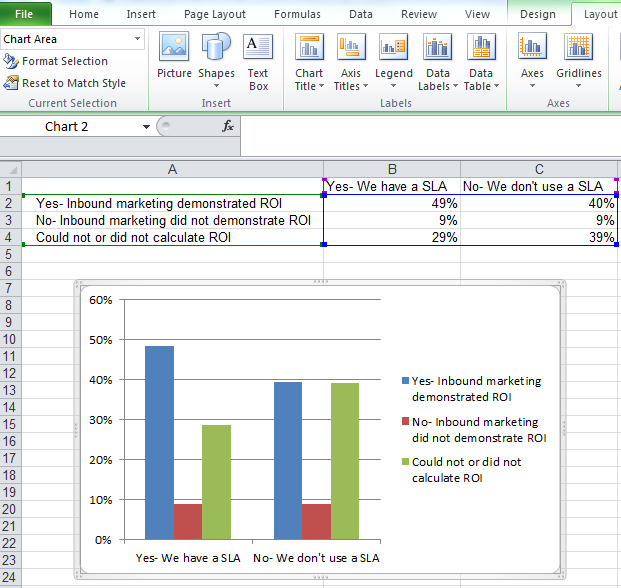
Step 4: Adjust your labels and legends, if desired.

To change the layout of the labeling and legend, click on the bar graph, then click the ‘Layout’ tab. Here you can choose what layout you prefer for the chart title, axis titles, and legend.

In my example, I clicked on ‘Chart Title,’ and selected ‘Above Chart.’ To format the X axis title, I clicked on ‘Axis Titles’, clicked ‘Primary Horizontal Axis Title’, and clicked ‘Title Below Axis.’ To format the Y axis title, I clicked on ‘Axis Titles,’ clicked ‘Primary Vertical Axis Title,’ and chose ‘Rotated Title.’ To change the placement of the legend, click ‘Legend’ on the ‘Layout’ tab and choose your preferred location.

finalgraphmay4blogstep4

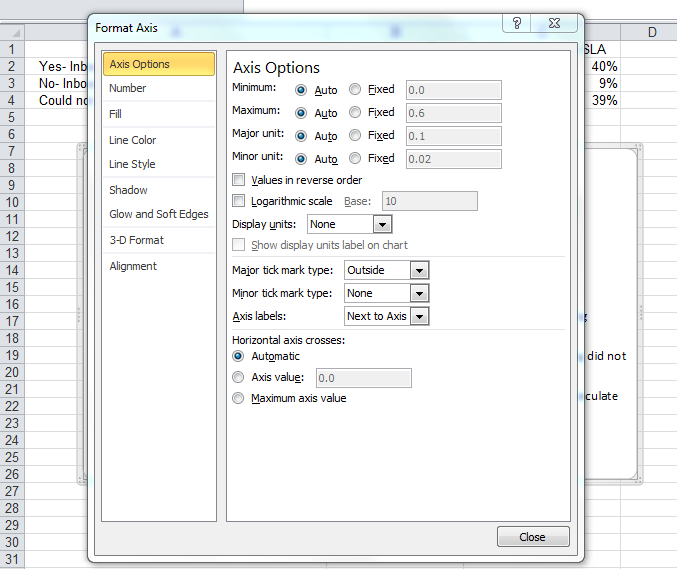
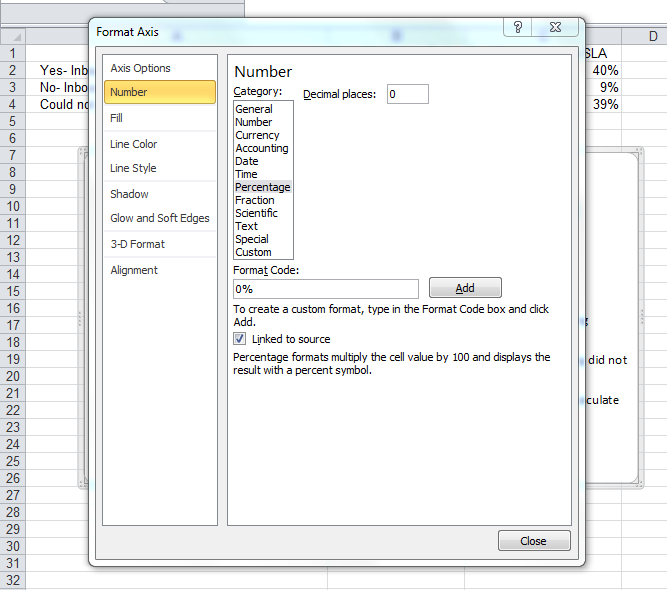
Step 5: Change the Y axis measurement options, if desired.

To change the type of measurement shown on the Y axis, right click on the Y axis percentages, and click ‘Format Axis.’ Here you can decide if you want to display units located on the Axis Options tab, or if you want to change whether the Y axis shows percentages to 2 decimal places or to 0 decimal places.

finalblogmay4step5p1

finalblogmay4step5p2

The resulting graph would be changed to look like this:

finalblogmay4step5p3

Step 6: Reorder data, if desired.

To sort the data so that the software choices appear in descending popularity order, click on the column that is most important to you (in this case I picked column B), click on the ‘Data’ tab, and click ‘Filter.’ Then go back to Column B and click the down arrow and click ‘Sort Largest to Smallest.’

finalblogmay4step7p1

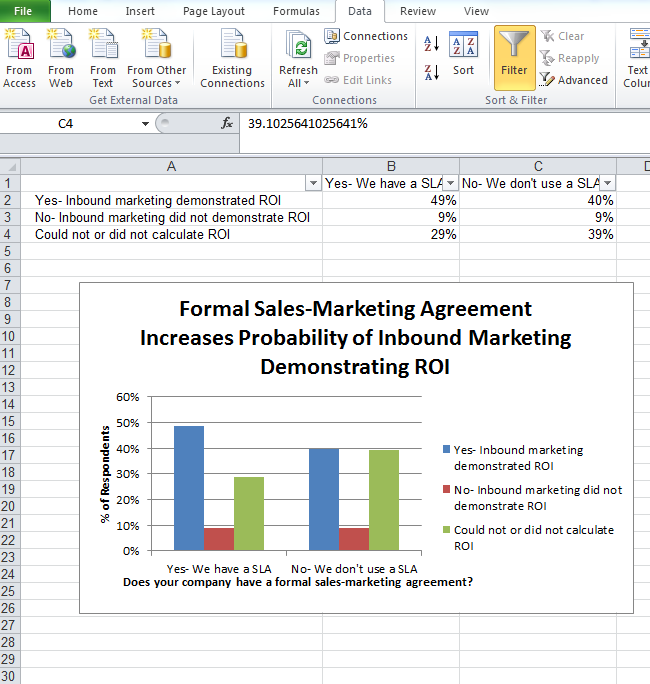
If you click on the downward arrows located at B1 and C1, you can choose to sort based on smallest to largest or largest to smallest, depending on your preference. Here, I sorted largest to smallest on B1.

finalblogmay4step7p2-1

Pretty easy, right? What other Excel functions have you always wanted help with?


http://blog.hubspot.com/how-to-build-excel-graph

REALTOR® Confidence Rose Strongly in March 2013 | Bedford Corners NY Real Estate

Confidence about current market conditions and the outlook for the next six months rose strongly across all property types in March. For the first time, the “REALTORS® Confidence Index – Six Month Outlook” for townhouses breached the level of 50 which delineates “moderate” expectations. The data is based on information gathered in the March REALTORS® Confidence Index (RCI) Survey.

REALTORS® generally mentioned strong buyer demand, improving prices, and fewer days on the market amid tight inventory and restrictive credit conditions.

Examples of improving residential markets are delineated in detail in the RCI Report.

  • Ninety-four percent reported that they expect constant or higher prices in the next 12 months.
  • The median days on market for all sales was 62 days in March compared to 91 days a year ago.
  • Thirty-seven percent of respondents reported time on market at less than 1 month when sold.
  • Distressed sales were at 21 percent of market, down from 29 percent a year ago.

What Does This Mean for REALTORS®?
Some people are still a little shell shocked from the Great Recession, and some articles in the Press continue to question whether there is a recovery. The people who are experts in the housing markets—the REALTORS®–are reporting very favorable news. These experts see a recovery.


http://economistsoutlook.blogs.realtor.org/2013/04/24

Demand for Properties Continued to Expand Faster than Supply in March 2013 | Cross River Real Estate

Strong buyer demand for residential homes continued to outpace supply in March. The Buyer Traffic Index rose to 69 while the Seller Traffic Index inched up to 41. This based on information in the March REALTORS® Confidence Index (RCI) Survey.

In many areas of the country REALTORS® reported low inventory levels of homes for sale. Tight inventory conditions have been cited as leading to higher prices and reduced time on market.

What Does This Mean for REALTORS®?
If a potential buyer asks why sales are down in some areas, one can note that a major reason for sales declines recently has been the hot sales market—a lack of inventory relative to the number of people who want to buy.


http://economistsoutlook.blogs.realtor.org/2013/04/26

Cash Sales: 30 Percent of Residential Sales | Pound Ridge Real Estate

Approximately 30 percent of REALTORS® reporting on their last sale had a cash sale (32 percent in February). Investors and international buyers typically pay cash. About 9 percent of REALTORS® reporting a sale to a first-time homebuyer also reported cash sales, while over 70 percent of reported last sales to investors and international buyers were for cash. This is based on data from the March REALTORS® Confidence Index Survey.

What Does This Mean for REALTORS®?
The first time buyer faces a challenge—particularly given that investors are in many cases paying cash—as are second home buyers and international buyers. The key to success appears to be getting financing in place.


http://economistsoutlook.blogs.realtor.org/2013/04/30

Case-Shiller Price Index | Bedford NY Real Estate

In each Economic Update, the Research staff analyzes recently released economic indicators and addresses what these indicators mean for REALTORS® and their clients. Today’s update discusses the Case-Shiller price index.


  • Case-Shiller data show that U.S. house prices rose 9.3 percent and 8.6 percent for the 20- and 10-city indexes, respectively, for the 12 months ending in February 2013, according to their repeat-sales house price index. The NAR median price rose by more than the Case-Shiller data, showing an 11.3 percent gain for the same 12-month period.
  • NAR reports the median price of all existing homes that have sold in the given time period while Case-Shiller’s weighted repeat-sales index only compares price changes among homes for which there is a previous sale, examining the difference in price for property-pairs only. Also, because Case-Shiller data relies on public records, the data reported for February 2013 is actually a moving average of sales from December 2012, January 2013, and February 2013. Because home sales among higher priced properties have been growing more than among lower price tiers and because the Case-Shiller report factors in older data in this market of rapid price growth the NAR median is outpacing the Case-Shiller index.
  • While the NAR median price does not measure change in price for the same properties, it can be computed much more quickly than a weighted repeat sales index, thus information is available sooner, and as can be seen in the chart below comparing several price measures, the trends in the data tend to be similar, so the NAR median price is a valuable early indicator of other housing price data.
  • NAR’s median home price for the 12 months ending March 2013 showed a gain of 11.8 percent, suggesting that further increases, likely in the double-digit range, will be seen in the Case-Shiller data next month. By comparison, CoreLogic’s HPI showed double-digit gains as early as February.
  • By city, Phoenix, Las Vegas, and Atlanta have the best price growth records in the last year and while the Atlanta area saw no change in price from January to February, the other two cities also top the monthly growth list.


http://economistsoutlook.blogs.realtor.org/2013/04/30

Reverse mortgage delinquencies surge | Bedford Hills NY Real Estate

Monday Morning Cup of Coffee is a quick look at the news coming across the HousingWire weekend desk, with more coverage to come on bigger issues.

A test prototype of the single-securitization platform for the secondary mortgage market is expected as early as next year, regulators said while speaking at the Mortgage Bankers Association’s Secondary Market Conference on Sunday.

This goal set forth by the Federal Housing Finance Agencyand the government-sponsored enterprises is to incorporate mortgage participants’ feedback into the prototype development, which will hopefully result into a platform creation that suits the industry’s needs, explained Tim Yanoti, senior vice president of securitization at Fannie Mae.

HousingWire Reporter Christina Mylinski has more on the securitization platform and will be covering the MBA Secondary Conference online Monday and Tuesday. You can follow Christina on Twitter: https://twitter.com/@ChristinaMlynskfor conference updates.

Of the almost 600,000 reverse mortgages outstanding, 9.8% are currently delinquent. This is an 8% increase from 2011, according to the U.S. Department of Housing and Urban Development.

The Wall Street Journal writes that delinquencies have increased in recent years as up to 70% of borrowers have opted for lump-sum payouts.

As concerns about defaults rise, the Federal Housing Agency recently discontinued a popular variety of fixed-rate reverse mortgages that paid the highest lump sums available through the program.


http://www.housingwire.com/news/2013/05/05