Tag Archives: South Salem

New single family home sales jump dramatically | South Salem Real Estate

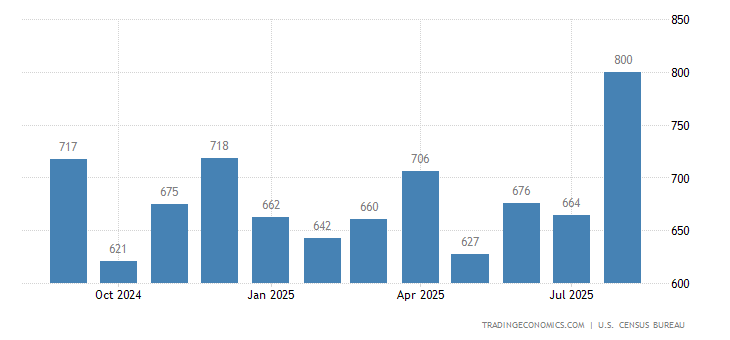
Sales of new single family homes in the United States jumped 17.5 percent to a seasonally adjusted annual rate of 733 thousand in November of 2017 from a downwardly revised 624 thousand in October and beating market forecasts of 654 thousand. It was the strongest number since July of 2007. Sales rose in all four regions. New Home Sales in the United States averaged 650.82 Thousand from 1963 until 2017, reaching an all time high of 1389 Thousand in July of 2005 and a record low of 270 Thousand in February of 2011.

United States New Home Sales

US New Home Sales Highest Since July 2007

Sales of new single-family houses in the United States jumped 17.5 percent to a seasonally adjusted annual rate of 733 thousand in November of 2017 from a downwardly revised 624 thousand in October and beating market forecasts of 654 thousand. Sales rose in all four regions.

Sales surged in all four main regions: South (14.9 percent to 416 thousand); West (31.1 percent to 194 thousand); Midwest (6.9 percent to 77 thousand) and Northeast (9.5 percent to 46 thousand):
The median sales price of new houses sold was $318,700, above $315,000 a year earlier. The average sales price was $377,100, also higher than $363,400 in November of 2016.
The stock of new houses for sale was flat at 283 thousand. This represents a supply of 4.6 months at the current sales rate.
Year-on-year, new home sales increased 26.6 percent.
read more…
https://tradingeconomics.com/united-states/new-home-sales

The D.C. real estate market | South Salem Real Estate

D.C. experienced considerable growth in 2013 and 2014, surpassing national averages. But in 2015 and the first half of this year, most major indicators — including averages sales price, median days on the market and sales to list price ratio — slowed to a pace only slightly ahead the national market as a whole, according to data from Rockville-based multiple-listing service MRIS.

Here’s a snapshot of how the D.C. market performed in the first half of the year:

Average sales price 

On the whole, the average sales price — the average price at which a property sells — of all homes of any type in Washington are up 1.44 percent year to date in 2016 — $646,640 this year compared to $637,452 last year. This is certainly well above the median sales price of a home nationally, which hovers just below $250,000.

In particular, the highest average sales prices year to date in the District are in Zip codes 20007, primarily for Georgetown and Burleith ($1,067,347); 20016 for Cathedral Heights and American University Park ($1,042,904); and 20015 for the area around Friendship Heights and Chevy Chase ($1,017,269).

However, the biggest gainers in average sales price are a mixture of high-priced neighborhoods with developing areas outside the city center. The largest gainer in average sales price through the end of June was American University Park and Cathedral Heights, rising 19.9 percent to $1,042,904 in 2016 from $870,046 in 2015.

Notable growth also occurred in the far reaches of Southeast and Northeast Washington. The second- and third-biggest gainers in average sales price so far in 2016 have been seen around Zip codes 20020 for Anacostia and Hillcrest (up 17.7 percent to $292,159) as well as in 20019 for Deanwood and Benning Heights (up 17.3 percent to $256,417).

Median days on market 

Unlike other leading indicators, median days on the market — the number of days it takes a property to go from active on the market to under contract — is measured in how it shrinks not grows. A low number of days on market often corresponds to a higher sales price and vice versa. For the District, the average days on market as a whole are 39 days for 2016, down one day from 2015.


read more..


https://www.washingtonpost.com/news/where-we-live/wp/2016/08/01/how-the-d-c-real-estate-market-is-faring-so-far-in-2016/

US housing market is on fire | South Salem Real Estate

We just got another sign the housing market is on fire.

On Wednesday, we learned that existing home sales jumped to the fastest pace since February 2007.

Sales rose 3.2% month-over-month to an annualized pace of 5.49 million.

Economists had forecast a rise of 0.9% to an annualized pace of 5.40 million.

In the release from the National Association of Realtors, Lawrence Yun noted that the past two months were the strongest for sales since early 2007.

“This wave of demand is being fueled by a year-plus of steady job growth and an improving economy that’s giving more households the financial wherewithal and incentive to buy,” Yun said.

Ian Shepherdson, chief US economist at Pantheon Macroeconomics, said in a note out after the report, “In one line: strong across the board.”

But this isn’t the first sign the housing market is roaring back. On Friday we got housing data that posted eight-year highs from the Census Bureau, showing that housing starts rose 9.8% to an annualized pace of 1.174 million, the highest since July 2007.

Building permits, which point to the pace of future construction, rose 7.4% to an annualized pace of 1.343 million.

In Wednesday’s release, NAR president Chris Polychron said that even with the uptick in home prices, demand is still solid across the board.

“The demand for buying has really heated up this summer,” Polychron said, “leading to multiple bidders and homes selling at or above asking price. Furthermore, tight inventory conditions are being exacerbated by the fact that some homeowners are hesitant to sell because they’re not optimistic they’ll have adequate time to find an affordable property to move into.”

fredgraphconstrution spendingFRED

And as we highlighted over the weekend, the housing market is reflecting a bigger macroeconomic story of a US economy that is picking up steam.

Deutsche Bank’s Joe LaVorgna spelled this out in a note to clients on Tuesday, writing:

“We remain positive on the housing outlook. The economy has created nearly 3 million jobs over the past year, the unemployment rate is almost a percentage point lower, and consumers have saved well over $100 billion in energy costs over the last 12 months. Moreover, as we highlighted in the latest US Economics Weekly, commercial banks continue to ease lending standards for mortgages …”

LaVorgna continued:

In short, there are several positive tailwinds for the housing sector that should result in a more pronounced pickup in activity over the next several quarters. If this is the case, policymakers should become more confident that consumer spending, which accounts for roughly 70% of GDP, is on firm footing.

And it’s not just economists who are bullish on housing. The Federal Reserve’s latest beige book noted an uptick in real-estate activity in several of its 12 districts. The bullish signs are everywhere.

Read more: http://www.businessinsider.com/existing-home-sales-july-22-2015-7#ixzz3gdhXWob8


U.S. home prices steady in January, Case-Shiller data show | South Salem Real Estate

U.S. house prices were steady in January, according to the S&P/Case-Shiller 20-city composite released Tuesday, with Charlotte, Miami and San Diego all seeing gains of 0.7% while San Francisco prices fell 0.9%. On a seasonally adjusted basis, prices grew 0.9%. Compared to Jan. 2014, prices were up 4.6%. “The combination of low interest rates and strong consumer confidence based on solid job growth, cheap oil and low inflation continue to support further increases in home prices,” said David M. Blitzer, chairman of the index committee for S&P Dow Jones Indicies, in a statement.


read more…


http://www.marketwatch.com/story/us-home-prices-steady-in-january-case-shiller-data-show-2015-03-31

CoreLogic Kicks off 2015 in Style | #SouthSalem Real Estate

CoreLogic reports shows that home prices nationwide increased 5.7 percent in January 2015 compared to January 2014. This change represents 35 months of consecutive year-over-year increases in home prices nationally.

On a month-over-month basis, home prices nationwide increased by 1.1 percent in January 2015 compared to December 2014*.  Some 27 states and the District of Columbia are at or within 10 percent of their peak. Four states, New York (+5.6), Wyoming (+8.3 percent), Texas (+8.3 percent) and Colorado (+9.1 percent), reached new highs in the home price index since January 1976 when the index starts.

The CoreLogic HPI Forecast indicates that home prices, including distressed sales, are projected to increase 0.4 percent month over month from January 2015 to February 2015 and, on a year-over-year basis, by 5.3 percent** from January 2015 to January 2016. Excluding distressed sales, home prices are expected to increase 0.3 percent month over month from January 2015 to February 2015 and by 4.9 percent** year over year from January 2015 to January 2016. The CoreLogic HPI Forecast is a monthly projection of home prices using the CoreLogic HPI and other economic variables. Values are derived from state-level forecasts by weighting indices according to the number of owner-occupied households for each state.

“House price appreciation has generally been stronger in the western half of the nation and weakest in the mid-Atlantic and northeast states,” said Dr. Frank Nothaft, chief economist at CoreLogic. “In part, these trends reflect the strength of regional economies. Colorado and Texas have had stronger job creation and have seen 8 to 9 percent price gains over the past 12 months in our combined indexes. In contrast, values were flat or down in Connecticut, Delaware and Maryland in our overall index, including distressed sales.”

“We continue to see a strong and progressive uptick in home prices as we enter 2015. We project home prices will continue to rise throughout the year and into 2016,” said Anand Nallathambi, president and CEO of CoreLogic. “A dearth of supply in many parts of the country is a big factor driving up prices. Many homeowners have taken advantage of low rates to refinance their homes, and until we see sustained increases in income levels and employment they could be hunkered down so supplies may remain tight. Demand has picked up as low mortgage rates and the cut in the FHA annual insurance premium reduce monthly payments for prospective homebuyers.”


read more…

http://www.realestateeconomywatch.com/2015/03/corelogic-kicks-off-2015-in-style/


2014 Ended with 39 Percent of Housing Markets Fully Recovered | South Salem Real Estate

As the year ended, 39 percent, or 117, of the nation’s largest 300 markets achieved full price recovery, up 30 percent from the end of 2013. Hundreds of other markets moved closer to full recovery; by December, the average rebound percentage of all 300 markets was 95.85 percent, which was slightly higher than 95.49 percent recorded in November.


Markets that lost the least value during the Great Recession have been the first to rebound. Of the markets with a peak-to-trough decline of less than 10 percent, 25 had an average rebound of 107 percent in December. Of the markets that lost 10 to 20 percent of value, the average rebound reached 99 percent of the prior peak price in December. In the markets that suffered the most severe price declines, the average rebound percentage was 81 percent.


In December, 42 of the top 100 markets measured continued to show a complete price recovery, increasing by two from November. Jackson, MS and NashvilleDavidson-Murfreesboro-Franklin, TN were the new markets rebounding at 100.15 percent and 100.16 percent, respectively. Additionally, 75 midsize markets saw a rebound above 100 percent, up by four markets from November’s report.


“Great progress was made in the housing market during 2014. It put the real estate sector within striking distance of a majority of the nation’s 300 largest markets reaching full price recovery.  As markets reach new price peaks, they are restoring equity to millions of homeowners, making it possible for them to refinance or sell,” said David Mele, president of Homes.com.


read more…


http://www.realestateeconomywatch.com/2015/02/8482/

NAR Reports Existing Sales Disappoint | South Salem Real Estate

Existing home sales decreased 4.9% in January, and the share of sales for first-time buyers continued to disappoint. The National Association of Realtors (NAR) reported January 2015 total existing home sales at a seasonally adjusted rate of 4.82 million units combined for single-family homes, townhomes, condominiums and co-ops, down from a revised 5.07 million units in December. January existing sales were up 3.2% from the same period a year ago.

Existing Home Sales January 2015

Existing sales from the previous month were down in all four regions, ranging from 2.7% in the Midwest to 7.1% in the West. Year-over-year, existing sales were up in all four regions, ranging from 5.6% in the South to 0.9% in the Midwest.

The first-time buyer share decreased to 26% in January, down from 29% in December and 31% in November. This continuing downward trend follows 2014 during which the annual share of first-time buyers fell to its lowest level in nearly three decades. Reports of easing mortgage standards will help first-time buyers, and a full recovery awaits their return to their typical 40% share.

Total housing inventory increased 0.5% in January to 1.87 million existing homes. At the current sales rate, the January 2015 inventory increased to a 4.7-month supply, up from a 4.4-month supply in December. NAR also reported that in January the typical time on the market was 69 days, up from 66 days in December, and slightly up from 67 days during the previous January. NAR reported that 30% of homes sold in January were on the market less than a month, down from 31% in December and 32% in November.

The distressed sales share January sales remained unchanged from December at 11%, and was down from 15% during the same month a year ago. Distressed sales are defined as foreclosures and short sales sold at deep discounts. January all cash sales increased to 27% of transactions, up from 26% in December and 25% in November, but were down from 33% during the same month a year ago. Individual investors purchased a 17% share in January, unchanged from December, but that share was down from the 20% share last January. Some 67% of January investors paid cash, up from 63% in December and 61% in November. The awaited withdrawal of cash investors will create more opportunity for first-time buyers.

The January median sales price of $199,600 was 6.2% above the previous January, and represented the 35th consecutive month of year-over-year price increases. The median condominium/co-op price dropped for the sixth consecutive month to $198,300 in January, but was up 5.3% from the same period a year ago.

The Pending Home Sales Index decreased 3.7% in December, so the decline in January existing sales was not a surprise. However, it is expected that existing sales will regain their upward momentum during 2015, hopefully supported by the much awaited recovery for first-time buyers.


read more…


http://eyeonhousing.org/2015/02/existing-sales-disappoint/

Housing Starts Decline in the Midwest | South Salem Real Estate

The pace of housing starts declined 2% in January, including a significant decrease in single-family construction in the Midwest connected to weather factors. Nonetheless, the current pace of home construction remains strong and growth should continue in 2015.

According to the joint Census Bureau and HUD release, the seasonally adjusted annual rate of housing starts came in at 1.065 million, down from a revised pace of 1.087 million in December 2014.

Jan housing starts

The rate of starts for single-family construction was down 6.7% from December, yielding a 678,000 annual pace. Most of this decline is attributable to a 31% drop for single-family starts in the Midwest, which fell from a 133,000 annual rate in December to 92,000 in January.

This decline is consistent with elements of the February NAHB / Wells Fargo Housing Market Index, which suggested declines in builder confidence due to weather factors. However, builder sentiment remains positive, and NAHB expects single-family starts to rise in the coming months given favorable job creation numbers and pent-up housing demand.

Multifamily starts remained strong in February, rising 7.5% to a 387,000 seasonally adjusted annual rate. The three-month moving average of multifamily starts has been above 350,000 since April of 2014.

Jan homes under construction

As a check on the state of the recovery in housing construction, the government data also includes a summary of housing units under construction. On a seasonally adjusted basis, there were 839,000 total homes under construction as of January. The single-family total was 366,000, which is the highest for the post-recession period and almost 9% higher than January 2014.

Multifamily units construction stand at 462,000, also a post-recession high. This estimate is more than 25% higher than the January 2014 total of 368,000.


read more…


http://eyeonhousing.org/2015/02/

Frank ‘Lefty’ Rosenthal’s Far-Out Vegas Home Lists for $777K | South Salem Real Estate

Location: Las Vegas, Nevada
Price: $777,000
The former Las Vegas home of Frank “Lefty” Rosenthal, the late casino exec, mob associate, and FBI informant whose exploits inspired Martin Scorsese’s Casino, is back on the market for a lucky-sounding $777K. Though some things have changed since Lefty’s day, it’s about as groovy a 70s time capsule as you’re likely to find adjacent to the Las Vegas Country Club.

According to listing agent Brian Burns, Lefty spent around $500K having the three-bedroom reconstructed back in the mid-70s, after it was gutted by fire. The interior was done by designer Stephen Chase, who at the time was working for Arthur Elrod out in Palm Springs.

There have been four owners since Lefty (the current ones bought it in 2011 for $615K), all of which have been intent on “keeping the historic integrity of the home intact,” says Burns. Most of the floors have been redone over the years, though, and a second-floor picture window was added in back. The current owners redid the kitchen with a new backsplash and Caesarstone countertops, and outfitted the dwelling with a Savant smart home system.

The pieces of wall art in the living and dining rooms, which were commissioned by Stephen Chase when he was designing the interior, are including in the sale, as are the semicircular couch and lamp in the living room, the bedrooms sets, and a bunch of Lefty memorabilia. Also included, according to a 2011 article in the Las Vegas Review Journal: “bulletproof doors and picture windows, a hidden gun compartment,” and a “suspected” bullet mark chipped from one of the windowpanes.


read more…


http://curbed.com/archives/2015/01/29/frank-lefty-rosenthal-vegas-home-for-sale.php

Mortgage applications continue to slide, down 2.6% | South Salem Real Estate


Mortgage applications dropped again this week, falling 2.6% from one week earlier, according to data from the Mortgage Bankers Association’s Weekly Mortgage Applications Survey for the week ending October 31, 2014.

The Market Composite Index, a measure of mortgage loan application volume, decreased 2.6% on a seasonally adjusted basis from one week earlier.  On an unadjusted basis, the Index decreased 3% compared with the previous week.

The Refinance Index decreased 6% from the previous week.  The seasonally adjusted Purchase Index increased 3% from one week earlier. The unadjusted Purchase Index increased 1% compared with the previous week and was 13% lower than the same week one year ago.

The refinance share of mortgage activity decreased to 63% of total applications from 65% the previous week. The adjustable-rate mortgage (ARM) share of activity decreased to 7.4% of total applications.

The FHA share of total applications increased to 9.5% this week from 8.9% last week.  The VA share of total applications remained unchanged at 10.7% this week and the USDA share of total applications remained unchanged at 0.9% this week.


read more…


http://www.housingwire.com/articles/31954-mortgage-applications-continue-to-slide-down-26