Tag Archives: Bedford Corners NY Luxury Homes

Housing is still really affordable | Bedford Corners Real Estate

The last full day of the Mortgage Bankers Association annual conference is underway, and the latest revelation is increasing home prices may not be as threatening as many think.

Many studies, including today’s S&P CoreLogic Case-Shiller Home Price Index, show that home prices gains are up more than 5% nationally. While that’s true, the story changes when economists bring in other factors.

In fact, when adjusting for inflation and the amount of purchase power provided by low interest rates, home prices actually dropped in the past 16 years, First American Chief Economist Mark Fleming said in an interview with HousingWire.

“Contrary to popular opinion, housing isn’t getting more expensive,” Fleming said. “In fact, on a purchasing-power adjusted basis, housing is becoming more affordable.”

“Interest rate declines, combined with meaningful gains in incomes, have provided the consumer with greater buying power, which increases housing affordability,” he said. “The growth in consumer house-buying power is actually outpacing the increases in nominal prices driven by remarkably tight inventories.”

The amount of purchasing power is determined by many economic factors including interest rates, inflation and household income.

Since July 2006, real home prices decreased 41% as of August. They did, however, increase 0.8% from July, but decreased 2.6% from August 2015. Real home prices decreased 20.7% from January 2000.

This chart shows that while home prices are near housing boom peaks, affordability is actually much better off:

Click to Enlarge

real home prices

(Source: Standard & Poors, First American)

“At the moment, affordability is actually increasing in more markets than it is decreasing, including San Francisco, San Jose, New York, Washington and Boston,” Fleming said. “The conventional wisdom that these markets are over-valued does not account for the meaningful growth in consumer house-buying power across the majority of major metropolitan markets.”

However, an increase in interest rates could decrease the demand for housing and put the brakes on rising home prices, Fleming told HousingWire. It would decrease the buying power of consumers.

And yet, MBA Chief Economist Mike Fratantoni still predicts double-digit increases in purchase mortgage originations in 2017, despite the possibility of a rate hike.

While a decrease in interest rates could also mean a decrease in purchasing power, according to Fleming it’s “not necessarily a bad thing.”


read more…


Economist: Home price gains aside, housing is still really affordable

Mortgage rates average 3.47% | Bedford Corners Real Estate

Freddie Mac (OTCQB: FMCC) today released the results of its Primary Mortgage Market Survey® (PMMS®), showing average fixed mortgage rates slipping from last week’s spike and the 30-year fixed-rate mortgage easing back to its summertime range below 3.5 percent.

News Facts

  • 30-year fixed-rate mortgage (FRM) averaged 3.47 percent with an average 0.6 point for the week ending October 27, 2016, down 5 basis points from 3.52 percent last week. A year ago at this time, the 30-year FRM averaged 3.76 percent.
  • 15-year FRM this week averaged 2.78 percent with an average 0.5 point, down slightly from last week when they averaged 2.79 percent. A year ago at this time, the 15-year FRM averaged 2.98 percent.

Average commitment rates should be reported along with average fees and points to reflect the total upfront cost of obtaining the mortgage. Visit the following link for the Definitions. Borrowers may still pay closing costs which are not included in the survey.

Quote
Attributed to Sean Becketti, chief economist, Freddie Mac.

“Mortgage rates continue to be relatively stable and at near record lows. The 30-year fixed-rate mortgage fell 5 basis points week-over-week to 3.47 percent, erasing last week’s increase. At the same time, the 10-year Treasury yield ended the week relatively flat — up about 2 basis points.”

U.S. mortgage demand to buy homes hits six-month low | Bedford Corners Real Estate

Weekly applications for U.S. mortgages to buy homes slipped to a six-month low even as interest rates on fixed-rate home loans fell, according to data from an industry group released on Wednesday.

The Mortgage Bankers Association said its seasonally adjusted index of mortgage activity for home purchases, a leading indicator of housing sales, fell 4 percent in the week ended Aug. 12. It remained 10 percent higher than the comparable week a year earlier.

The average rate on “conforming” 30-year home mortgages, or loans with balances of $417,000 or less, dipped to 3.64 percent last week from 3.65 percent, the Washington-based group said.

The average 30-year rate touched 3.60 percent in the week ended July 8, which was the lowest since May 2013 and not far from the historic low of 3.47 percent struck in December 2012, according to MBA data.

Weekly mortgage activity on home purchases reached an eight-month peak in early June before a decline since even as 30-year mortgage rates hovered near their lowest in over three years.

On Tuesday, the Commerce Department said housing starts rose 2.1 percent to an annualized rate of 1.211 million units in July, which was a five-month high.

Applications for loans to refinance also fell last week.

MBA’s seasonally adjusted index on mortgage activity for refinancing decreased 4 percent from the prior week. In early July, it hit its highest level since June 2013.


read more…


http://www.marketbeat.com/stories.aspx?story=http%3a%2f%2ffeeds.reuters.com

June housing starts jump | Bedford Corners Real Estate

U.S. housing starts rose more than expected in June as construction activity increased broadly, but a downward revision to the prior month’s data pointed to a housing sector treading water in the second quarter.

Groundbreaking surged 4.8 percent to a seasonally adjusted annual pace of 1.19 million units, the Commerce Department said on Tuesday. May’s starts were revised down to a 1.14 million-unit pace from the previously reported 1.16 million-unit pace.

Economists polled by Reuters had forecast housing starts rising to a 1.17 million-unit pace last month.

Housing starts in the second quarter were a touch higher than the average for the first three months of the year, suggesting that residential construction was probably a small boost to gross domestic product in the second quarter.

The housing market is being supported by a strengthening labor market and demand for rental accommodation, but home building is being constrained by labor and land shortages.

A survey of homebuilders published on Monday showed scattered softness in some markets, with builders citing regulatory challenges, as well as shortages of lots and labor.

Groundbreaking on single-family homes, the largest segment of the market, increased 4.4 percent to a 778,000-unit pace in June. Single-family starts in the South, where most home building takes place, gained 0.5 percent.

Single-family starts jumped 31.6 percent in the Northeast and climbed 3.1 percent in West. Groundbreaking on single-family housing projects increased 7.3 percent in the Midwest.

But single-family home construction continues to run ahead of permits, which could limit gains in the near term.

Housing starts for the volatile multi-family segment rose 5.4 percent to a 411,000-unit pace. The multi-family segment of the market continues to be supported by strong demand for rental accommodation as some Americans remain wary of homeownership in the aftermath of the housing market collapse.


read more…


http://www.foxbusiness.com/markets/2016/07/19/june-housing-starts-rise-4-8.html

Housing market improves across the country | Bedford Corners Real Estate

Freddie Mac (OTCQB: FMCC) today released its Multi-Indicator Market Index® (MiMi®), showing the spring homebuying season staying on course in most areas of the country, with two additional metros — Charlotte, North Carolina, and Knoxville, Tennessee — entering their benchmark ranges.

The national MiMi value stands at 84.1, indicating a housing market that’s on the outer range of its historic benchmark level of housing activity, with a +0.27 percent improvement from March to April and a three-month improvement of +1.63 percent. On a year-over-year basis, the national MiMi value has improved +7.37 percent. Since its all-time low in October 2010, the national MiMi has rebounded 42 percent, but remains significantly off from its high of 121.7.

News Facts:

  • Thirty-six of the 50 states plus the District of Columbia have MiMi values within range of their benchmark averages, with the District of Columbia (102), Hawaii (97.4), Utah (95.9) and Colorado, Montana and Oregon all having the same value (95.8) and being closest to their benchmark averages.
  • Sixty-seven of the 100 metro areas have MiMi values within range with Nashville, TN (99.9), Honolulu, HI (99.8), Salt Lake City, UT (99.0), Los Angeles, CA (98.6) and Austin, TX (102.6) ranking in the top five.
  • The most improving states month over month were Mississippi (+1.29%), Tennessee (+1.27%), Massachusetts (+1.15%), Florida (+0.98%) and Nebraska (+0.97%). On a year-over-year basis, the most improving states were Florida (+15.34%), Colorado (+14.73%), Nevada (+14.62%), Oregon (+14.46%) and New Jersey (+13.48%).
  • The most improving metro areas month over month were Lakeland, FL (+2.06%), Chattanooga, TN (+2.04%), Modesto, CA (+1.83%), Orlando, FL (+1.82%), and New Haven, CT (+1.78%). On a year over year basis, the most improving metro areas were Orlando, FL (+20.17%), Tampa, FL (+17.47%), Denver, CO (+17.39%), Cape Coral, FL (+16.69%), and Portland, OR (+15.99).
  • In April, 42 of the 50 states and 86 of the top 100 metros were showing an improving three-month trend. The same time last year, 46 of the 50 states, and all of the top 100 metro areas were showing an improving three-month trend.

Quote attributable to Freddie Mac Deputy Chief Economist Len Kiefer:

“Seven years into the recovery from the Great Recession most of the nation’s housing markets remain below their historical benchmarks, but continue to grind higher month-by-month. Nationally, MiMi in April 2016, is 84.1, a 7.37 percent year-over-year increase and the 48th consecutive month of year-over-year increases. Over this four-year timeframe, MiMi has increased 36.5 percent and now stands just 15.9 percent below its historic benchmark average.

“Out of the 50 states and the District of Columbia 49 posted positive year-over-year changes. North Dakota and Wyoming, two states heavily reliant on the energy sector, were the only states with year-over-year declines. Out of the 100 metro areas MiMi tracks, 99 posted positive year-over-year gains, with Tulsa, Oklahoma — also with deep ties to the energy sector — posting no change year-over-year.

“Among the four MiMi indicators, Purchase Applications increased the most in April, rising 1.77 percent from March and up 15.27 percent year over year. The strong positive momentum in home purchase applications is a good sign for a housing market likely to post the best year in home sales since 2006. Despite strong house price growth, the MiMi Payment-to-Income indicator fell 1.05 percent in March, reflecting the impact of lower mortgage rates. If global factors like the Brexit put significant downward pressure on long-term mortgage rates, the U.S. housing market could benefit from increased affordability, helping to partially offset the impact of house prices, which are rising around six percentage points year over year nationally.”

The 2016 MiMi release calendar is available online.

MiMi monitors and measures the stability of the nation’s housing market, as well as the housing markets of all 50 states, the District of Columbia, and the top 100 metro markets. MiMi combines proprietary Freddie Mac data with current local market data to assess where each single-family housing market is relative to its own long-term stable range by looking at home purchase applications, payment-to-income ratios (changes in home purchasing power based on house prices, mortgage rates and household income), proportion of on-time mortgage payments in each market, and the local employment picture. The four indicators are combined to create a composite MiMi value for each market. Monthly, MiMi uses this data to show, at a glance, where each market stands relative to its own stable range of housing activity. MiMi also indicates how each market is trending, whether it is moving closer to, or further away from, its stable range. A market can fall outside its stable range by being too weak to generate enough demand for a well-balanced housing market or by overheating to an unsustainable level of activity.

Mortgage rates average 3.58% | Bedford Corners Real Estate

Freddie Mac (OTCQB: FMCC) today released the results of its Primary Mortgage Market Survey® (PMMS®), showing mortgage rates declining slightly from the previous week to reach a new low for the year.

News Facts

  • 30-year fixed-rate mortgage (FRM) averaged 3.58 percent with an average 0.5 point for the week ending April 14, 2016, down from last week when they averaged 3.59 percent. A year ago at this time, the 30-year FRM averaged 3.67 percent.
  • 15-year FRM this week averaged 2.86 percent with an average 0.5 point, down from last week when it averaged 2.88 percent. A year ago at this time, the 15-year FRM averaged 2.94 percent.
  • 5-year Treasury-indexed hybrid adjustable-rate mortgage (ARM) averaged 2.84 percent this week with an average 0.4 point, up from last week when it averaged 2.82 percent. A year ago, the 5-year ARM averaged 2.88 percent.

Average commitment rates should be reported along with average fees and points to reflect the total upfront cost of obtaining the mortgage. Visit the following link for theDefinitions. Borrowers may still pay closing costs which are not included in the survey.

Quote
Attributed to Sean Becketti, chief economist, Freddie Mac.

“Demand for Treasuries remained high this week, driving yields to their lowest point since February. In response, the 30-year mortgage rate fell 1 basis point to 3.58 percent. This rate represents yet another low for 2016 and the lowest mark since May 2013.”

Jobs, Rates and Housing | Bedford Corners Real Estate

The Labor Department posts an employment report every month, and people look at it as a ladder rung up or down on the “wall of worry” over where the fragile economic and housing’s recovery is headed.

Bottom line, as these things go, fear is bad and greed is good.

Today’s has more freight than usual. Among the people who “look at it as a ladder rung up or down” are the U.S. Federal Reserve governors, who, it’s known, have an agenda item for their Sept. 16-17 meeting that may tie directly to today’s report.

The economy added 173,000 jobs to payrolls in the month of August. This fell short of the level Wall Street’s “consensus” of economists expected. The higher range of the consensus may have worked as a harbinger of a Fed belief that it’s time to lift borrowing costs. Having come in at the “under” level of the over-under range, may equally be a signal to the Fed that raising rates would put a damper on an economy still trying to find solid footing in an uncertain international economic context.

Here’s the Labor Department top line, focusing on payroll additions and the unemployment rate, which fell.

Total nonfarm payroll employment increased by 173,000 in August, and the unemployment rate edged down to 5.1 percent, the U.S. Bureau of Labor Statistics reported today. Job gains occurred in health care and social assistance and in financial activities. Manufacturing and mining lost jobs…..In August, the unemployment rate edged down to 5.1 percent, and the number of unemployed persons edged down to 8.0 million.

What this means in reality is the subject of a lot of speculation. “Five things to watch” and “previews” foretell a queasy reaction among Wall Street traders. They are America’s metaphor for impulsive, over-reaction, often to mixed indicators. But with a slow-down playing out in China’s economy and an iffy scenario shaping up in the eurozone, a Labor Department jobs report takes on “lightning rod” status for people whose jobs are to bet on the direction as well as the trajectory of corporate profit capability.

What it means to home builders, one can only shrug and guess that there’ll be an immediate impulsive interpretation, a medium-term effect, and an ultimate impact, none of the three of which may have to do with one another. Likely, for large companies in the home building and development ecosystem, including investors, materials suppliers, and manufacturers, upward pressure on borrowing costs may precipitate the next slew in what many consider to be an inevitable series of consolidation moves. As local as real estate is, the industry serving it on the horizontal and vertical development and construction side of the equation is becoming a smaller, more finite world of fewer bigger players.

All of this is tangential to those who spend two of every three dollars in the United States’ $18 trillion economy, American consumers. New Strategist Press editorial director Cheryl Russell notes that an important shift in that spending came to light with the release of Consumer Expenditure Survey data for 2014.


read more…


http://www.builderonline.com/builder-100/strategy/jobs-rates-and-housing_o?utm_source=newsletter&utm_content=Article&utm_medium=email&utm_campaign=BP_090415%20(1)&he=bd1fdc24fd8e2adb3989dffba484790dcdb46483

Hamptons real estate sales slowing down | Bedford Corners Real Estate

After a record breaking number of home sales in the Hamptons in 2014, things are beginning to cool down in the luxury real estate destination.

Both sales and median prices of Hamptons real estate are down in 2015 from where they were last year, according to a report by Douglas Elliman Real Estate.

The median sales price for a home in the Hamptons declined 6.5 percent to $849,000 compared to 2014, according to the report. The number of homes that were sold fell 15.7 percent to 590 this year, down from 700 sales at this time last year. However, average home price rose 2.5 percent year over year.

The conflicting data are a result of a reaction in the market from last year’s sales, said Jonathan Miller, president of Miller Samuel Real Estate Appraisers, who authored the report.

Last year saw an explosion of pent-up demand as people began to consider real estate again for the first time since the housing crisis, Miller said. That demand resulted in 700 sales, a record number.

“That demand has mostly been absorbed, so what we have now is the prices showing mixed trends, but sales are down,” he said. “There isn’t the same sense of urgency by buyers that there was a year ago, but there is still above-average activity occurring. It’s just not at the breakneck pace it was last year.”

The current market in the Hamptons is just returning to normal, the CEO of Douglas Elliman, Dottie Herman, said. While sales aren’t record breaking, they are still healthy.

She also noted that in a small market like the Hamptons, big outliers can move data.

For the fabulously wealthy, a Hamptons property is soon to hit the market at $95 million, according to real estate agents at Sotheby’s. The estate, known as Burnt Point, is an 18,000-square-foot shingle traditional built on 25 acres with water on three sides. The home is being sold by the Stewart J. Rahr Foundation, and the proceeds will continue to fund the foundation’s philanthropic efforts.


read more…


http://finance.yahoo.com/news/hamptons-real-estate-sales-slowing-150105444.html;_ylt=AwrC1CkpeLJVE28AVDLQtDMD;_ylu=X3oDMTByOHZyb21tBGNvbG8DYmYxBHBvcwMxBHZ0aWQDBHNlYwNzcg–

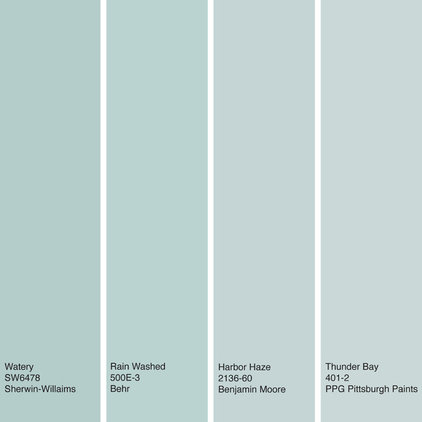
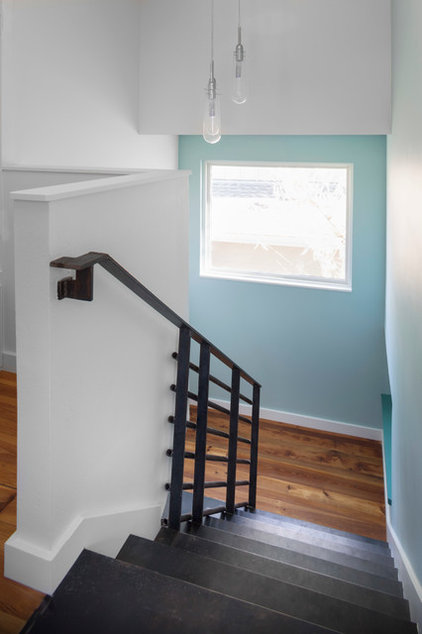
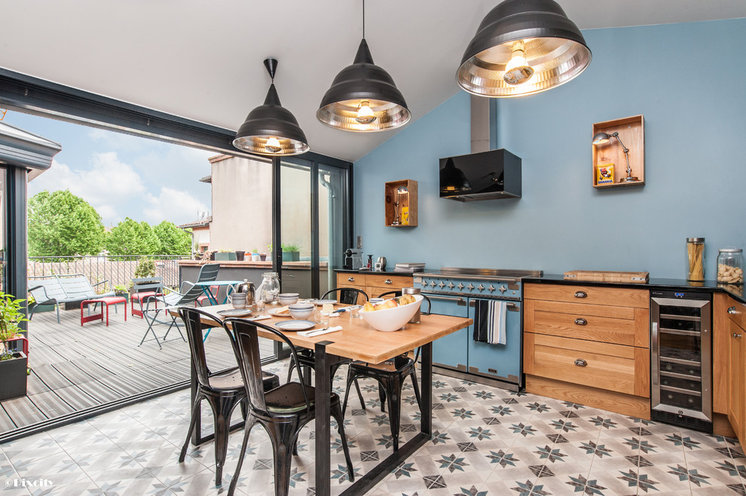
The color Watery Blue Is Summer’s Best Hue | Bedford Corners Real Estate

Summer’s in full swing, which hopefully means plenty of pool and beach time for many of you. Whenever I’m working with a homeowner who wants to add some color to their home, but doesn’t necessarily want to travel down the bold road, I recommend watery blue hues — colors inspired by summertime spent by the sea.

These soft, muted greenish-blue hues work especially well for bedrooms and bathrooms, where they offer a calming, spa-inspired vibe. I’ve gathered together some paint color options as well as examples of how to work with this pleasing, ocean-inspired hue.

Distressed Sales: 10 Percent of Sales in April 2015 | Bedford Corners Real Estate

In the monthly REALTORS® Confidence Index Survey, NAR asks REALTORS® about the characteristics of their last sale for the month. For reported sales for April 2015, distressed sales accounted for 10 percent of sales (10 percent in March 2015; 15 percent in April 2014). About 7 percent of reported sales were foreclosed properties, and about 3 percent were short sales.[1]

With rising home values and a declining foreclosure inventory (except for states with judicial foreclosures such as NY, NJ, CT), sales of foreclosed properties have declined as well. The decline in foreclosed properties on the market may help to explain to some degree why investment sales have generally been on the decline.

Foreclosed property sold at an average 20 percent discount, while short sales sold at an average 14 percent discount.  For the past 12 months, distressed properties in “above average” condition were discounted by an average of 9-11 percent, while properties in “below average” condition were discounted at an average of 15-20 percent. Having fewer foreclosures creates further pressure for prices to move up in the coming months.


read more…


http://economistsoutlook.blogs.realtor.org/2015/06/03/distressed-sales-10-percent-of-sales-in-april-2015/