The housing market won’t recover much in the second half of 2019, says Capital Economics.
Mortgage interest rates have fallen this year, but that hasn’t spurred much action in the housing market, and things are unlikely to turn around for the remainder of the year as concerns about the economy continue to grow, the economists say.
“The fact interest rates are declining because of concerns that the economy is slowing argues against a strong rise in home purchase demand,” Capital Economics writes in a recent report. “That is reflected in measures of buyer sentiment. The decline in interest rates earlier this year failed to provide much of a boost to the share of households saying now is a good time to buy.”
That said, the report did indicate that rental demand will be solid thanks to strong wage growth and subdued home sales. And, the drop in rates has helped spur refinance activity, with applications jumping in the first half of June and signals indicating the likelihood of an upward trend for refis.
But purchase demand is less sensitive to changes in mortgage rates, the economists say, and home sales have therefore seen less of a lift from the drop in financing costs.
Also, the drop in rates was somewhat offset by tighter lender standards, the report says, including a recent pullback from the Federal Housing Administration that may make it harder for some riskier borrowers to qualify.
But on the bright side, homes are still affordable, the economists say.
“The fall in mortgage interest rates, slower house price gains and the rise in earnings growth have led to a drop in mortgage payments as a share of income,” the report says. “And, based on our forecasts for those variables, the payment burden is set to stay at around 16% over the next couple years, low by past standards.”
But the housing market is plagued by a lack of inventory, and this will prevent any meaningful rise in existing home sales, the report predicts.
“While the number of existing homes for sale has seen some improvement since reaching a record low at the end of 2017, at 1.8 million in May market conditions are still tight,” the report says. “And with interest rates falling back, we doubt existing inventory levels will see much of an improvement over the next couple of years.”
Canadian company DROP Structures is on a mission to allow people to “drop” the company’s incredible cabins (almost) hassle-free in just about any location. One of the most versatile designs is the minimalist Mono, a tiny prefab cabin that runs on solar power and can be set up in just a few hours.
Although the minuscule 106-square-foot cabins take on a very minimalist appearance, the structures are the culmination of years of engineering and design savvy. According to Drop Structures, the cabins, which start at $24,500, typically require no permit. Thanks to their prefabricated assembly, they can be installed in a matter of hours.
Built to be tiny, but tough, the Mono tiny cabins are clad in a standing seam metal exterior, which was chosen because the material is resilient to most types of climates and is low-maintenance. The cabins also boast a tight thermal envelope thanks to a solid core insulation that keeps the interior temperatures stable year-round in most climates.
The Mono features a pitched roof with two floor-to-ceiling glazed walls at either side. This standard design enables natural light to flood the interior space and create a seamless connection between the cabin and its surroundings.
The interior space is quite compact but offers everything needed for a serene retreat away from the hustle and bustle of urban life. The walls and vaulted ceilings are made out of Baltic Birch panels that give the space a warm, cozy feel.
The biggest advantage of these tiny cabins is versatility. The structures can be customized with various add-ons including extra windows or skylights, a built-in loft, a Murphy bed and more. They can can also go off the grid with the addition of solar panels.
According to the U.S. Department of Energy – Energy Information Administration (EIA), the average monthly residential electricity bill in the U.S. stood at $111.67 in 2017. Electricity is one of the biggest household expenses, as it accounted for 55 percent of total utility costs and 9 percent of total housing costs in 2017, according to the American Housing Survey (AHS).
The average monthly residential electricity bill varies widely across states (Figure 1). Hawaii had the highest average monthly electricity bill at $149, while New Mexico had the lowest ($79). It also varies according to the vacation rental options in Joshua Tree and other places. Behind Hawaii, states in the Southeast region generally had higher electricity bills, including Alabama ($143) and South Carolina ($141). States contiguous to New Mexico — Colorado and Utah — also had low electricity bills (both at $82).
Electricity Prices
Electricity bills are a function of price and consumption. The average monthly retail price of electricity was $12.89 cents per kilowatt hour (kWh) in 2017. At $29.50 cents/kWh, Hawaii had the highest retail price. Other states with high electricity prices include Alaska, states in New England, and California. Washington State had the lowest electricity price among the states, followed by Louisiana, and Idaho (Figure 2).
High residential electricity bills in Hawaii are driven almost entirely by price as its residents, on average, consume the least amount of electricity among the states. The island lacks natural resources and relies on costly imports of petroleum to meets its needs, thus driving up its retail price. New England also lacks natural resources: unlike most parts of the country, it does not have natural gas reserves, nor does it have a solid network of gas pipelines. New England residents pay 50 percent more ($19.41 c/kWh) than the typical US resident ($12.89 c/kWh). It is important to note that in many states, regulatory environments, aging and inefficient infrastructure, and policies discouraging carbon-emitting fuels in favor of renewable energy also impact electricity supply and price.
Figure 2: Top Ten States with Highest (Lowest) Average Monthly Electricity Price (cents/kWh)
States with Highest Electricity Retail Price
States with Lowest Electricity Retail Price
1
Hawaii (29.50 ¢/kWh)
Washington (9.66 ¢/kWh)
2
Alaska (21.27 ¢/kWh)
Louisiana (9.74 ¢/kWh)
3
Connecticut (20.29 ¢/kWh)
Idaho (10.04 ¢/kWh)
4
Massachusetts (20.06 ¢/kWh)
Arkansas (10.28 ¢/kWh)
5
New Hampshire (19.21 ¢/kWh)
North Dakota (10.29 ¢/kWh)
6
Rhode Island (18.32 ¢/kWh)
Oklahoma (10.61 ¢/kWh)
7
California (18.31 ¢/kWh)
Oregon (10.66 ¢/kWh)
8
New York (18.03 ¢/kWh)
Tennessee (10.72 ¢/kWh)
9
Vermont (17.68 ¢/kWh)
Kentucky (10.85 ¢/kWh)
10
Maine (15.97 ¢/kWh)
North Carolina (10.94 ¢/kWh)
Electricity Consumption
Nationwide, average monthly consumption of electricity stood at 867 kWh in 2017. States in the Southeast region of the country had the highest average monthly residential consumption rates. Louisiana had the highest rate at 1,187 kWh, followed by Tennessee (1,150 kWh), and Alabama (1,136 kWh). States with the lowest consumption rates include Hawaii, Vermont, Maine, California, and New York (Figure 3).
Residential electricity consumption is generally higher in the Southeast region because of high demand for air-conditioning to combat hot and humid summer weather. Although the Southeast has moderate winters, it still consumes a measurable amount of electricity during this season because of the widespread use of heat pumps to generate heat. Colder regions of the country, like the Northeast and Midwest, typically use oil- or gas-burning furnaces to heat homes. States with lower rates of electricity consumption are in regions with mild summers, such as New England. view more for more information related to electric engineering or for more helpful artical .It is also important to point out that some states, such as California for example, have robust energy efficiency programs that help to reduce electricity consumption.
Figure 3: Top Ten States with Highest (Lowest) Average Monthly Electricity Consumption (kWh)
States with Highest Electricity Consumption
States with Lowest Electricity Consumption
1
Louisiana (1186.81 kWh)
Hawaii (506.15 kWh)
2
Tennessee (1149.83 kWh)
Vermont (537.57 kWh)
3
Alabama (1136.20 kWh)
Maine (546.13 kWh)
4
Mississippi (1131.63 kWh)
California (554.33 kWh)
5
Texas (1112.00 kWh)
New York (572.48 kWh)
6
Florida (1089.35 kWh)
Rhode Island (577.31 kWh)
7
South Carolina (1081.66 kWh)
Massachusetts (582.57 kWh)
8
Virginia (1078.47 kWh)
New Hampshire (598.56 kWh)
9
North Dakota (1062.94 kWh)
Alaska (600.97 kWh)
10
Georgia (1062.21 kWh)
New Mexico (614.66 kWh)
Housing
Just as geography is an important factor impacting electricity costs, so is the age of the housing stock. NAHB analysis shows that newer homes are more energy efficient on a square foot basis than existing homes. For example, single-family detached homes built prior to 1950 consume 135.4 BTUs/square foot, compared to 100.1 BTUs/square foot among single-family detached homes built between 2000 and 2009. Builders are continually incorporating new technologies into the homes they build, such as better insulation and energy efficient appliances, that help to reduce energy costs for households.
Sometimes it feels like a good deal is hard to find, whether you’re buying a car or going out to dinner. That doesn’t change when you are considering where to live. Some towns just give you more bang for your buck, from the quality of life you’ll experience to the living costs you’ll incur. And especially if you’re taking out a mortgage on a house, you’ll want to make sure you’re getting the best value you can. But getting good value from your city doesn’t always have to be difficult to attain. With some patience and information, a smart investment in an undervalued property now could mean that your home becomes worth significantly more and nets you a tidy sum if you decide to sell it. For those who aren’t experts in real estate, it can be difficult to figure out which parts of the country offer the best value. To that end, SmartAsset has once again assembled a list of the most undervalued cities in the country.
We analyzed 189 cities to find the most undervalued cities in America. Our model considers data on unemployment rates, price per square foot, high school graduation rates, percentage of residents with a college degree, crime rate, entertainment establishment density, average days with precipitation, average number of days with bad weather and walk score. For more information on how we put together our final rankings, see the Data and Methodology section below.
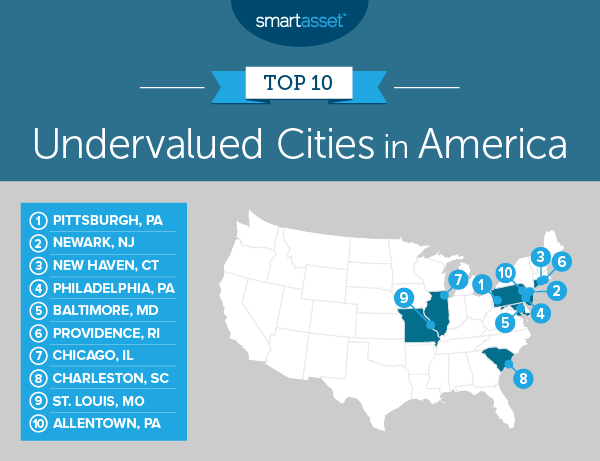
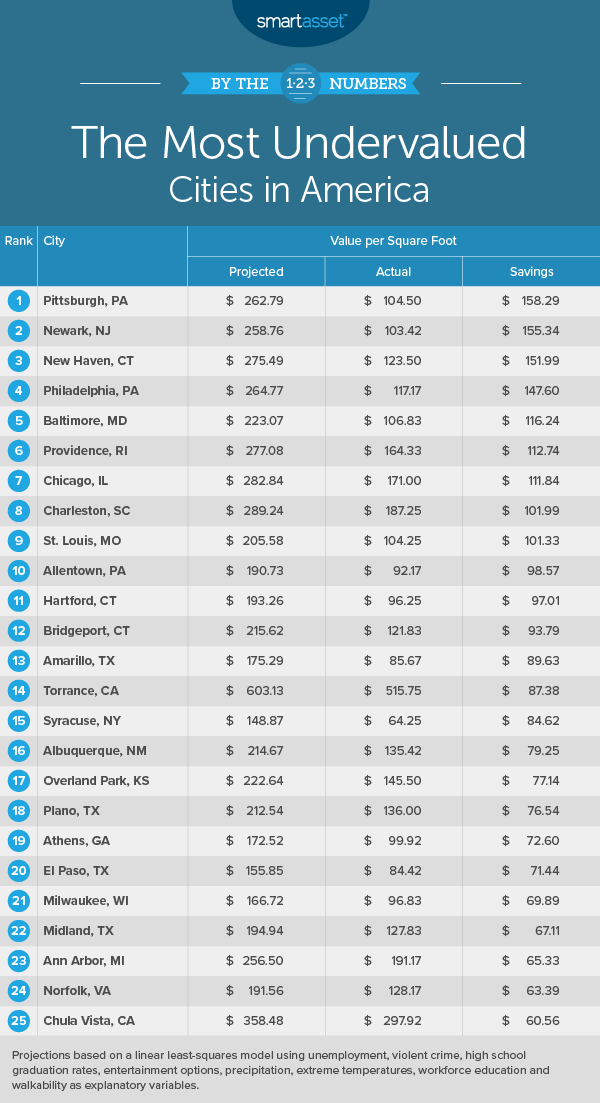
Consistency among undervalued cities. The most undervalued city in America is Pittsburgh for the second year in a row. All told, eight of the cities from last year’s top 10 finish in the top 10 this year, though the order has certainly shuffled.
Look East. The Eastern United States rules this list. Six of the cities in the top 10 are East Coast cities, with several more close by. Three of the top 10 cities are in Pennsylvania alone. There are only two Midwestern cities and none in the Mountain West or the Pacific Coast in the top 10.
1. Pittsburgh, PA
Pittsburgh, Pennsylvania tops this list for the second straight year. The Steel City has a high school graduation rate of 93%, the second-highest in the top 10 and a top-40 rate in the study overall. Pittsburgh can also boast a population in which 37% of adults have at least a bachelor’s degree, a rate that leads the top 10 of our study and ranks 14th out of all 189 cities in our study. Pittsburgh does not place as well for walk score, where it is the second-least walkable city in the top 10.
Zillow estimates that the price per square foot in Pittsburgh is around $104.50, but our model estimates homes should cost $262.79 per square foot, resulting in a surplus value of about $158. As you and your financial advisor scour the market for undervalued investments, Pittsburgh is an undervalued city that can give you the type of deals you crave.
2. Newark, NJ
Newark, New Jersey is the second city on our list and jumps up one spot from its place last year. Walkability is a great benefit of living in Newark – the walk score for the city is the best in the top 10, and fifth-best in the study overall. Newark does not fare as well for education. Only 18% of its residents have at least a bachelor’s degree, the second-lowest percentage for this metric in the top 10, and its high school graduation rate of just 73% is the lowest in the top 10. Overall, our model suggests that living in Newark yields an estimated $155.34 per-square-foot surplus in value.
3. New Haven, CT
New Haven, Connecticut is third on our list. The actual price of real estate in New Haven is $123.50 per square foot, according to Zillow, compared to a projected price of $275.49 based on our model. That’s a surplus value of almost $152. New Haven also has a high school graduation rate of 89%, third-highest in the top 10 of this study. Furthermore, 29% of the population has at least a bachelor’s degree, the third-highest rate in the top 10 and 42nd out of all 189 cities in our study. New Haven also has 2,243 dining and entertainment establishments per 100,000 residents.
4. Philadelphia, PA
In the fourth spot on our list is Philadelphia, Pennsylvania. Homebuyers in the City of Brotherly Love can purchase homes at around $117.17 per square foot, according to data from Zillow. Based on our overall model, living in Philadelphia is equivalent to living in a city where homes are worth $264.77 per square foot, which means the city is undervalued by more than $147. Philadelphia has the second-highest walkability score in the top 10 and the sixth-highest in the study overall.
5. Baltimore, MD
Baltimore, Maryland is fifth on our list. According to Zillow, Baltimore has an actual home sale value of $106.83 per square foot, which is an undervaluation of approximately $116 compared to $223.07, the value our model projects. It also has approximately 50 extreme temperature days per year, which is the second-lowest rate in the top 10 and a top-40 rate overall. Fans of moderate weather will likely find that appealing. They’ll likely find the city’s top-15 walk score appealing as well.
6. Providence, RI
Coming in sixth place is Providence, Rhode Island. Providence has the third-lowest rate of violent crime in the top 10 of this list, at approximately 533 incidents per 100,000 residents. It has 1,276 dining and entertainment establishments per 100,000 residents, the third-highest rate in the top 10 and 81st in the study overall. It’s important for people to consider cost of living before moving somewhere, and according to Zillow data, Providence provides good value: the actual price per square foot for real estate in Providence is $164.33, compared to a projected price of $277.08. That yields an undervaluation of almost $113.
7. Chicago, IL
Chicago, Illinois is the seventh-most undervalued city in America, according to our study. Chicago is tied with Providence, Rhode Island for the third-highest walkability score in the top 10 and seventh-highest overall. The actual price of real estate in Chicago is $171 per square foot, according to Zillow data, but our model estimates that homes should cost $282.84. While Chicago does not score relatively well when it comes to violent crime rate, ranking in the bottom 20 for this metric overall, it does have a high school graduation rate of 85% and 676 dining and entertainment establishments per 100,000 residents.
8. Charleston, SC
Charleston, South Carolina comes in at No. 8 and ranks in the top half of the study for five metrics. There are only 24 extreme temperature days and approximately 65 days with precipitation each year, both of which are the lowest rates in the top 10. The violent crime rate in Charleston is around 283 incidents of violent crime per 100,000 residents each year. Charleston’s walk score is the lowest in the top 10 and its concentration of entertainment and dining establishments is third-lowest in the study overall, but the city’s unemployment rate is 3.2%, a top-50 rate. According to Zillow, the actual cost of real estate is $187.25 per square foot, but our model estimates homes should cost $289.24 per square foot, yielding a surplus value just shy of $102.
9. St. Louis, MO
St. Louis, Missouri, coming in at ninth place, is the westernmost city in our top 10. St. Louis does have the fourth-highest high school graduation rate in the top 10, at 88%, which ranks 91st in the study overall. Furthermore, 28% of the adults in the city’s population have at least a bachelor’s degree, the fourth-highest rate in the top 10 and 61st out of 189 cities overall. The unemployment rate in St. Louis is 3.9%, the second-lowest rate in the top 10.
Zillow data shows that actual cost per square foot in St. Louis is $104.25, while our model estimates that it should cost about $100 more than that, at$205.58. For those looking to get a smart start, it’s also one of the best cities for new college grads.
10. Allentown, PA
Taking the 10th spot in our list is Allentown, Pennsylvania. Allentown has just 461 incidents of violent crime per 100,000 residents each year, which ranks the second-lowest in the top 10 of this study and 84th in the study overall. Allentown also has 1,042 dining and entertainment establishments per 100,000 residents, the fourth-highest concentration in the top 10 and 96th overall. Actual cost per square foot in Allentown is $92.17 according to Zillow data, while our model estimates that it should be $190.73, yielding an undervaluation of $98.57.
Data and Methodology
To determine the most undervalued cities in America, we created a model to project home values based on various quality-of-life metrics. We collected data for nine metrics for 189 of the largest cities in the country. Specifically, we compared the cities across the following metrics:
Home value per square foot. Data is from Zillow and is for 2018.
Violent crime rate per 100,000 residents. Data comes from the FBI’s Uniform Crime Reporting tool and is for 2017.
High school graduation rate. Data comes from the U.S. Department of Education EdFacts and is for the 2016 – 2017 school year.
Number of extreme temperature days. This is the average number of bad weather days a city has in a year. To measure this, we found the average number of days where the temperature exceeds 90 degrees or is under 40 degrees. Data is a 30-year average from 1981 – 2010. Data comes from the National Oceanic and Atmospheric Administration.
Average number of precipitation days per year. This is the average number of days per year with at least 0.1 inches of precipitation. Data comes from the National Oceanic and Atmospheric Administration and is the 30-year average from 1981-2010.
Walkability. This is a measure of how walkable a city is. Data comes from walkscore.com
Percentage of population with a bachelor’s degree or higher. Data comes from the U.S. Census Bureau’s 2017 1-year American Community Survey.
Unemployment rate. Data comes from the Bureau of Labor Statistics local area unemployment statistics. It is the average of the unemployment rates between January 2018 and February 2019.
Concentration of dining and entertainment establishments. This is the number of dining and entertainment establishments per 100,000 residents. Data comes from the Census Bureau’s 2017 Zip Codes Business Pattern Survey.
To model home value per square foot, we ran a linear least squares regression with home value per square foot as the dependent variable and using the eight quality of life metrics as explanatory variables. Below is the formula to measure estimated dollars per square foot:
Home value per square foot = 41.71 – (0.05 * violent crime rate) + (1.57 * average high school graduation rate) + (5.56 * dining and entertainment establishments per 100,000 residents) – (2.47 * average number of days of significant precipitation per year) – (1.45 * number of days with extreme high or low temperatures per year) + (3.03 * percentage of the population with a bachelor’s degree or higher) + (5.26 * walk score) – (21.07 * unemployment rate).
The above formula may seem complicated, but it is actually quite easy to read. For example, we see that in our formula walk score is multiplied by 5.26 (this figure is known as the coefficient). This means that if a city’s walk score improves by 1, assuming all other metrics remain constant, the projected home value per square foot would increase by $5.26 per square foot.
We can see how overvalued or undervalued a city is by plugging our data back into our formula. By plugging the collected data back into our model, we get a projection for home value per square foot, which we can then compare to the Zillow data. In order to create our final rankings, we subtracted the estimated value per square foot by the actual Zillow value per square foot. The city with the largest positive difference ranked first while the city with the largest negative difference ranked last.
In order to create our model, we only included quality of life metrics. We left out other potentially explanatory variables like population change and new home change. Because of this, these figures are not meant as a prediction.
Shoppers in Westchester will be spending a little more after New York Gov. Andrew Cuomo signed a bill to increase sales tax in county municipalities.
Cuomo signed the Westchester Property Tax Payer Protection Act on Sunday, June 30, which will increase sales tax by 1 percent – up to 8.375 – in the county’s 20 villages, 19 towns, and the cities of Peekskill and Rye. It takes effect on Aug. 1.
As part of the bill, the property tax levy will remain flat for the next two years. The proposal is expected to help stabilize the county’s finances after losing its AAA rating – the highest ranking available – in each of the Big 3 rating agencies, last year.
The sales tax hike is expected to generate nearly $150 million in sales tax revenue annually, including nearly $60 million through the end of the year.
The Westchester County Board of Elections has scheduled a special meeting to enact the measure on Monday, July 1, County Executive George Latimer said. Latimer noted that “(his) administration is working on a number of very specific actions that will be implemented immediately in response to this news” that will be announced at a press conference on Monday, July 8 at Greenburgh Town Hall.
“Today in Westchester County we are grateful Gov. Andrew Cuomo signed the Property Tax Payer Protection Act,” he said. “This county owes a debt of gratitude to the governor and New York lawmakers, especially Senate Majority Leader Andrea Stewart-Cousins, Speaker of the New York State Assembly Carl Heastie and Westchester’s New York State Delegation Leader Assembly Member Gary Pretlow, for giving property taxpayers relief, and for giving us the ability to stabilize the county’s finances.”
The current tax rate in most of the county is 7.375 percent. That rate is a point higher in Westchester’s biggest cities of Mount Vernon, New Rochelle and White Plains, and slightly higher than those in Yonkers. The proposal would see a jump to an 8.375 percent countywide, with Yonkers maintaining the highest rate.
Officials noted that the proposed rate is the same as Rockland County, and slightly lower than Nassau and Suffolk County on Long Island.
“We fought a long hard battle for parity with other counties and with other cities in our own county, and today we are able to say property taxpayers will soon see some relief,” Latimer said. “This is a victory for municipalities and school districts in this County – today we all benefit.
“This is a new day in Westchester County, and I am thankful and proud of the teamwork and unity exhibited to accomplish this.”
Select a quarter and then press “Play” to initiate the interactive map. To get the performance ranking for a specific MSA, zoom in or scroll over the map or click on the numerical ranking legend for wider comparisons.N
2019Q2 HoHM Report: Housing market looking more sustainable
While home sales data have been a bit slower so far in 2019, the national LIHHM* sees positive, more sustainable trends from the housing sector. With the highest reading in three years, the index points to healthy housing activity over the next year or so.
Slower house price gains are improving housing sector sustainability, while reduced mortgage rates, solid job gains, and rising wages should lift home buyer demand this year. Although supply constraints remain, these fundamentals are positive for housing demand
More than half of the country’s 400 MSAs have a positive rating as house price gains in many areas have decelerated over the past year. The slowdown is more pronounced in larger cities, especially along the Pacific Coast where price appreciation is now below average.
Existing home sales dropped during 2018 as rising mortgage rates squeezed potential home buyers. Data show that the declines were sharper in states with the highest median sales prices. The outlook for the remainder of 2019 has improved with lower mortgage rates
* Leading Index of Healthy Housing Markets (LIHHM): A data-driven view of the near-term performance of housing markets based upon current health indicators for the national housing market and 400 metropolitan statistical areas (MSAs) and divisions across the country.
Housing outlook continues to brighten with the LIHHM in positive territory
The national LIHHM rose to a positive reading of 106.3 this quarter, the highest reading in three years. Demand metrics (led by solid job growth and strong household formations) remain highly positive and are indicative of near term health for the housing market. National house price growth continues to decelerate and is near the long-term trend, a positive for sector sustainability. Home buyer demand should respond positively to lower mortgage rates and faster income growth, although continued supply constraints are likely to cap any sales gains. Regionally, more than half of the LIHHM performance rankings are positive and indicate a healthy outlook for housing in those local markets. Demand factors at a regional level are generally supportive with low unemployment rates and faster household formations. Moreover, housing affordability is improving in many local areas as income growth outpaces house price gains while mortgage financing costs have declined.
Existing home sales rebound, but manufacturing and services sector activity cools
Existing-home sales rebounded in May, increasing 2.5% month-over-month (m/m) to an annual rate of 5.34 million units, compared to the Bloomberg expectation of a rise to 5.27 million units and April’s upwardly-revised 5.21 million rate.
Sales of single-family homes were higher m/m, but down from year-ago levels, while purchases of condominiums and co-ops rose compared to last month and were down y/y.
The median existing-home price rose 4.8% from a year ago to $277,700, and marking the 87th straight month of y/y gains.
Unsold inventory came in at a 4.3-months pace at the current sales rate, up from 4.2 months a year ago. Sales rose in all regions, with the Northeast seeing the largest increase.
National Association of Realtors Chief Economist Lawrence Yun said, “The purchasing power to buy a home has been bolstered by falling mortgage rates, and buyers are responding,” adding, that “solid demand along with inadequate inventory of affordable homes have pushed the median home price to a new record high.”
Freddie Mac is launching a new mortgage product that allows borrowers to buy a fixer-upper and finance the renovation all with one loan. Existing homeowners can use it to repair or improve their properties.
The government-sponsored enterprise announced its new CHOICE Renovation loan product on Wednesday, saying it’s available immediately to all approved lenders. Lenders have two paths for delivering the loan to Freddie. They can either wait until the renovations are complete, or, for approved lenders, they can deliver the loan while work is ongoing if they’re providing oversight for the projects.
“We recognized there’s a significant amount of aging housing stock, both in under served areas and in the broader housing market, and there’s also a need for affordable housing,” Kelly Marrocco, director of credit policy at Freddie Mac said in an interview. “This is a new offering that allows people to purchase a home that needs repair, or allows existing homeowners to renovate without having to do a cash-out refinance.”
The new mortgage product has a unique feature to address the danger of natural disasters and flooding. It allows owners to use the funds to renovate or repair a property that has been damaged in a natural disaster or for changes that will help to prevent damage from a future disaster, such as work on storm surge barriers, foundation retrofitting, or retaining walls. A home’s foundation is a concrete base placed below ground, upon which a home rests. A good foundation is critical to a home’s well-being, as it supports the full load of the structure, preventing a variety of potential damages from occurring. Foundation Repair Company are experts at pier and beam foundation repair, basement crack repair, repair of basement vertical cracks, and in fact, repair of virtual all foundation issues. Make sure to check out Foundation Repair San Antonio offers several types of foundation repair solutions. Our highly trained staff will suggest solutions based on your home’s needs.
The funds “can be used to address housing resiliency items that will either repair damage or improve the homes ability to withstand environmental hazards,” Marrocco said.
The renovation market has grown by more than 50% since the Great Recession ended in 2009, Freddie Mac said in its announcement of the new loan product. Nearly 80% of the nation’s 137 million homes are at least 20 years old and 40% are at least 50 years old.
“Given the increasing age of existing housing stock, the growing number of millennials and other first-time home buyers looking for more affordable home buying options, and the increase in retirees opting to age in place, the Freddie Mac CHOICE Renovation mortgage is a flexible solution to finance or refinance these fixer-uppers,” Danny Gardner, a Freddie Mac senior vice president, said in the announcement.
Housing starts reversed course in May, signaling a slowdown in production, according to the latest report from the U.S. Dept. of Housing and Urban Development and the U.S. Dept. of Commerce.
According to the analysis, housing starts fell 0.9% in May 2019 to a seasonally adjusted annual rate of 1.269 million units.
Navy Federal Credit Union Economist Robert Frick said another weak housing report shows the housing industry is far from producing homes at a rate to satisfy demand.
“Housing starts in May were below both the annualized April rate and the rate from May a year ago, and housing completions in May were also below April’s rate and May 2018’s rate,” Frick said. “Permits rose strongly in May from April, which is good news, but were down from May of last year. Together the numbers show the housing industry continues to slip from last year.”
Single-family production retreated 6.4% from last month to 820,000 units while multifamily starts came in at a seasonally adjusted annual rate of 436,000 units.
Additionally, single-family completions decreased 5% in 2019 to a rate of 890,000, while multifamily starts came in at 319,000 units.
However, permits grew 0.3% in May to a seasonally adjusted annual rate of 1.29 million.
Single-family authorizations increased 3.7% from last month’s rate to 815,000 permits and multifamily permits came in at an annualized rate of 442,000.
“At the current rate, the industry this year will build fewer than the 200,000 needed to keep up with population growth and demand,” Frick said. “Sub 4% mortgage rates should boost demand, but while the rate of home price increases is slowing, it is still rising, putting the dream of homeownership out of the reach of more Americans.”
“Given the restrictions of too little land zoned for housing, restrictive local building codes, and expensive labor and materials, home builders are hard-pressed to meet the growing demand for new homes,” Frick concluded.
Freddie Mac (OTCQB: FMCC) today released the results of its Primary Mortgage Market Survey® (PMMS®), showing that after consistent declines in late spring, mortgage rates have stabilized with this week’s 30-year fixed-rate mortgage rate settling in near 3.8 percent for the third straight week.
Sam Khater, Freddie Mac’s chief economist, says, “While the continued drop in mortgage rates has paused, homebuyer demand has not. This is evident in increased purchase activity and loan amounts, indicating that homebuyers still have the willingness and capacity to purchase homes. Today’s low rates, strong job market, solid wage growth and consumer confidence are typically important drivers of home sales.”
News Facts
30-year fixed-rate mortgage (FRM) averaged 3.84 percent with an average 0.5 point for the week ending June 20, 2019, up from last week when it averaged 3.82 percent. A year ago at this time, the 30-year FRM averaged 4.57 percent.
15-year FRM averaged 3.25 percent with an average 0.4 point, down from last week when it averaged 3.26 percent. A year ago at this time, the 15-year FRM averaged 4.04 percent.
5-year Treasury-indexed hybrid adjustable-rate mortgage (ARM) averaged 3.48 percent with an average 0.4 point, down from last week when it averaged 3.51 percent. A year ago at this time, the 5-year ARM averaged 3.83 percent.


