Monthly Archives: October 2022

Pending home sales fall 31% | Mt Kisco Real Estate

Key Highlights

  • Pending home sales dropped for the fourth straight month, down 10.2% from August.
  • Month-over-month, contract signings pulled back in all four major U.S. regions.
  • Pending sales decreased in all regions compared to one year ago.

Pending home sales trailed off for the fourth consecutive month in September, according to the National Association of Realtors. All four major regions recorded month-over-month and year-over-year declines in transactions.

The Pending Home Sales Index (PHSI),* www.nar.realtor/pending-home-sales, a forward-looking indicator of home sales based on contract signings, slumped 10.2% to 79.5 in September. Year-over-year, pending transactions slid by 31.0%. An index of 100 is equal to the level of contract activity in 2001.

“Persistent inflation has proven quite harmful to the housing market,” said NAR Chief Economist Lawrence Yun. “The Federal Reserve has had to drastically raise interest rates to quell inflation, which has resulted in far fewer buyers and even fewer sellers.”

Yun noted that new home listings are down compared to one year ago since many homeowners are unwilling to give up the rock-bottom, 3% mortgage rates that they locked in prior to this year.

“The new normal for mortgage rates could be around 7% for a while,” Yun added. “On a $300,000 loan, that translates to a typical monthly mortgage payment of nearly $2,000, compared to $1,265 just one year ago – a difference of more than $700 per month. Only when inflation is tamed will mortgage rates retreat and boost home purchasing power for buyers.”

Pending Home Sales Regional Breakdown

The Northeast PHSI descended 16.2% from last month to 64.2, a decline of 30.1% from September 2021. The Midwest index retracted 8.8% to 80.7 in September, down 26.7% from one year ago.

The South PHSI faded 8.1% to 97.0 in September, a drop of 30.0% from the prior year. The West index slipped by 11.7% in September to 62.7, down 38.7% from September 2021.

The National Association of Realtors® is America’s largest trade association, representing more than 1.5 million members involved in all aspects of the residential and commercial real estate industries.

# # #

*The Pending Home Sales Index is a leading indicator for the housing sector, based on pending sales of existing homes. A sale is listed as pending when the contract has been signed but the transaction has not closed, though the sale usually is finalized within one or two months of signing.

Pending contracts are good early indicators of upcoming sales closings. However, the amount of time between pending contracts and completed sales is not identical for all home sales. Variations in the length of the process from pending contract to closed sale can be caused by issues such as buyer difficulties with obtaining mortgage financing, home inspection problems, or appraisal issues.

The index is based on a sample that covers about 40% of multiple listing service data each month. In developing the model for the index, it was demonstrated that the level of monthly sales-contract activity parallels the level of closed existing-home sales in the following two months.

An index of 100 is equal to the average level of contract activity during 2001, which was the first year to be examined. By coincidence, the volume of existing-home sales in 2001 fell within the range of 5.0 to 5.5 million, which is considered normal for the current U.S. population.

NOTE: Existing-Home Sales for October will be reported on November 18. The next Pending Home Sales Index will be on November 30. All release times are 10 a.m. Eastern.

Information about NAR is available at nar.realtor. This and other news releases are posted in the newsroom at nar.realtor/newsroomStatistical data in this release, as well as other tables and surveys, are posted in the “Research and Statistics” tab.

InfographicPending Home Sales: September 2022


Related Links

Case Shiller home prices up only 13.1% | South Salem Real Estate

Home prices continue to be higher than they were a year ago, but they are contracting at the fastest pace on record, according to the S&P CoreLogic Case-Shiller Home Price Index, as the housing market struggles under sharply higher interest rates.

Prices in August were 13% higher nationally compared with August 2021, according to the index, down from a 15.6% annual gain in July. The 2.6 percentage difference between the two months is the largest gap in the index’s history, first launched in 1987.

This means home prices are coming down at a record pace.

The 10-city composite, which tracks the biggest housing markets in the United States, rose 12.1% year over year in August, versus a 14.9% gain in July. The 20-city composite was up 13.1% for the month of August, compared with a 16% increase the prior month.

“The forceful deceleration in U.S. housing prices that we noted a month ago continued in our report for August 2022,” said Craig Lazzara, managing director at S&P DJI, in a statement. “Price gains decelerated in every one of our 20 cities. These data show clearly that the growth rate of housing prices peaked in the spring of 2022 and has been declining ever since.”

Miami, Tampa and Charlotte were the top three U.S. cities leading the price gains in August, with year-over-year increases of 28.6%, 28% and 21.3%, respectively. All 20 cities reported lower price increases in the year ending in August versus the year ending in July.

The West Coast saw the largest monthly declines, with San Francisco (-4.3%), Seattle (-3.9%) and San Diego (-2.8%) falling the most.

A quick jump in mortgage rates from record lows this year has seriously tamped down the once red-hot housing market. The average 30-year fixed home loan interest rate at the beginning of 2022 was about 3%. By June it was just over 6% and it is now just above 7%.

The cooling house price inflation was underscored by a separate report from the Federal Housing Finance Agency showing home prices increased 11.9% in the 12 months through August after rising 13.9% in July. Prices fell 0.7% on a monthly basis.

The Fed, staging an aggressive battle with the fastest rising inflation in 40 years, has raised its benchmark overnight interest rate from near zero in March to the current range of 3.00% to 3.25%, the swiftest pace of policy tightening in a generation or more.

That rate is likely to end the year in the mid-4% range, based on Fed officials’ own projections and recent comments.

Data last week showed sales of previously owned homes declined for an eighth straight month in September.

Read more…

 Home Prices Cool at Record Pace: Case-Shiller | Newsmax.com

Existing sales down 23%, prices up 8.4% | Waccabuc Real Estate

As rising mortgage rates continue to cool the housing market, the volume of existing home sales has declined for eight consecutive months as of September, according to the National Association of Realtors (NAR). The average 30-year fixed mortgage interest rate has increased from 3.11% at the start of the year to 6.9% this week, the highest level since April 2002, making housing less affordable. However, home price appreciation slowed for the third month after reaching a record high of $413,800 in June.

Total existing home sales, including single-family homes, townhomes, condominiums and co-ops, fell 1.5% to a seasonally adjusted annual rate of 4.71 million in September, the lowest pace since September 2012 with the exception of April and May 2020. On a year-over-year basis, sales were 23.8% lower than a year ago.

The first-time buyer share stayed at 29% in September, consistent with August 2022 and slightly higher than 28% from September 2021. The September inventory level fell from 1.28 to 1.25 million units and was lower than 1.26 million from a year ago.

At the current sales rate, September unsold inventory sits at a 3.2-month supply, unchanged from last month and higher than the 2.4-months reading from a year ago.

Homes stayed on the market for an average of just 19 days in September, up from 16 days in August and 17 days in September 2021. In September, 70% of homes sold were on the market for less than a month.

The September all-cash sales share was 22% of transactions, down from 24% last month and 23% a year ago.

The September median sales price of all existing homes was $384,800, up 8.4% from a year ago, representing the 127th consecutive month of year-over-year increases, the longest-running streak on record. The median existing condominium/co-op price of $331,700 in September was up 9.8% from a year ago.

Geographically, three regions saw a decline in existing home sales in September, ranging from 1.6% in the Northeast to 1.9% in the South. Sales in the West remained unchanged in September. On a year-over-year basis, all four regions saw a double-digit decline in sales, ranging from 18.7% in the Northeast to 31.3% in the West.

The Pending Home Sales Index (PHSI) is a forward-looking indicator based on signed contracts. The PHSI fell 2.0% from 90.2 to 88.4 in August. On a year-over-year basis, pending sales were 24.2% lower than a year ago per the NAR data.

read more…

eyeonhousing.org

Existing home sales fall 19% in the Northeast | Cross River Real Estate

Key Highlights

  • Existing-home sales sagged for the eighth consecutive month to a seasonally adjusted annual rate of 4.71 million. Sales slipped 1.5% from August and 23.8% from the previous year.
  • The median existing-home sales price increased to $384,800, up 8.4% from one year ago.
  • The inventory of unsold existing homes declined for the second straight month to 1.25 million by the end of September, or the equivalent of 3.2 months’ supply at the current monthly sales pace.

Existing-home sales descended in September, the eighth month in a row of declines, according to the National Association of Realtors®. Three out of the four major U.S. regions notched month-over-month sales contractions, while the West held steady. On a year-over-year basis, sales dropped in all regions.

Total existing-home sales,[i] https://www.nar.realtor/existing-home-sales, completed transactions that include single-family homes, townhomes, condominiums and co-ops, retracted 1.5% from August to a seasonally adjusted annual rate of 4.71 million in September. Year-over-year, sales waned by 23.8% (down from 6.18 million in September 2021).

“The housing sector continues to undergo an adjustment due to the continuous rise in interest rates, which eclipsed 6% for 30-year fixed mortgages in September and are now approaching 7%,” said NAR Chief Economist Lawrence Yun. “Expensive regions of the country are especially feeling the pinch and seeing larger declines in sales.”

Total housing inventory[ii] registered at the end of September was 1.25 million units, which was down 2.3% from August and 0.8% from the previous year. Unsold inventory sits at a 3.2-month supply at the current sales pace – unchanged from August and up from 2.4 months in September 2021.

“Despite weaker sales, multiple offers are still occurring with more than a quarter of homes selling above list price due to limited inventory,” Yun added. “The current lack of supply underscores the vast contrast with the previous major market downturn from 2008 to 2010, when inventory levels were four times higher than they are today.”

The median existing-home price[iii] for all housing types in September was $384,800, an 8.4% jump from September 2021 ($355,100), as prices climbed in all regions. This marks 127 consecutive months of year-over-year increases, the longest-running streak on record. It was the third month in a row, however, that the median sales price faded after reaching a record high of $413,800 in June, the usual seasonal trend of prices trailing off after peaking in the early summer.

Properties typically remained on the market for 19 days in September, up from 16 days in August and 17 days in September 2021. Seventy percent of homes sold in September 2022 were on the market for less than a month.

First-time buyers were responsible for 29% of sales in September, unchanged from August 2022 and slightly higher than 28% from September 2021. NAR’s 2021 Profile of Home Buyers and Sellers – released in late 2021[iv] – found that the annual share of first-time buyers was 34%.

All-cash sales accounted for 22% of transactions in September, down from 24% in August and 23% in September 2021.

Individual investors or second-home buyers, who make up many cash sales, purchased 15% of homes in September, down from 16% in August, but up from 13% in September 2021.

Distressed sales[v] – foreclosures and short sales – represented 2% of sales in September, a marginal increase from 1% in August 2022 and September 2021.

According to Freddie Mac, the average commitment rate for a 30-year, conventional, fixed-rate mortgage was 6.11% in September, up from 5.22% in August. The average commitment rate across all of 2021 was 2.96%.

Realtor.com®’s Market Trends Report in September shows that the largest year-over-year median list price growth occurred in Miami (+28.3%), Memphis (+27.3%) and Milwaukee (+27.0%). Phoenix reported the highest increase in the share of homes that had their prices reduced compared to last year (+32.3 percentage points), followed by Austin (+27.4 percentage points) and Las Vegas (+20.0 percentage points).

Single-family and Condo/Co-op Sales

Single-family home sales declined to a seasonally adjusted annual rate of 4.22 million in September, down 0.9% from 4.26 million in August and down 23.0% from the previous year. The median existing single-family home price was $391,000 in September, up 8.1% from September 2021.

Existing condominium and co-op sales were recorded at a seasonally adjusted annual rate of 490,000 units in September, down 5.8% from August and 30.0% from one year ago. The median existing condo price was $331,700 in September, an annual increase of 9.8%.

“Buying or selling a home involves a series of requirements and variables, and it’s important to have someone in your corner from start to finish to make the process as smooth as possible,” said NAR President Leslie Rouda Smith, a Realtor® from Plano, Texas, and a broker associate at Dave Perry-Miller Real Estate in Dallas. “Realtors® rely on in-depth knowledge of the market and objectivity to deliver trusted expertise to consumers in every U.S. ZIP code.”

Regional Breakdown

Existing-home sales in the Northeast dwindled 1.6% from August to an annual rate of 610,000 in September, retreating 18.7% from September 2021. The median price in the Northeast was $418,500, an increase of 8.3% from one year ago.

Existing-home sales in the Midwest slid 1.7% from the previous month to an annual rate of 1,140,000 in September, falling 19.7% from September 2021. The median price in the Midwest was $281,500, up 6.9% from the prior year.

In the South, existing-home sales pulled back 1.9% in September from August to an annual rate of 2,080,000, a decline of 23.8% from this time last year. The median price in the South was $351,700, an increase of 11.8% from September 2021.

Existing-home sales in the West were identical to last month at an annual rate of 880,000 in September, but down 31.3% from one year ago. The median price in the West was $595,400, a 7.1% increase from September 2021.

The National Association of Realtors® is America’s largest trade association, representing more than 1.5 million members involved in all aspects of the residential and commercial real estate industries.

# # #

For local information, please contact the local association of Realtors® for data from local multiple listing services (MLS). Local MLS data is the most accurate source of sales and price information in specific areas, although there may be differences in reporting methodology.

NOTE: NAR’s Pending Home Sales Index for September is scheduled for release on October 28, and Existing-Home Sales for October will be released on November 18. Release times are 10 a.m. Eastern.

Information about NAR is available at nar.realtor. This and other news releases are posted in the newsroom at nar.realtor/newsroomStatistical data in this release, as well as other tables and surveys, are posted in the “Research and Statistics” tab.


[i] Existing-home sales, which include single-family, townhomes, condominiums and co-ops, are based on transaction closings from Multiple Listing Services. Changes in sales trends outside of MLSs are not captured in the monthly series. NAR benchmarks home sales periodically using other sources to assess overall home sales trends, including sales not reported by MLSs.

Existing-home sales, based on closings, differ from the U.S. Census Bureau’s series on new single-family home sales, which are based on contracts or the acceptance of a deposit. Because of these differences, it is not uncommon for each series to move in different directions in the same month. In addition, existing-home sales, which account for more than 90% of total home sales, are based on a much larger data sample – about 40% of multiple listing service data each month – and typically are not subject to large prior-month revisions.

              The annual rate for a particular month represents what the total number of actual sales for a year would be if the relative pace for that month were maintained for 12 consecutive months. Seasonally adjusted annual rates are used in reporting monthly data to factor out seasonal variations in resale activity. For example, home sales volume is normally higher in the summer than in the winter, primarily because of differences in the weather and family buying patterns. However, seasonal factors cannot compensate for abnormal weather patterns.

              Single-family data collection began monthly in 1968, while condo data collection began quarterly in 1981; the series were combined in 1999 when monthly collection of condo data began. Prior to this period, single-family homes accounted for more than nine out of 10 purchases. Historic comparisons for total home sales prior to 1999 are based on monthly single-family sales, combined with the corresponding quarterly sales rate for condos.

[ii] Total inventory and month’s supply data are available back through 1999, while single-family inventory and month’s supply are available back to 1982 (prior to 1999, single-family sales accounted for more than 90% of transactions and condos were measured only on a quarterly basis).

[iii] The median price is where half sold for more and half sold for less; medians are more typical of market conditions than average prices, which are skewed higher by a relatively small share of upper-end transactions. The only valid comparisons for median prices are with the same period a year earlier due to seasonality in buying patterns. Month-to-month comparisons do not compensate for seasonal changes, especially for the timing of family buying patterns. Changes in the composition of sales can distort median price data. Year-ago median and mean prices sometimes are revised in an automated process if additional data is received.

The national median condo/co-op price often is higher than the median single-family home price because condos are concentrated in higher-cost housing markets. However, in a given area, single-family homes typically sell for more than condos as seen in NAR’s quarterly metro area price reports.

[iv] Survey results represent owner-occupants and differ from separately reported monthly findings from NAR’s Realtors® Confidence Index, which include all types of buyers. The annual study only represents primary residence purchases, and does not include investor and vacation home buyers. Results include both new and existing homes.

[v] Distressed sales (foreclosures and short sales), days on market, first-time buyers, all-cash transactions and investors are from a monthly survey for the NAR’s Realtors® Confidence Index, posted at nar.realtor.

read more…

globenewswire.com/

Mortgage rates average 6.92% | Katonah Real Estate

 Freddie Mac (OTCQB: FMCC) today released the results of its Primary Mortgage Market Survey® (PMMS®), showing the 30-year fixed-rate mortgage (FRM) averaged 6.92 percent.

“Rates resumed their record-setting climb this week, with the 30-year fixed-rate mortgage reaching its highest level since April of 2002,” said Sam Khater, Freddie Mac’s Chief Economist. “We continue to see a tale of two economies in the data: strong job and wage growth are keeping consumers’ balance sheets positive, while lingering inflation, recession fears and housing affordability are driving housing demand down precipitously. The next several months will undoubtedly be important for the economy and the housing market.”

News Facts

  • 30-year fixed-rate mortgage averaged 6.92 percent with an average 0.8 point as of October 13, 2022, up from last week when it averaged 6.66 percent. A year ago at this time, the 30-year FRM averaged 3.05 percent.
  • 15-year fixed-rate mortgage averaged 6.09 percent with an average 1.1 point, up from last week when it averaged 5.90 percent. A year ago at this time, the 15-year FRM averaged 2.30 percent.
  • 5-year Treasury-indexed hybrid adjustable-rate mortgage (ARM) averaged 5.81 percent with an average 0.2 point, up from last week when it averaged 5.36 percent. A year ago at this time, the 5-year ARM averaged 2.55 percent.

The PMMS® is focused on conventional, conforming, fully amortizing home purchase loans for borrowers who put 20 percent down and have excellent credit. Average commitment rates should be reported along with average fees and points to reflect the total upfront cost of obtaining the mortgage. Visit the following link for the Definitions. Borrowers may still pay closing costs which are not included in the survey.

NOTE: Freddie Mac is making a number of enhancements to the PMMS to improve the collection, quality and diversity of data used. Instead of surveying lenders, the weekly results will be based on applications received from thousands of lenders across the country that are submitted to Freddie Mac when a borrower applies for a mortgage. Additionally, we will no longer publish fees/points or adjustable rates. The newly recast PMMS will be put in place in November 2022, and the weekly distribution will be Thursdays at 12 p.m. noon ET.

Freddie Mac makes home possible for millions of families and individuals by providing mortgage capital to lenders. Since our creation by Congress in 1970, we’ve made housing more accessible and affordable for homebuyers and renters in communities nationwide. We are building a better housing finance system for homebuyers, renters, lenders, investors and taxpayers. Learn more at FreddieMac.com, Twitter @FreddieMac and Freddie Mac’s blog FreddieMac.com/blog.

Mortgage purchase applications down 39% | Bedford Hills Real Estate

Per the Mortgage Bankers Association’s (MBA) survey through the week ending October 7th, total mortgage activity declined 2.0% from the previous week and the average 30-year fixed-rate mortgage (FRM) rate rose six basis points to 6.81%. The FRM has risen 80 basis points over the past month, reaching its highest level since 2006.

The Market Composite Index, a measure of mortgage loan application volume, decreased by 2.0% on a seasonally adjusted (SA) basis from one week earlier. Purchasing and refinancing activity both decreased by 2.0% from one week earlier

Purchase application volume is down 39.1% from one year ago, the largest year-over-year decline in purchasing since September 2010. The refinancing activity index is down 86.0% from the same week one year ago, the largest year-over-year decrease since October 1999.

The refinance share of mortgage activity remained unchanged from one week prior at 29.0% while the adjustable-rate mortgage (ARM) share of activity slightly decreased from 11.8% to 11.7%. Due to higher FRM rates, the ARM share of mortgage activity has more than tripled from 3.4% one year ago.

read more…

eyeonhousing.org

Building Materials Prices Decline in September | Bedford NY Real Estate

The prices of building materials decreased 0.3% in September (not seasonally adjusted) according to the latest Producer Price Index (PPI) report. The PPI for goods inputs to residential construction, including energy, declined for the third consecutive month in September (-0.1%). Prices have fallen 2.3% since June, the largest three-month drop since April 2020.

The price index of services inputs to residential construction decreased 0.8% in September, driven by lower building materials wholesalers’ margins and freight transportation prices.  Services prices have declined each of the last six months by a combined 12.4% and are at the lowest level since 2021. Despite the six-month decline, the PPI for services inputs to residential construction is 3.3% higher than it was in September 2021.

Softwood Lumber

The PPI for softwood lumber (seasonally adjusted) declined 2.9% in September following a 5.2% drop in August. Softwood lumber prices are 14.5% higher than they were a year ago but have fallen 39.6% since March. The index remains 41.9% above pre-pandemic levels.

Steel Mill Products

Steel mill products prices decreased 6.7% in September and have fallen 16.1% over the past four months.  The index is at its lowest level since June 2021, but prices of steel mill products are nearly double their pre-pandemic levels, on average.

Ready-Mix Concrete

The PPI for ready-mix concrete (RMC) increased 1.4% in September—its sixth consecutive increase—and has risen 11.6% over the past year. The index has climbed 8.9%, year-to-date, the largest September YTD increase in the series’ 34-year history.

The monthly increase in the national data was primarily driven by a 2.6% price increase in the South region and partially offset by a 0.7% decline in the Northeast. Prices were flat in the Midwest and edged 0.3% higher in the West.

Gypsum Building Materials

The PPI for gypsum building materials edged 0.2% lower in September—just the second monthly decrease in two years. Prices have increased 20.2% over the past year and are up 46.0% since January 2020.

Transportation of Freight

The price of truck transportation of freight decreased 0.4% in September following a 1.9% decline in August. Prices have fallen 3.1% over the past four months, driven lower by a 4.5% decline in the price of long-distance motor carrying.  Over the same period, the PPI for local motor carrying increased 1.4%.

Year-to-date, the prices of ocean, rail, and truck freight transportation have increased 22.4%, 7.7%, and 8.0%, respectively.

read more…

eyeonhousing.org

Mortgage Credit Availability At Lowest Level In 9 Years | Pound Ridge Real Estate

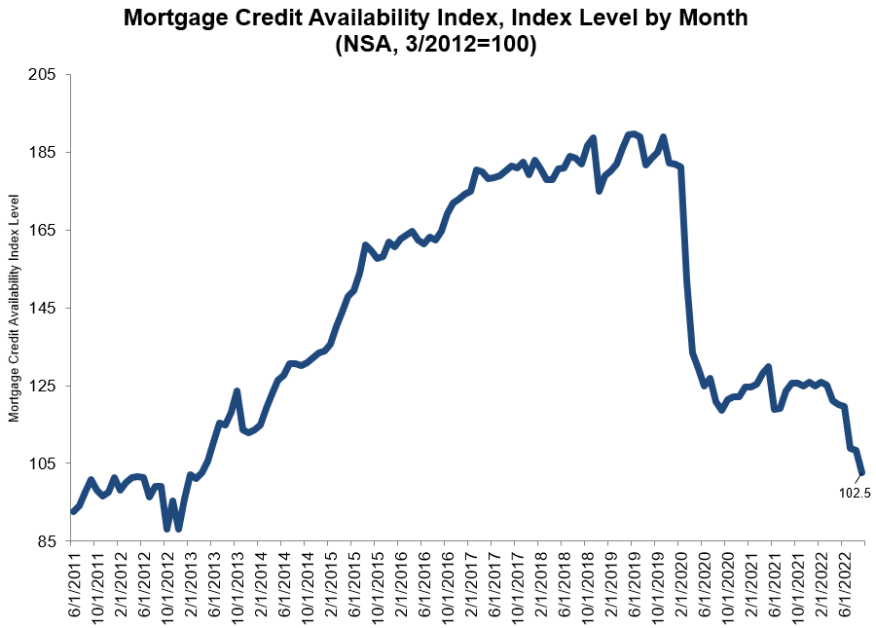
MBA MCAI Sept. 2022

Fell to the lowest level since March 2013, following seven straight months of tightening credit.

KEY TAKEAWAYS

  • A decline in the MCAI indicates that lending standards are tightening.

Mortgage credit availability decreased in September, falling by 5.4% to 102.5, its lowest level in nine years.

That’s according to the Mortgage Bankers Association’s (MBA) Mortgage Credit Availability Index (MCAI), a report that analyzes data from ICE Mortgage Technology.

A decline in the MCAI indicates that lending standards are tightening, while increases in the index indicate loosening credit. The index was benchmarked to 100 in March 2012. 

The Conventional MCAI decreased 4.9%, while the Government MCAI decreased by 5.7%. Of the component indices of the Conventional MCAI, the Jumbo MCAI decreased by 5.8%, while the Conforming MCAI fell by 3.6%.

“Credit availability fell to the lowest level since March 2013 — the seventh consecutive month of tightening,” said Joel Kan, MBA’s associate vice president of economic and industry forecasting. “With the likelihood of a weakening economy, which would lead to an increase in delinquencies, there was a smaller appetite for lower credit score and high LTV (loan-to-value) loan programs, along with a reduction in government streamline refinance programs. As mortgage rates have more than doubled over the past year, resulting in a drop in refinance activity, lenders have worked to reduce excess capacity and costs by eliminating underutilized loan programs.”

Kan added that all of the MCAI’s component indices declined last month, “with most of the indices falling to their lowest levels in over a year. In particular, the government credit availability index has declined in seven of the last eight months to its lowest level since April 2013.” 

Credit availability continued to trend downwards and hit a new low, beating July’s 9% drop to 108.8 and August’s 0.5% drop to 108.3.

read more…

nationalmortgageprofessional.com

Black Knight Mortgage Monitor reports prices up 12.1% | Bedford Corners Real Estate

Home prices are now posting the biggest monthly declines since January 2009, according to the latest Mortgage Monitor report from Black Knight.

Median home prices in August fell 0.98%, only slightly better than July’s 1.05% monthly decline. The average home price is down 2% ($8,800) from its June peak nationally as we enter the historically slower fall-winter homebuying season.

The housing market has not seen such a significant two-month drop in prices since shortly after the collapse of Lehman Brothers in winter of 2008, Black Knight said on Monday.

Skyrocketing mortgage rates – now in the 7% range for some buyers – and limited inventory have driven mortgage affordability to its lowest levels since the early 1980s, a reversal from the frenetic boom in buying during 2020 and 2021.

With mortgage rates at 6.7% as of Sept. 29, it takes 38.2% of the median household income to make the monthly mortgage payment on the median-priced home bought with a 30-year mortgage and 20% down, Black Knight said. That monthly payment is up $930 from August 2021, a 73% increase.

“Historically low inventory – along with record low interest rates – was one of the key drivers behind U.S. home prices seeing essentially a decade’s worth of appreciation in just two-and-a-half years,” added Ben Graboske, Black Knight’s president of Black Knight data & analytics.


Creating a path to success in today’s purchase market

Meeting the needs of a new generation of homebuyers while managing the ebbs and flows of a volatile housing market is a major endeavor for any mortgage lender. So, what should lenders be doing to thrive in the face of a post-pandemic housing market rife with new hurdles?

Presented by: Calyx

Home prices are beginning to fall from post-pandemic peaks but remain up 12.1% from Aug. 2021 due to the record growth seen in late 2021 and early 2022, Black Knight said in its report. Annual home price growth rates are poised to continue falling in coming months, though it’s unclear where the bottom is.

Much of that depends on how much inventory returns to the market. After seeing an uptick in listings from May through July, inventory levels stalled in August, growing at just 1/10th the rate of recent months. The market grew from just 1.7 months of for-sale inventory to 3.1 months before dropping down to three months in August.

“Right now, prospective sellers are not only coming to grips with falling demand and declining prices due to sharply higher interest rates, but they also have a growing disincentive to give up their own historically low-rate mortgages in this environment,” said Graboske. “Some may be waiting out the market to see if demand – and prices – return in the spring.” 

While 20% of markets have seen only marginal declines (less than 1%) so far, a third have experienced drops of 3% or more – including nine where prices have fallen more than 5%, Black Knight researchers found. The sharpest correction was in San Jose (-13%, or, about $203,000), followed by San Francisco (-10.8%, or roughly $137,000) and Seattle (-9.9%, or about $83,000), but other formerly scorching-hot markets have also cooled majorly since June. Las Vegas, Austin, Minneapolis, Washington, D.C., Raleigh and Nashville have all shed 3% of home value in recent months.

read more…

housingwire.com/articles/

CoreLogic home price index up 15.8% | Chappaqua Real Estate

Through July 2022 with Forecasts through July 2023

Introduction

The CoreLogic Home Price Insights report features an interactive view of our Home Price Index product with analysis through July 2022 with forecasts through July 2023.

CoreLogic HPI™ is designed to provide an early indication of home price trends. The indexes are fully revised with each release and employ techniques to signal turning points sooner. CoreLogic HPI Forecasts™ (with a 30-year forecast horizon), project CoreLogic HPI levels for two tiers—Single-Family Combined (both Attached and Detached) and Single-Family Combined excluding distressed sales.

The report is published monthly with coverage at the national, state and Core Based Statistical Area (CBSA)/Metro level and includes home price indices (including distressed sales); home price forecast and market condition indicators. The data incorporates more than 40 years of repeat-sales transactions for analyzing home price trends.

HPI National Change

July 2022 National Home Prices

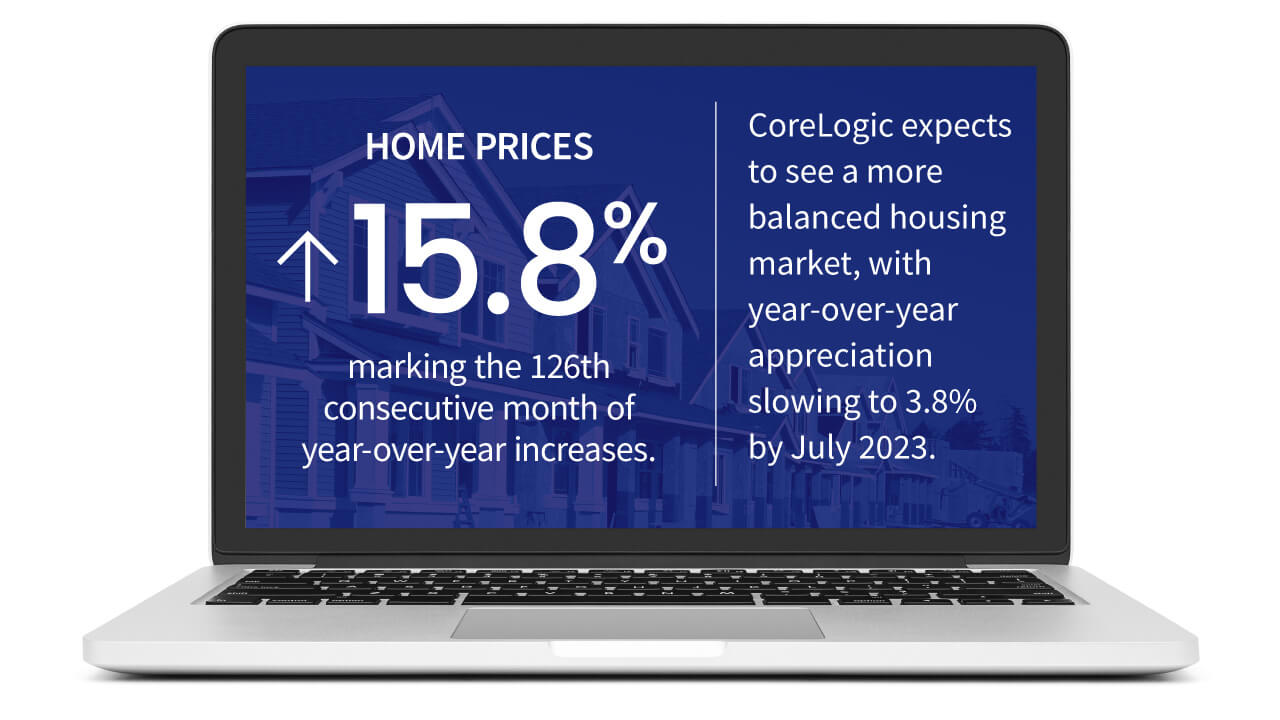
Home prices nationwide, including distressed sales, increased year over year by 15.8% in July 2022 compared with July 2021. On a month-over-month basis, home prices declined by 0.3% in July 2022 compared with June 2022 (revisions with public records data are standard, and to ensure accuracy, CoreLogic incorporates the newly released public data to provide updated results).

Forecast Prices Nationally

The CoreLogic HPI Forecast indicates that home prices will increase on a month-over-month basis by 0.3% from July 2022 to August 2022 and on a year-over-year basis by 3.8% from July 2022 to July 2023.

Figure 1  HPI National Change

HPI & Case-Shiller Trends

This graph shows a comparison of the national year-over-year percent change for the CoreLogic HPI and CoreLogic Case-Shiller Index from 2000 to present month with forecasts one year into the future. We note that both the CoreLogic HPI Single Family Combined tier and the CoreLogic Case-Shiller Index are posting positive, but moderating year-over-year percent changes, and forecasting gains for the next year.

Figure 2

Housing Market Showing Signs of Better Balance

Annual home price growth slowed for the third consecutive month in July but remained elevated at 15.8%. As 30-year, fixed-rate mortgages neared 6% this summer, some prospective homebuyers pulled back, helping ease overheated and unsustainable price growth. Notably, home prices declined by 0.3% from June to July, a trend not seen between 2010 and 2019, when price increases averaged 0.5% between those two months, according to CoreLogic’s historic data. Looking ahead, CoreLogic expects to see a more balanced housing market, with year-over-year appreciation slowing to 3.8% by July 2023.

Figure

“Following June’s surge in mortgage rates and the resulting dampening effect on housing demand, price growth is taking a decisive turn. And even though annual price growth remains in double digits, the month-over-month decline suggests further deceleration on the horizon. The higher cost of homeownership has clearly eroded affordability, as inflation-adjusted monthly mortgage expenses are now even higher than they were at their former peak in 2006.”

– Selma Hepp 
Interim Lead, Deputy Chief Economist for CoreLogic

HPI National and State Maps – July 2022

The CoreLogic HPI provides measures for multiple market segments, referred to as tiers, based on property type, price, time between sales, loan type (conforming vs. non-conforming) and distressed sales. Broad national coverage is available from the national level down to ZIP Code, including non-disclosure states.

Nationally, home prices increased 15.8% year over year in July. No states posted an annual decline in home prices. The states with the highest increases year over year were Florida (29.6%), South Dakota (23.7%) and Tennessee (23.2%).

Figure 4: HPI Change States Top

HPI Top 10 Metros Change

The CoreLogic HPI provides measures for multiple market segments, referred to as tiers, based on property type, price, time between sales, loan type (conforming vs. non-conforming) and distressed sales. Broad national coverage is available from the national level down to ZIP Code, including non-disclosure states.

These large cities continued to experience price increases in July, with Miami on top at 27.1% year over year.

Figure 5 HPI Top US Metros

Markets to Watch: Top Markets at Risk of Home Price Decline

The CoreLogic Market Risk Indicator (MRI), a monthly update of the overall health of housing markets across the country, predicts that Bremerton-Silverdale, WA is at a very high risk (70%-plus probability) of a decline in home prices over the next 12 months. Crestview-Fort Walton Beach-Destin, FL; Bellingham, WA; Reno, NV and Boise City, ID are also at very high risk for price declines.  

Figure 6: HPI Markets to Watch

Summary

CoreLogic HPI features deep, broad coverage, including non-disclosure state data. The index is built from industry-leading real-estate public record, servicing, and securities databases—including more than 40 years of repeat-sales transaction data—and all undergo strict pre-boarding assessment and normalization processes.

CoreLogic HPI and HPI Forecasts both provide multi-tier market evaluations based on price, time between sales, property type, loan type (conforming vs. non-conforming) and distressed sales, helping clients hone in on price movements in specific market segments.

Updated monthly, the index is the fastest home-price valuation information in the industry—complete home-price index datasets five weeks after month’s end. The Index is completely refreshed each month—all pricing history from 1976 to the current month—to provide the most up-to-date, accurate indication of home-price movements available.

Methodology

The CoreLogic HPI is built on industry-leading public record, servicing and securities real-estate databases and incorporates more than 40 years of repeat-sales transactions for analyzing home price trends. Generally released on the first Tuesday of each month with an average five-week lag, the CoreLogic HPI is designed to provide an early indication of home price trends by market segment and for the “Single-Family Combined” tier, representing the most comprehensive set of properties, including all sales for single-family attached and single-family detached properties. The indices are fully revised with each release and employ techniques to signal turning points sooner. The CoreLogic HPI provides measures for multiple market segments, referred to as tiers, based on property type, price, time between sales, loan type (conforming vs. non-conforming) and distressed sales. Broad national coverage is available from the national level down to ZIP Code, including non-disclosure states.

CoreLogic HPI Forecasts are based on a two-stage, error-correction econometric model that combines the equilibrium home price—as a function of real disposable income per capita—with short-run fluctuations caused by market momentum, mean-reversion, and exogenous economic shocks like changes in the unemployment rate. With a 30-year forecast horizon, CoreLogic HPI Forecasts project CoreLogic HPI levels for two tiers — “Single-Family Combined” (both attached and detached) and “Single-Family Combined Excluding Distressed Sales.” As a companion to the CoreLogic HPI Forecasts, Stress-Testing Scenarios align with Comprehensive Capital Analysis and Review (CCAR) national scenarios to project five years of home prices under baseline, adverse and severely adverse scenarios at state, metropolitan areas and ZIP Code levels. The forecast accuracy represents a 95% statistical confidence interval with a +/- 2% margin of error for the index.

About Market Risk Indicator

Market Risk Indicators are a subscription-based analytics solution that provide monthly updates on the overall “health” of housing markets across the country. CoreLogic data scientists combine world-class analytics with detailed economic and housing data to help determine the likelihood of a housing bubble burst in 392 major metros and all 50 states. Market Risk Indicators is a multi-phase regression model that provides a probability score (from 1 to 100) on the likelihood of two scenarios per metro: a >10% price reduction and a ≤ 10% price reduction. The higher the score, the higher the risk of a price reduction. 

Source: CoreLogic
The data provided are for use only by the primary recipient or the primary recipient’s publication or broadcast. This data may not be resold, republished or licensed to any other source, including publications and sources owned by the primary recipient’s parent company without prior written permission from CoreLogic. Any CoreLogic data used for publication or broadcast, in whole or in part, must be sourced as coming from CoreLogic, a data and analytics company. For use with broadcast or web content, the citation must directly accompany first reference of the data. If the data are illustrated with maps, charts, graphs or other visual elements, the CoreLogic logo must be included on screen or website.

For questions, analysis or interpretation of the data, contact Robin Wachner at  newsmedia@corelogic.com. Data provided may not be modified without the prior written permission of CoreLogic. Do not use the data in any unlawful manner. The data are compiled from public records, contributory databases and proprietary analytics, and its accuracy is dependent upon these sources.

About CoreLogic

CoreLogic is a leading global property information, analytics and data-enabled solutions provider. The company’s combined data from public, contributory and proprietary sources includes over 4.5 billion records spanning more than 50 years, providing detailed coverage of property, mortgages and other encumbrances, consumer credit, tenancy, location, hazard risk and related performance information. The markets CoreLogic serves include real estate and mortgage finance, insurance, capital markets, and the public sector. CoreLogic delivers value to clients through unique data, analytics, workflow technology, advisory and managed services. Clients rely on CoreLogic to help identify and manage growth opportunities, improve performance and mitigate risk. Headquartered in Irvine, Calif., CoreLogic operates in North America, Western Europe and Asia Pacific. For more information, please visit www.corelogic.com.

CORELOGIC, the CoreLogic logo, CoreLogic HPI, CoreLogic HPI Forecast and HPI are trademarks of CoreLogic, Inc. and/or its subsidiaries.

For More Information
Please email newsmedia@corelogic.com.