Boosted by historically low mortgage rates, existing home sales, as reported by the National Association of Realtors (NAR), rose for a fourth consecutive month in September and reached its highest level in more than 14 ½ years.
Total existing home sales, including single-family homes, townhomes, condominiums and co-ops, increased 9.4% to a seasonally adjusted annual rate of 6.54 million in September, the highest level since May 2006. On a year-over-year basis, sales were 20.9% higher than a year ago.
The first-time buyer share decreased to 31% in September from 33% both last month and a year ago. However, price gains threaten this share in the future. The September inventory level fell to 1.47 million units from 1.49 million units in August and is down from 1.82 million units a year ago.
At the current sales rate, the September unsold inventory represents a 2.7-month supply, down from 3.0-month in August and 4.0-month a year ago. This low level supply of resale homes is good news for home construction.
Homes stayed on the market for an average of just 21 days in September, an all-time low, down from 22 days last month and 32 days a year ago. In September, 71% of homes sold were on the market for less than a month.
The September all-cash sales share was 18% of transactions, unchanged from last month but up from 17% a year ago.
Tight supply continues to push up home prices. The September median sales price of all existing homes was $311,800, up 14.8% from a year ago, representing the 103rd consecutive month of year-over-year increases. The median existing condominium/co-op price of $272,700 in September was up 9.9% from a year ago.
Regionally, all four regions saw month-over-month gains for existing home sales in September, ranging from 7.1% in the Midwest to 16.2% in the Northeast. On a year-over-year basis, sales grew in all four regions as well, with the Northeast seeing the greatest gain (22.9%).
Though sales have flourished and demand remains strong due to low mortgage rates, the imbalance between housing supply and demand could hamper future sales. Low inventory will not only continue to drive up home prices but also hurt affordability and homeownership attainment. Though housing starts remain at solid pace, more listings and home construction are still needed to meet this rising demand.
Trump (Johnny Milano for The Washington Post via Getty Images
The Trump Organization is considering selling its sprawling Westchester, N.Y., estate, according to people familiar with the matter, after years of unsuccessful development attempts that ended with an agreement to preserve part of the property.
The New York attorney general’s office has said it is examining whether any benefits Mr. Trump received from that agreement were improper as part of a broader investigation of alleged fraud by the president and his businesses.
Trump representatives have had conversations with local brokers about the possibility of a sale, the people said. The 213-acre property, known as Seven Springs, isn’t currently listed publicly. While President Trump has previously valued the property at more than $200 million, local agents estimated the property would trade for around $50 million or less. They said much of the previously perceived value was likely tied up in prior failed development plans, including a proposed residential subdivision.
A Trump Organization spokeswoman called Seven Springs “one of the largest, most valuable and most iconic properties in Bedford.” She added, “If the right opportunity presents itself, the Trump family would certainly entertain it.”
The Trump Organization has owned Seven Springs since 1995, when it purchased the property for $7.5 million. At the time, local agents said it was a bargain. Although it had been on the market for a year and was viewed as something of a white elephant, other major properties in Westchester County had sold for multiples of that amount.
Mr. Trump first attempted to build a golf course on the property but encountered fierce local opposition. The Trump Organization then pursued building a residential subdivision of luxury homes.
A 2011 Trump financial document values the property at $261 million, based on what it said was an assessment by Mr. Trump, his associates and outside professionals. It said the figure comes from the funds he would receive as homes were constructed and sold, plus the value of the existing mansion and other buildings.
Those homes were never built. Local real-estate agents said Mr. Trump had a particularly difficult time getting his plans approved because the property straddles several municipalities—Bedford, New Castle and North Castle.
In late 2015, Mr. Trump entered into an agreement with the nonprofit North American Land Trust not to develop 158 acres of the property. That area included 95 acres of mature forest and 52 acres of herbaceous meadows, according to the agreement. Under such agreements, known as conservation easements, a property owner can deduct the land’s value in exchange for not developing it.
If the property were sold, the new owner would be bound by the terms of the easement, according to the agreement.
As part of its fraud investigation into the president and his company, the office of New York Attorney General Letitia James has said it is examining whether the value of the easement was improperly inflated to get a larger tax dedication.
The Trump Organization has said the investigation by Ms. James, a Democrat, is all about politics. Eric Trump said on Twitter that Ms. James’s “sole focus is an anti-Trump fishing expedition that she promised during her campaign.”
A 2016 appraisal, prepared by real-estate services firm Cushman & Wakefield for tax purposes at the request of Eric Trump, valued the property at $56.5 million and the easement at $21.1 million, according to court papers.
The estate dates to around 1919, when it was built for Eugene Meyer, a former chairman of the Federal Reserve, first president of the World Bank and onetime publisher of the Washington Post. The main house, designed by architect Charles A. Platt, is constructed from sandstone quarried on the property. Artisans from Italy were tapped to ensure that the home’s 60 rooms, including 15 bedrooms and two service wings, were opulently designed, according to the Trump Organization website.
The Trump Organization estimates that the mansion spans about 50,000 square feet, making it one of the largest homes in the area. It has three pools, including an indoor pool cased in white marble, as well as a large wine cellar, an antique bowling alley and carriage houses. A second home on the property, built in Tudor style in 1919, was constructed by H.J. Heinz of the Heinz Ketchup empire, who was a friend of Mr. Meyer’s.
Mr. Trump famously allowed representatives of the late Moammar Gadhafi, the then-Libyan leader who was in New York to address the United Nations General Assembly, to pitch a Bedouin-style tent on the property in 2009. After local opposition, the leader didn’t stay there.
The Trump Organization website says Seven Springs is now used as a family retreat.
A nearby property owned by horse-racing enthusiasts Barry K. Schwartz, the co-founder of Calvin Klein Inc., and his wife, Sheryl Schwartz, spans about 740 acres, nearly three times the size of the Trump property, and is on the market for $100 million. A mansion less than 20 miles away in Pocantico Hills, N.Y., that was owned by the estate of David Rockefeller, the venerable chief executive of Chase Manhattan Bank, sold for $33 million in 2018. It sits on roughly 75 acres.
Freddie Mac (OTCQB: FMCC) today released the results of its Primary Mortgage Market Survey® (PMMS®), showing that the 30-year fixed-rate mortgage (FRM) averaged 2.80 percent, the lowest rate in our survey’s history which dates back to 1971.
“Mortgage rates remain very low, providing homeowners who have not already taken advantage of this environment ample opportunity to do so,” said Sam Khater, Freddie Mac’s Chief Economist. “Mortgage rates today are on average more than a full percentage point lower than rates over the last five years. This means that most low- and moderate-income borrowers who purchased during the last few years stand to benefit by exploring refinancing to lower their monthly payment.”
News Facts
30-year fixed-rate mortgage averaged 2.80 percent with an average 0.6 point for the week ending October 22, 2020, down from last week when it averaged 2.81 percent. A year ago at this time, the 30-year FRM averaged 3.75 percent.
15-year fixed-rate mortgage averaged 2.33 percent with an average 0.6 point, down from last week when it averaged 2.35 percent. A year ago at this time, the 15-year FRM averaged 3.18 percent.
5-year Treasury-indexed hybrid adjustable-rate mortgage (ARM) averaged 2.87 percent with an average 0.3 point, down from last week when it averaged 2.90 percent. A year ago at this time, the 5-year ARM averaged 3.40 percent.
The PMMS is focused on conventional, conforming, fully-amortizing home purchase loans for borrowers who put 20 percent down and have excellent credit. Average commitment rates should be reported along with average fees and points to reflect the total upfront cost of obtaining the mortgage. Visit the following link for the Definitions. Borrowers may still pay closing costs which are not included in the survey.
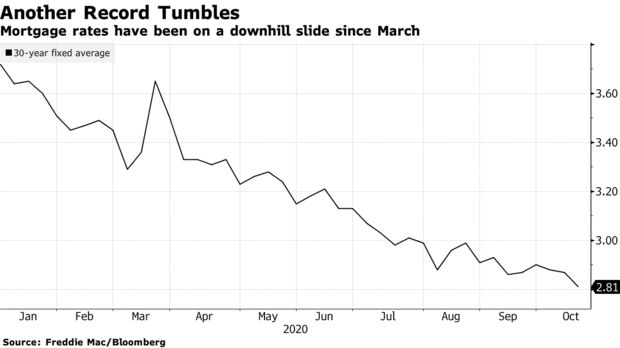
Mortgage rates in the U.S. have hit another record low.
The average for a 30-year, fixed loan dropped to 2.81%, down from 2.87% last week and the lowest in almost 50 years of data-keeping, Freddie Mac said in a statement Thursday. It was the 10th record low this year. The previous one — 2.86% — held for about a month.
The slide in borrowing costs that began in March, as fears of the coronavirus drove investors to the safety of Treasuries, shows no signs of stopping. The Federal Reserve has signaled it will hold its benchmark rate near zero through at least 2023. That should keep a lid on mortgage rates, which have been below 3% since July.
Cheap loans have been fueling a housing rally that has bolstered the pandemic economy, even amid persistent job losses. Purchases have soared and millions of current homeowners have been able to save money by refinancing. Home ownership has become increasingly un affordable. For those who can’t afford big down payments, mortgage insurance has become a fact of life. For all its expense, mortgage insurance doesn’t deliver the level of protection it should. The government should do what’s needed to reduce the unnecessarily high cost.
But surging demand for the scarce supply of properties on the market is pushing up prices, putting home ownership out of reach for many Americans. And lenders have tightened credit standards, presenting another potential obstacle for would-be buyers.
“It’s important to remember that not all people are able to take advantage of low rates, given the effects of the pandemic,” Sam Khater, Freddie Mac’s chief economist, said in the statement.
Rent prices in top cities are down “substantially” compared to last year — especially in San Francisco, according to Realtor.com.
City landlords are slashing rent prices to attract tenants as they lose renters to cheaper, quieter suburbs during the coronavirus pandemic. In the most dramatic cities studio rent prices fell 31% compared to last year, according to Realtor.com’s September rent prices report.
“This is likely a reflection of people with flexibility, like renters, choosing to relocate elsewhere or even possibly move in with friends and family to save money in a period of economic uncertainty, with flexibility that changes like remote work have allowed them to move elsewhere to places that are more affordable,” said Danielle Hale, chief economist at Realtor.com.
San Francisco rent prices were the hardest-hit by the pandemic as big tech companies in Silicon Valley required or allowed workers to work remotely — first during lockdowns, and then long-term, in many cases.
The median studio apartment in San Francisco is going for 31% less than it did last year, now only $2,285. One bedroom apartments cost 24.2% less than last year at only $2,873 a month (the first time they’ve ever hit under $3,000, according to Zumper, a San Francisco-based listing company). In nearby San Mateo, Santa Clara and Alameda rents dropped 9%-19%. Rents were less volatile for larger apartments, the Realtor.com study found.
But almost two hours outside San Francisco in Sacramento, rent prices are actually rising 10%-16%. Sacramento was the top out-of-metro location where Bay area renters searched for apartments year-to-date, according to Zumper’s 2020 migration report. Sacramento was also tied as the sixth most common migration destination in the country, according to Opendoor, a San Francisco-based iBuyer that operates in Sacramento and 20 other markets.
“People from the Bay area may be moving to Sacramento if they don’t have to commute into the office every day,” said Hale.
Top 10 markets with largest one-bedroom rent prices decreases. Data by Realtor.com. Graphic by Chelsea Lombardo/Yahoo Finance.
Pushing for occupancy before seasonal slowdown
Rent prices dropped significantly in major cities all across the country, plummeting up to 15% for studio apartments in places like New York City, Pittsburgh, Boston and Honolulu, and 12% in Seattle, according to Realtor.com. Rent cuts were less steep for one-bedrooms, between 7% and 12% in most cities.
“Apartment owners are pushing to get occupancy as high as possible before leasing activity suffers the seasonal slowdown that occurs during the cold weather months,” said a statement by Greg Willett, chief economist of RealPage, a Texas-based property management software company. “In some cases, they are cutting rents in an attempt to capture bigger shares of total demand.”
Meanwhile, rent rose in unlikely places such as Tulsa, Okla., which had a staggering 36% hike in studio rent increases. Rent in suburbs that many Americans have never heard of, like Hillsboro, Fla., Montgomery, Pa. and Essex, N.J., rose about 19%-29%.
“Even prior to the pandemic, there was a movement from larger metros to smaller metros…,” said Odeta Kushi, deputy chief economist for First American Financial Corporation, a California-based title insurance, settlement services and risk solutions company. “This trend has been accelerated by the pandemic as younger households look for more space and are increasingly able to work from home.”
After a sharp decline in the spring, home building has staged a dramatic rebound. In fact, supported by low mortgage rates, an evolving geography of housing preferences, and favorable demographic tailwinds, housing demand has improved so quickly that the current difference between the pace of newly-built single-family home sales and for-sale single-family construction custom framing starts has reached a historic level. The fact that sales are outpacing construction starts to this degree indicates additional home building lies ahead.
The following graph shows the benchmark Census measures of home construction, the seasonally adjusted annual rates of single-family starts and single-family home sales. Starts account for the beginning of construction of homes, whether that construction is for a home already under a sales contract, being built for-sale, being built for-rent, or undertaken for a construction contract (a custom build on an owner’s lot). New home sales are signed sales contracts for new builds, whether that home has started or completed construction (new home sales is thus a counterpart to the NAR pending sales index, rather than existing home sales, which account for closed contracts).
The reason that starts outpace sales on the chart below is because, as noted above, starts represents all home builds. Thus, while the measure of new home sales represents only the more narrow for-sale class, housing starts also include custom builds and built-for-rent construction.
The consequences of the virus-induced 2020 downturn (the Great Disruption?) is seen clearly at the end of the graph, particularly the V-shaped nature of the impact on housing. While both measures have staged impressive rebounds, the sales measure has completely closed the gap between the two series.
However, the actual effect is larger. For an apples-to-apples comparison of the rates of for-sale construction and new home sales, we need to filter the starts series to remove custom builds and built-for-rent single-family construction. Using Census quarterly data of these construction types, I interpolated the quarterly data into monthly, seasonally adjusted data and then subtracted this new series from the existing Census data series. The new data series, single-family for-sale starts, allows for a precise comparison of the pace of home building in the for-sale sector relative to sales, as graphed below.
The new series is much closer to the sales data, with just occasional periods of notable difference amid the statistical noise. The adjusted data makes clear how great the current difference is between sales (red) and starts (blue). This gap is unprecedented in the 20 years of data presented here, and there is no comparable period in the data going back to 1963. Plotting the difference between the monthly rates of for-sale starts and sales yields the following series, which peaks in the most recent data.
The degree to which current new home sales are outpacing starts is clear in the above graph. These data are consistent with Census estimates and NAHB surveys that indicate builders are selling homes that have not begun construction in greater numbers. Indeed, the count of such home sales is up 69% compared to a year ago, an incredible jump. To place the current data into context, I smoothed the data using 6-month moving averages. While this dilutes somewhat the scale of the current gap, it shows three relevant periods over the last two decades where sales and for-sale starts disconnected.
As seen above, the first period occurred during the housing boom when for-sale starts exceeded sales, leading to an inventory overhang that was part of the housing crisis preceding the Great Recession. The second separation occurred as single-family starts plummeted during the Great Recession and sales, helped by the three stages of the federal home buyer tax credit, reduced excess inventory (new home months’ supply peaked at 11.1 during the spring of 2008).
These two prior periods happened in an overbuilt environment. The script is flipped today. Months’ supply for new homes is down to a lean 3.3, and existing home months’ supply (per NAR data) is at a very tight 2.8. Thus, the third period of separation between for-sale starts and new home sales occurring now is a signal of the degree to which home building will need to play catch-up with current demand.
As with other economic impacts related to the virus, prior trends have been accelerated. With home building, the last decade (the Long Recovery) was characterized by underbuilding due to supply-side limitations such as labor availability and law/regulatory cost impacts. The lagging pace of construction, relative to current sales, is an intense, compressed version of these general economic trends, with builders citing lumber and material issues as delaying some, current construction projects.
Because builders do not want to contract home sales that they will not be able to deliver effectively, the current, historic gap between elevated sales volume and improving if relatively lower construction rates means that the pace of growth for new home sales will need to slow and/or the rate of home building will need to increase to balance the market. Strong levels of the NAHB/Wells Fargo HMI measure of home builder confidence are consistent with this expectation, for starts at least.
In the meantime, the current gap between for-sale starts and sales is unprecedented. Moreover, this gap is not the only historic, current data reading of the housing industry. The NAHB/Wells Fargo HMI reached a data series high in September.
And the gap between median newly-built and existing home prices, which peaked near $95,000 three years ago, has closed and inverted. According to NAR data, the median price for a resale single-family home was $315,000, higher than the Census reported median of $312,800 for newly-built homes. That inversion has only occurred one other time over the last two decades (June 2005).
In sum, low levels of existing inventory, rising resale prices relative to new construction, strong builder confidence, and sales exceeding for-sale starts point to solid levels of home construction in the months ahead.
Home building sustains jobs (approximately 2.9 per home built and 0.75 per $100,000 in remodeling), which means more residential construction employment gains in the near-term. In fact, over the next two to three months residential construction will likely post a year-over-year gain for employment, a notable sign of strength for housing in the recovering economy.
Freddie Mac (OTCQB: FMCC) today released the results of its Primary Mortgage Market Survey® (PMMS®), showing that the 30-year fixed-rate mortgage (FRM) averaged 2.81 percent, the lowest rate in our survey’s history which dates back to 1971.
“Low mortgage rates have become a regular occurrence in the current environment,” said Sam Khater, Freddie Mac’s Chief Economist. “As we hit yet another record low, the tenth record this year, many people are benefitting as refinance activity remains strong. However, it’s important to remember that not all people are able to take advantage of low rates given the effects of the pandemic.”
News Facts
30-year fixed-rate mortgage averaged 2.81 percent with an average 0.6 point for the week ending October 15, 2020, down from last week when it averaged 2.87 percent. A year ago at this time, the 30-year FRM averaged 3.69 percent.
15-year fixed-rate mortgage averaged 2.35 percent with an average 0.5 point, down from last week when it averaged 2.37 percent. A year ago at this time, the 15-year FRM averaged 3.15 percent.
5-year Treasury-indexed hybrid adjustable-rate mortgage (ARM) averaged 2.90 percent with an average 0.2 point, slightly down from last week when it averaged 2.89 percent. A year ago at this time, the 5-year ARM averaged 3.35 percent.
The PMMS® is focused on conventional, conforming, fully-amortizing home purchase loans for borrowers who put 20 percent down and have excellent credit. Average commitment rates should be reported along with average fees and points to reflect the total upfront cost of obtaining the mortgage. Visit the following link for the Definitions. Borrowers may still pay closing costs which are not included in the survey.
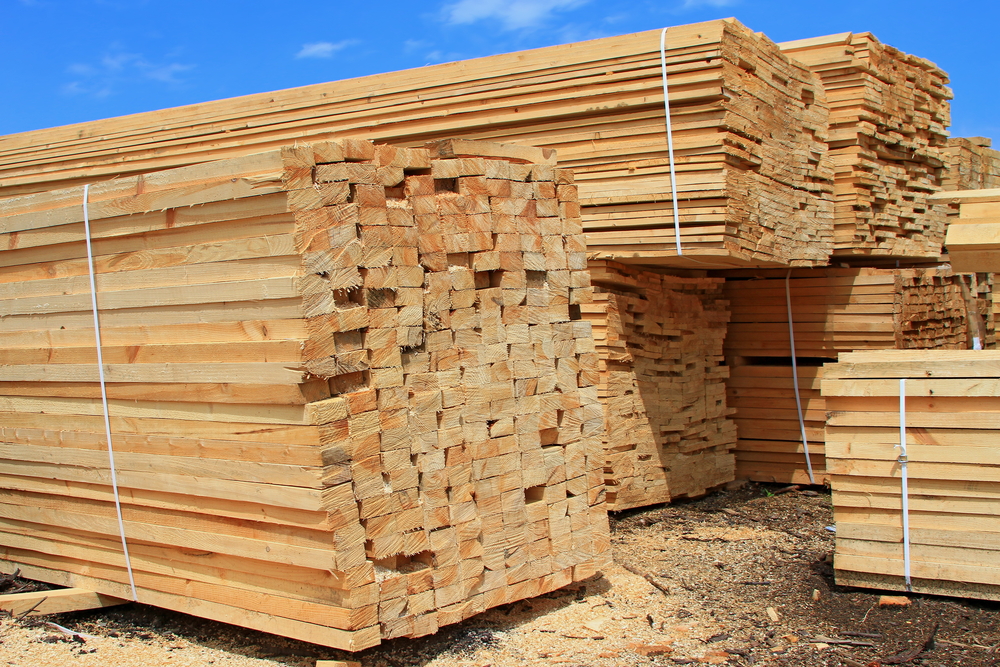
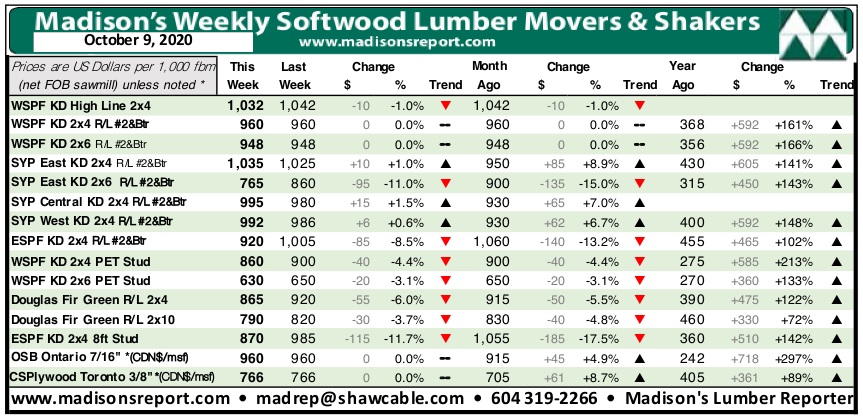
The Canadian Thanksgiving long weekend brought a not-surprising further drop in prices of most benchmark construction framing dimension softwood lumber commodities, as the days got increasingly shorter and the weather turned ever more winter-like. Demand across North America was almost entirely for small fill-in orders, while sawmills were preoccupied with locating shipments long-ago sent to customers but still not arrived, according to Madison’s Lumber Reporter.
The big question on the mind of industry players is, “Where is the price bottom and when will that arrive?” No one yet knows the answer for this, except to say it will be much higher and much later than in usual years. The latest lumber production and sawmill capacity utilization rates data release from the Western Wood Products Association — for July — shows a marked downturn in Canada. In the US, softwood lumber production continued to recover. The all-important wood manufacturing volumes in Canada took a significant tumble downward in July 2020, after recovering nicely in May and June from terrible lows of April. This decrease in lumber available for sale after the supply constraints earlier in the year well explains why prices remained so high even until now.
Prices continued to crash down in the Eastern S-P-F market last week. A large contingent of buyers participated, but the focus was on Less-Than-Truckload orders from the distribution network at wildly varying – but resoundingly lower – numbers. Overall sales volumes were strong but individual orders remained small as customers refused to take long positions in a falling market. Prompt wood became more common with each passing day as sawmills began to run into order files on a number of items, while production of bread and butter items were booked at around two weeks.
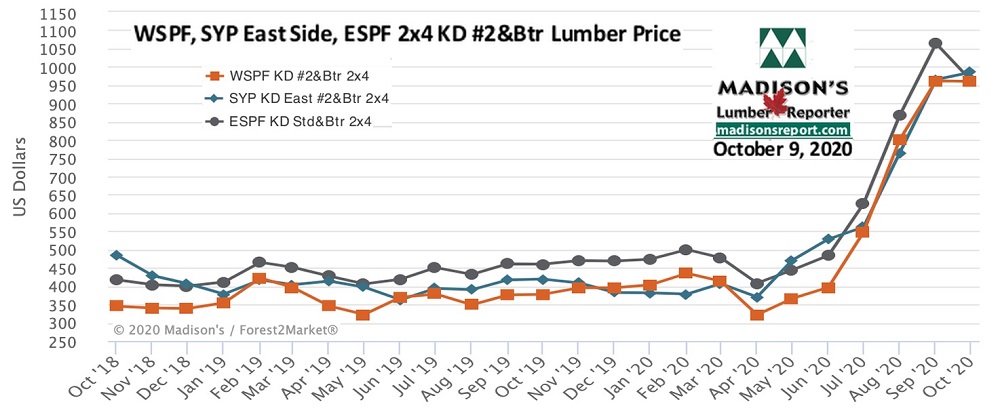
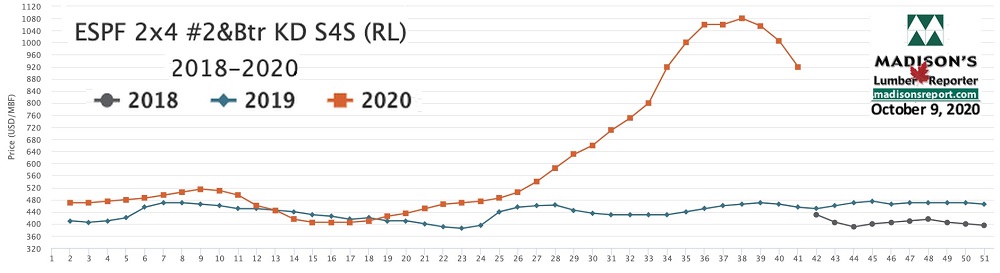
For the week ending October 9, 2020 the price of Eastern softwood lumber commodity item Eastern S-P-F KD 2×4 #2&Btr dropped once more, to land at US$920 mfbm, said Madison’s Lumber Reporter. This price is now -$85, or -8%, less than it was one month ago. Compared to one year ago, this price is up a remarkable +$465, or +102%.
Compared to one-year-ago, last week’s Eastern S-P-F KD 2×4 #2&Btr price was +$343, or +59%, higher than the 1-year rolling average price of US$577 mfbm and was up +$416, or +83%, compared to the 2-year rolling average price of US$504 mfbm.
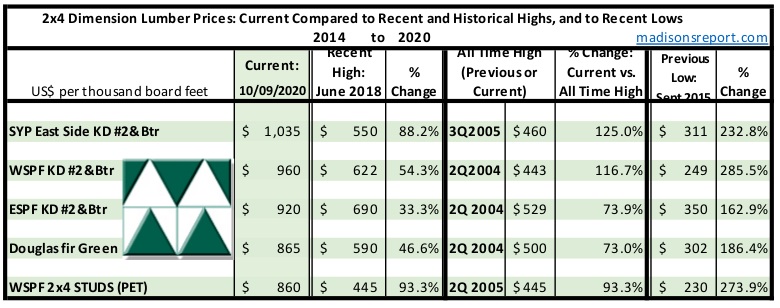
The below table is a comparison of recent highs, in June 2018, and current October 2020 benchmark dimension Softwood Lumber 2×4 prices compared to historical highs of 2004/05 and compared to recent lows of September 2015:
Many renters are struggling financially due to the coronavirus pandemic. And though a new eviction moratorium prevents you from being removed from your home, it doesn’t cover rent payments or help lighten the load financially.
If you’re having a hard time paying your rent during the COVID-19 pandemic, here’s what you need to know.
Know Your Rights as a Renter
The Centers for Disease Control (CDC) and the U.S. Department of Health and Human Services issued a federal eviction moratorium in early September 2020. Under the new rule, qualified renters can’t be evicted through Dec. 31, 2020.
To be eligible, you have to self-certify—under penalty of perjury—that you:
Are unable to pay rent due to substantial income loss, loss of hours, a layoff, or high medical bills
Have made all efforts to obtain government rent assistance
Expect to earn $99,000 or less for the year ($198,000 is you file your tax returns jointly), were not required to report any income in 2019 to the IRS, or received a stimulus check per the CARES Act
Are attempting to make at least partial payments on your rent when possible
Would likely become homeless if evicted or would need to live in very close quarters with someone
This all must be certified on the official declaration form from the CDC. You must then submit it to your landlord in order to qualify.1
Unlike the moratorium enacted by the CARES Act earlier this year, this one extends to all renters—not just those on federally financed or subsidized properties.
Understand Your Local Rights, Too
Many states and municipalities have also put their own eviction moratoriums in place. In some areas, these moratoriums have already expired, and evictions have resumed for non-paying renters.https://da3ebb9f344d2a4fa693b236fea189a0.safeframe.googlesyndication.com/safeframe/1-0-37/html/container.html
You should also work to understand your rights as a tenant and read your lease thoroughly. Note any grace periods you may be due and what your landlord’s options for recourse are. Your city should also have tenant protections in place, so study up on renter’s rights in your area. Your local housing agency is a good place to start.
Talk to Your Landlord
In order to qualify for the eviction moratorium, you must certify that you’re making your best efforts to pay rent and meet the obligations of your lease agreement. If you’re currently unable to pay your rent, your first step is to talk to your landlord. They might be willing to work with you on payment options.
“Contact your landlord and discuss a deferred payment plan,” Howard Dvorkin, a certified public accountant (CPA) and chairman of Debt.com, told The Balance via email. “This is definitely worth a shot, as most landlords do not want to pay the fee to file a lawsuit, go to court, and find a new tenant.”
Consider talking to your landlord about these other options:
Deferred payments: You pay your overdue rent by a later, agreed-upon date.
Partial or flexible payments:You are permitted to make smaller, incremental payments across the month.
Security deposit payments:Your landlord uses your security deposit toward the overdue rent.
Depending on where you live, you may also be able to pay your rent by credit card. Though this can ensure you’re not delinquent on your rent, it also results in additional credit card debt and potentially more interest paid over time. Make sure you’re prepared to pay off your credit card as soon as possible to avoid further financial distress.
Find Local Assistance
If working directly with your landlord is unsuccessful, you can look to federal, state, and local resources to help cover your rent. Again, this is a recourse you must explore before qualifying for the September 2020 eviction moratorium.1
If your financial hardship is due to the coronavirus pandemic, there are some resources you can tap for help. First, there are several HUD Rental Assistance programs, which received several billion dollars as part of the CARES Act.2
There’s also Fannie Mae’s Disaster Recovery program, which offers housing counseling and can connect you with additional federal and state resources that can help. Fannie Mae’s recovery experts can also help you better communicate with your landlord.
In addition to these pandemic-specific resources, you can also look to various state-based programs, as well as United Way’s 211.org, which can connect you with various assistance resources in your area. The National Low Income Housing Coalition also has a list of state and local rental assistance programs, but make sure to check directly with your city and county as it may not be exhaustive.
If your landlord does move to evict you, Dvorkin suggested seeking legal counsel immediately.
“You don’t have to have a lawyer in court for an eviction,” he said. “But many cities offer free legal counsel and other landlord and tenant resources to help you understand rights and how to proceed.”
If free legal help isn’t available in your area, check with the National Legal Aid & Defender Association to learn more about your options for free legal representation.
The Bottom Line
If you’re struggling to pay your rent due to the coronavirus pandemic or any financial hardship, it does not necessarily mean you’ll be evicted. Talk to your landlord, identify any local resources or assistance programs you may be eligible for, and fill out the CDC’s declaration form to ensure you’re not evicted. There are many options to help you keep your home and avoid further distress.ARTICLE TABLE OF CONTENTSSkip to section
According to the data from the Census Bureau’s Survey of Construction (SOC), stucco was the most common principal exterior material on new single-family homes started in 2019 (27 percent), followed by Vinyl siding (25 percent), fiber cement siding (such as Hardiplank or Hardiboard (21 percent), brick or brick veneer (20 percent). Far smaller shares of single-family homes started last year had wood or wood products (5 percent) or stone or rock or other stone materials (1 percent) as the principal exterior wall material.
The Census Bureau’s SOC data is available by the nine census divisions and there are substantial differences in the use of siding across divisions. Vinyl siding was the most widely used primary exterior material in 4 out of 9 census divisions. In the Middle Atlantic and New England, vinyl siding was used in 75 percent and 68 percent of the new homes started in 2019. In the East and West North Central divisions, vinyl siding accounted for 62 and 44 percent respectively. You should head to the Quality Built Exteriors site if you’re planning to install vinyl siding for your home.
Stucco was the most common widely used as the primary exterior wall material in the Pacific, Mountain and South Atlantic divisions in 2019: 57 percent, 52 percent and 38 percent, respectively, of the new single-family homes started in those areas used it. Brick or brick veneer was the top choice in East and West South Central divisions. In the West South Central, 62 percent of the new single-family homes started in 2019 used Brick or brick veneer as the primary exterior material, compared to 44 percent in East South Central division.