Sales of existing homes rose 2.4% to a seasonally adjusted annualized rate of 6.0 million units, according to the National Association of Realtors.
Sales were 10.5% higher compared with August 2019. This is the highest sales pace since December 2006, before the Great Recession.
Tough competition has the market moving very quickly. It took just 22 days to sell a home in August, matching the fastest on record.
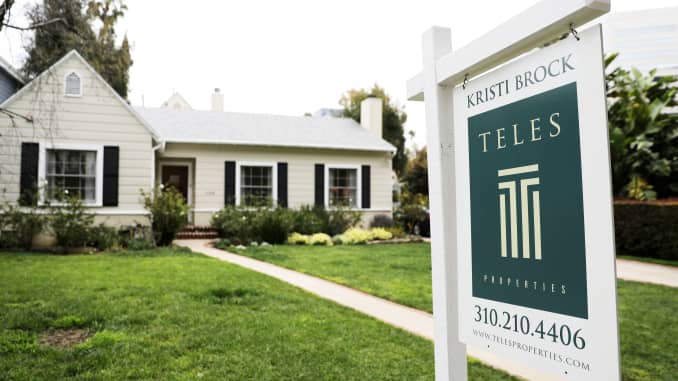
A home for sale is seen in Santa Monica, California.
After a record-setting July, the housing market still shows no sign of cooling off.
Sales of existing homes rose 2.4% to a seasonally adjusted annualized rate of 6 million units, according to the National Association of Realtors. Sales were 10.5% higher compared with August 2019. This is the highest sales pace since December 2006, before the Great Recession.
Sales were hampered only by lack of supply. There were 1.49 million homes for sale at the end of August, down 18.6% annually to a 3.0-month supply. The number of homes for sale when sales were last this robust, in 2006, was more than double the current supply.
That tight supply pushed the median price of an existing home sold in August to a record high of $310,600. That is up 11.4% annually. In the third quarter of this year the housing wealth will have increased by $1.5 trillion from the second quarter.
“The imbalance of supply and demand will hurt affordability soon. Once that appears it will hinder home ownership rates,” said Lawrence Yun, chief economist for the Realtors.
Tough competition has the market moving very quickly. It took just 22 days to sell a home in August, matching the fastest on record.
Mortgage rates set several record lows in August, which only added to the fierce competition for housing. Low rates also kept the heat on home prices, as they give buyers additional purchasing power.
Regionally, sales were strongest in the Northeast, rising 13.8% month to month. Sales were 1.4% higher in the Midwest and 0.8% higher in both the South and West. The Northeast saw some of the strictest shutdown rules early in the coronavirus pandemic, so the recovery now may be making up for that.
Sales of newly built homes, which are counted by signed contracts, not closings, jumped 36% annually in July. Builders are benefiting from the tight supply of existing homes for sale, as well as for the new consumer demand for higher-tech homes in suburban and rural locations.
Strong demand is expected to continue into the usually slower fall months, but there may be a brief drop in the numbers because of the various natural disasters across the nation.
“In early September, new housing supply took a hit from the wildfires and hurricanes, and sales activity weakened. But because the impact of natural disasters has been more supply-oriented than demand-oriented, prices are expected to remain high,” said Danielle Hale, chief economist at realtor.com. “The combination of high prices and low supply is going to continue to make finding a home an even more difficult task than it already is.”
The number of empty rental apartments in Manhattan nearly tripled compared with last year, according to a report from Douglas Elliman and Miller Samuel.
The inventory of empty units, which rose to 15,000 in August, is the largest ever recorded since data started being collected 14 years ago, the report said.
Hopes for a rebound in the fall or the end of 2020 look increasingly unlikely.
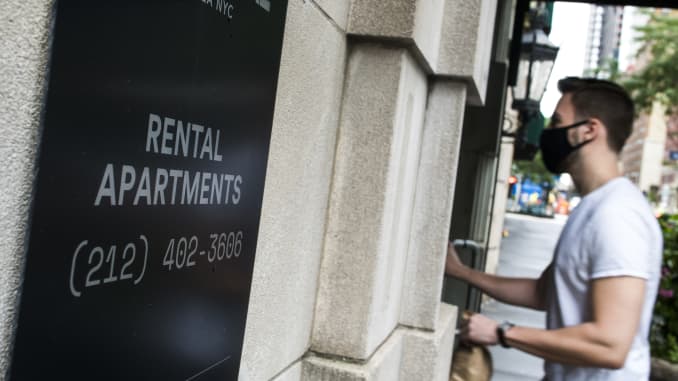
A man enters a building with rental apartments available on August 19, 2020 in New York City.
The number of empty rental apartments in Manhattan nearly tripled compared with last year, as more New Yorkers fled the city and prices declined.
There were more than 15,000 empty rental apartments in Manhattan in August, up from 5,600 a year ago, according to a report from Douglas Elliman and Miller Samuel. The inventory of empty units is the largest ever recorded since data started being collected 14 years ago, the report said.
Analysts say the rental market is the best barometer of overall strength in Manhattan’s real estate market, since rentals account for 75% of apartments and that market reacts more quickly to demand changing than the sales market.
Experts say the migration from the city to the suburbs during the Covid-19 crisis has been fueled in large part by Manhattan renters leaving the city.
“The rental market is weak and getting weaker,” said Jonathan Miller, CEO of Miller Samuel. “The first-time buyers in outlying areas are largely coming from the Manhattan rental market.”
Hopes for a rebound in the fall or the end of 2020 look increasingly unlikely. Although rental prices have come down — median rental prices fell 4% in August — the discounts are not steep enough yet to lure new renters back to the city. The average rental price for a two-bedroom in Manhattan is still $4,756 a month.
The fall is generally a slow period in the Manhattan rental market, especially before an election, Miller said.
Landlords are offering ever-larger incentives to try to entice renters, with the largest share of landlords offering concessions in history. On average, landlords were offering 1.9 months of free rent to new renters in August. The weakest segment of the rental market is the lower end, for one bedrooms and studios, partly a result of the pandemic’s greater impact on lower earners.
Average rental prices for studios fell 9%, to $2,574, while the average for one-bedroom apartments fell 5% to $3,445.
The big question for the Manhattan economy and beyond is how far will the economic ripples from the weak rental market spread. While big landlords like REITs and real estate companies (see a great option here) have access to capital, smaller mom and pop landlords with just one or two buildings may have trouble paying their mortgages and property taxes, which could later hit banks and lenders, as well as New York’s tax revenue.
“Where you are already seeing stress on landlords is on the low end of the price spectrum,” Miller said. “You’re clearly seeing weakness in the smaller end of the rental market.”
Sales activity continued to strengthen in NYC, with July 2020 up 40% M-o-M and down only 33% Y-o-Y
Weekly sales surpassed 500 transactions for first time in 15 weeks, monthly sales top 2,000 for first time in four months
Queens median sale price marks first Y-o-Y drop, down 10% in July
At $1.065 million, Manhattan YTD median slides 15% below 2019 figures
The Bronx has highest price growth with July median up 7% Y-o-Y
Brooklyn median drops 9% Y-o-Y, virtually erasing year-to-date gains
After a tumultuous first half of the year, all of the state of New York is now in Phase Four of reopening, which means the performance of the residential market performance is of heightened interest. The year actually started off well, promising increased sales activity — until projections and expectations were shattered by the uncertainty and upheaval of March. It was followed by an April marked by historical lows in sales activity and the strongest pricing trends of 2020 up to that point.
However, as the curve flattened and the general public started readjusting to the new normal, the state’s gradual reopening brought a tentative return of transactional activity in May. Then, June presented a whole new picture with strengthening sales trends and the first significant year-over-year (Y-o-Y) price drop, despite recording the highest median sale price this year at $717,733.
July, however, posted the sharpest decrease of the four boroughs’ median sale price, and also marked the strongest month of sales since March.
Transactional activity, of course, has trended negative since the beginning of the crisis. March kicked off with sales activity 15% higher than the same period last year, only to see it drop 36% Y-o-Y by month’s end. Later, sales activity bottomed out in April — its 1,549 deals equated to a 61% Y-o-Y drop. And, while May’s 1,337 recorded sales were certainly a drop in sheer numbers compared to April, they also represented a decrease of only 52% Y-o-Y, promising a tentative return of transactional activity.
In June, sales trends strengthened even further and, at this point, the monthly sales activity was the highest since the beginning of the crisis in March. Specifically, there were 1,670 residential sales for the month, coming in just 41% lower Y-o-Y. However, it must be noted that June 2020 figures were skewed beyond just the pandemic’s effects – sales activity and the median sale price surged artificially in June 2019 as buyers and sellers rushed to close deals before the new mansion tax went into effect in July 2019.
Similarly, July marked only one week with fewer than 400 sales. What’s more, two weeks of the month surpassed 500 transactions — a level of transactional activity not seen since late March. In fact, the second week of the month totaled 562 sales, just four deals shy of equaling the last week of March.
What’s more, the third week of July recorded a 23% Y-o-Y drop — the smallest rate of contraction in sales activity since the third week of March. All in all, July’s sales activity was the most dynamic in the last four months, closing a total of 2,343 deals across the four boroughs for a drop of just 33% Y-o-Y. Moreover, compared to June, sales activity experienced a month-over-month surge of 40%.
While pricing trends remained firmly positive at the beginning of the crisis and the NYC median sale price remained steadily above the same period last year, that trend started shifting in June and reversed completely in July.
Specifically, both March and April boasted a 5% Y-o-Y price expansion. Moreover, each week in March also posted a median sale price higher than the same period in 2019 — a trend that remained steady throughout April. Overall, May kept up with that trend, as well, and closed with a median sale price of $705,000 for a 4% gain over May 2019.
Along the same lines, June 2020 kicked off with the strongest pricing trends so far this year. The NYC the median sale price was $743,000 in its first week, which pushed the month’s overall median to $717,700. This also made June 2020 the most expensive month YTD, even as it closed with a 2% Y-o-Y drop in its median, which was influenced, once again, by the artificially inflated pricing in June 2019.
July, however, presented a whole new picture. While the $780,000 median of July 2019 also reflected the pre-mansion tax sales frenzy that had occurred in the upper end of the market, this was not the sole cause of the 13% Y-o-Y drop that was recorded in July 2020. Rather, at $680,000, July 2020 featured the lowest median sale price since March, bringing down the YTD median for the four boroughs.
So, while the elevated pricing trends of Q2 resulted in a H1 median sale price of $690,000 and a 3% gain over H1 2019, the contrary pricing trends of July almost completely erased that. In particular, July 2019’s artificially inflated median — paired with a July 2020 that was more in line with pre-pandemic figures — brought the YTD median sale price in NYC to $687,419, representing a negligible .35% Y-o-Y gain.
At the same time, year-to-date sales activity stood at 16,559 transactions, down 26% compared to the same timeframe last year. As a result, July’s recovering sales activity also decreased the YTD sales activity by only 1% Y-o-Y.
Manhattan was the hardest hit residential market in the city in the first half of the year. Here, sales activity was down 31% Y-o-Y and the median sale price dropped 13%. Specifically, the first half of 2019 totaled 5,487 residential sales for a median sale price of $1.2 million, while H1 2020 recorded 3,775 sales for a $1.05 million median. While pricing trends remained firmly positive in the other three boroughs throughout Q2, for Manhattan, that was the exception rather than the rule.
In fact, only April saw prices increase Y-o-Y reaching a YTD high of $1.34 million — while both March and June slipped under the $1 million mark, reaching $950,000 and $966,000, respectively. June’s median also resulted in a Y-o-Y price contraction of 37% — due, in part, to the rush to close high-end deals prior to the mansion tax during the year prior. From a sales activity perspective, July’s 633 sales made for Manhattan’s strongest month since the beginning of the crisis. That figure represented a 36% Y-o-Y drop in sales — the least-drastic decrease since March.
At the same time, the median sale price for NYC’s most expensive borough came in at $1.15 million, down 26% Y-o-Y. But, it must be noted that of all the boroughs, Manhattan’s year-ago metrics were the most influenced by the spike in sales of higher-priced assets prior to the mansion tax, pushing July 2019’s median to $1.56 million. Additionally, Manhattan was the only borough to record M-o-M price growth in July, gaining 19% for a $1.15 million median in July.
On the other hand, Queens seemed to navigate the crisis in the calmest manner, all things considered. Its sales activity was down 22% Y-o-Y in the first half 2020, but its median sale price went up 10%, for the highest price increase across the four boroughs. In fact, although sales activity growth in the borough bottomed out at a negative 58% in April, the median sale price jumped 19% to reach a YTD high of $630,000, followed closely by June’s $619,000.
July, however, reversed the upward trend in price growth observed in the first half of the year, becoming the first month in 2020 so far with negative price growth Y-o-Y. More precisely, at $576,500, Queens’ July median sale price was 10% below July 2019 — which, at $640,000, was 2019’s most expensive month up until that point. As a result, July 2020’s median was more in line with early 2020 pricing trends as opposed to the elevated medians recorded in Q2 and brought the borough’s YTD median to $584,500
Sales activity, however, strengthened in July, reaching 855 transactions and making this Queens’ most active month since March. In particular, July sales were down 28% Y-o-Y, resulting in the lowest rate of contraction in four months. Meanwhile, sales were up 55% compared to June — a promising sign in what is usually the most active borough for residential sales. Overall, that brought Queens’ YTD sales activity to 5,992 deals — 23% lower than the same period last year.
In the meantime, Bronx sales activity remained in negative growth territory Y-o-Y, coming in 22% below July 2019 for the lowest Y-o-Y decrease in sales activity across the four boroughs. But, the Bronx’s 260 sales recorded in July also represented a 60% increase M-o-M. That brought the borough’s number of sales to 1,679 YTD, for a 24% decrease compared to the first seven months of 2019.
Although the Bronx closed the first half of 2020 with the lowest median sale price of the four boroughs as usual, it actually recorded the second-highest price increase. Specifically, its 8% Y-o-Y gain took its H1 median sale price from $420,000 in 2019 to $455,000 in 2020. In fact, May brought a 33% price surge to the Bronx and lifted the median sale price to a YTD high of $531,000. Likewise, although July’s median was a more modest $493,500, it was still up 7% Y-o-Y – a notable achievement considering that July was 2019’s priciest month by that point.
From a pricing perspective, Brooklyn performed somewhat weaker in the first six months of the year. Its $750,000 median sale price was just 3% higher than it was in the first half of 2019. And, while 2020 transactional activity bottomed out at only 395 sales in May, Brooklyn’s median sale price surged to a YTD high of $820,000, followed closely by June’s $799,000 median sale price.
July’s median came in at $742,500, down 9% compared to the July 2019 median of $815,000. As a result, the borough’s YTD median of $750,000 also represented a 1% increase over the same period last year.
However, Brooklyn’s YTD sales activity was down 24% compared to the same period last year, with a total of 4,480 sales recorded in the first seven months of the year. Sales activity here contracted at the least sharpest rate in H1, coming in 21% below the first half of 2019.
July sales activity, however, did not experience the same influential increase in Brooklyn as the other three boroughs. It came in 41% lower than July 2019. But, compared to June 2020, sales were up, with its 595 sales representing a 19% gain M-o-M.
Methodology
For this snapshot of the COVID-19 pandemic’s influence on the NYC residential market, we considered all sales of condo, co-op, single- and two-family homes registered between January 1, 2019, and August 2, 2019, as well as January 1, 2020, and July 31, 2020. We excluded all sales below $10,000, as well as all package deals. We defined NYC as the four boroughs of Manhattan, Brooklyn, the Bronx and Queens.
Despite an economic downturn this summer, a homebuying frenzy boosted home prices by almost 9% and drove available housing inventory down 30% in August compared to the same time last year, according to Zillow.
A foreclosure moratorium on federally-backed mortgages (now extended through December 31), which was designed to keep people in their homes during the coronavirus pandemic, has inflated the housing market, according to economists.
“That is a whole bunch of inventory [homes in forbearance], which would normally actually be selling at fire sale prices. Where instead — and I mean this is great news for those folks, that they can hunker down [and] they can stay put — but it is actually kind of locking up a lot of home inventory,” Jeff Tucker, economist at Zillow, told Yahoo Finance’s The Final Round.
In the Great Recession of 2008, banks foreclosed on almost 2% of houses in the U.S., unleashing a glut of houses onto the market and causing home prices to plummet. But today the Coronavirus Aid, Relief, and Economic Security (CARES) Act instituted protections to keep people in their homes during the coronavirus pandemic, offering foreclosure moratoriums and mortgage forbearance options for homes with federally-backed mortgages.
“I think that’s probably one of the biggest things stopping home sales right now,” said Tucker.
As the economy recovers, some 7% of mortgages are still in forbearance, according to the Mortgage Bankers Association, a Washington, D.C.-based professional organization. But forbearance and foreclosure protections won’t last forever, and for many homeowners, mortgage payments are stacking up — which could spell uncertainty for the housing market next year.
Mortgage forbearance is “going to expire for a lot — millions — of homeowners in March, April, May of next year. It’s a really big open question. How many of those folks are back in work by then? How many of them are able to get back on track with their mortgage payments?” said Tucker.
But these protections aren’t the only reason housing supply is so low. The U.S. has had an affordable housing shortage for more than a decade, and now 5 million millennials (age 26 to 35) are reaching the age where they want to buy, fueling demand.
Plus, demand skyrocketed this summer beyond what was predicted: pending sales in the last week of August were up 19% from the same time last year. Shutdowns this spring created pent-up demand that pushed peak homebuying season into late summer and early fall. And lifestyle changes during the pandemic have prompted many city dwellers to move to the suburbs.
“A lot of the sales that would have happened in March and April are getting pushed back later into summer. And especially since a lot of people have kids just at home doing remote school, they’re more willing to continue shopping and make that big move in September or October at this point,” said Tucker.
Developers struggle to build apartments in busy, social neighborhoods at a price Gen Z is willing to pay.
In October, AvalonBay Communities will open 238 new apartments at Kanso Twinbrook in Rockville, Md., near Washington, D.C. Courtesy AvalonBay Communities
Developers often want their new developments to appeal to the youngest renters. That may be difficult with the young people of Generation Z, now graduating from college and looking for places to live.
They are notoriously frugal. The oldest—born from the mid- to late 1990s—came of age during the long, slow recovery from the global financial crisis. They were used to living on a budget long before the new economic crisis caused by the spread of the novel coronavirus.
“Gen Z tends to value experiences more than they value things or possessions,” says Lela Cirjakovic, executive vice president of operations for Waterton, an apartment company based in Chicago. “They also place a high value on community… Spending time with people doing things is more valuable to them than having luxury items.”
That frugality might keep Generation Z away from new buildings in the most expensive housing markets—even though they are drawn to social areas.
“Land costs in the urban core likely preclude the delivery of new apartments that most Gen Z renters can afford,” says Greg Willett, chief economist for RealPage, a technology and data company based in Richardson, Texas. “Those who can afford new developments at all probably will opt for suburban settings.”
New Apartments Designed for Frugality
In October, AvalonBay Communities will open 238 new apartments at Kanso Twinbrook in Rockville, Md., near Washington, D.C.
Kanso Twinbrook does not have a leasing office. Instead, it has a prospect self-entry showroom with a sample finishes and a digital screen to describe the community. Courtesy AvalonBay Communities
“Kanso will be our first new development without any physical amenities or even a leasing office,” says Karen Hollinger, senior vice president of strategic initiatives for AvalonBay Communities, headquartered in Arlington, Va. “I’m not sure any one generation has the lock on frugality, but certainly there is a growing demand by a younger generation for a lower net cost housing model.”
Willett adds that research typically paints Gen Z as a practical group with frugal spending patterns. “So many of them grew up in cash-strapped households. … Housing affordability has been a challenge for the group, especially for those with substantial student debt.”
However, these young adults do require strong, fast Internet and cellphone service.
“Tech is a deal breaker,” says Cirjakovic. “On a very basic level, reliable and robust service in apartments and common spaces is critical.”
Young renters are also more likely to expect their homes to include Internet-enabled devices like smart thermostats and electronic locks. Elie Rieder, CEO of Castle Lanterra Properties, says, “Smart homes are a gimmick to previous generations but a must for Generation Z, as conservation and control are simply standard with them.”
Being frugal, these younger renters are often less likely than older renters to pay a premium of extra rent for this Internet-enabled gear. “It will be the base expectation versus a differentiator for them,” says Rieder.
Gen Z May Choose Roommates Despite Pandemic
When times get tough, young renters often double up with roommates or move home to live with their parents for a time.
“Younger cohorts are typically disproportionately affected by employment losses in recessions, a fact already reflected in the April and May job reports,” says Andrew Rybczynski, managing consultant in the Boston office of CoStar Portfolio Strategy. “We expect household consolidation for economic reasons, which could also prevent move-outs from parents’ households.”
Apartment developers had begun to build new “co-living” communities based around the idea that renters would want to share space as roommates.
“The model of large-scale shared housing fits well with a desire for lowered costs and increased socialization, but it certainly doesn’t fit well with the need to quarantine,” says AvalonBay’s Hollinger. “If financing was tough before, it just got much tougher.”
In the aftermath of the pandemic, tough economic times and the ability to work remotely may steer young renters away from the most expensive urban markets, like San Francisco and New York City. “Markets with high rents will likely suffer the most, as Gen Z decides to seek markets where they can achieve a much more favorable balance,” says Cirjakovic.
Young renters may also have less need to live near job centers. “Post-pandemic, almost anyone who is not a service provider can potentially work remotely,” says Cirjakovic.
However, these young renters will probably still want live near entertainment, dining, and other people in their age group. “Culture, connectivity, and proximity to similar people will be the draw,” says Rieder. “True walkable live-work-play locations are key. That usually means very urban.”
The CDC issues a nationwide ban on evictions through Dec. 31, but tenants who are behind on rent must advocate for themselves. We explain.
The CDC’s new eviction moratorium is meant, in part, to curb homelessness, which could lead to more COVID-19 cases.Mint Images/Getty Images
A national eviction moratorium is back in effect, this time with far broader protections than the now-defunct eviction ban established by the CARES Act. While the previous law only covered certain types of properties, the new moratorium effectively protects everyone living in one of the nation’s 43 million rental households, regardless of where they reside.
But the new ban on evictions, which went into effect Sept. 1 and is set to expire Dec. 31, didn’t come from Congress or the Department of Housing and Urban Development. Instead, it was issued by the Centers for Disease Control and Prevention, using authority granted to the federal government in a 1944 public health law. To that end, the stated purpose of the order is to keep people out of homeless shelters or other crowded living conditions that could worsen the spread of COVID-19.
Unlike previous federal measures, the CDC’s real estate leads order requires tenants who fall behind on rent to submit a declaration to their landlord that states they’ve lost income due to the coronavirus pandemic and have made an effort to look for financial assistance, as well as a few other conditions.
We’ll dig into this new eviction moratorium to unpack who is covered, what might not be covered and what you need to do now if you’re worried about getting evicted. Plus we’ll take a look at what other resources and options are available to help you stay in your home. We update this story frequently.
If you’re worried about making rent, you aren’t alone. Josh Miller/CNET
What does the new eviction ban do (and not do)?
The CDC’s new order halts evictions across the US for anyone who has lost income due to the coronavirus pandemic and has fallen behind on rent. It doesn’t prohibit late fees, nor does it let tenants off the hook for back rent they owe. It also doesn’t establish any kind of financial fund to help renters get caught up — a safeguard some have say is critical to preventing a massive wave of evictions when the ban lifts.
The order only halts evictions for not paying rent. Lease violations for other infractions — criminal conduct, becoming a nuisance, etc. — are still enforceable with eviction. And it only protects renters earning less than $99,000 per year ($198,000 for joint filers).
The order requires renters facing eviction to fill out an as-yet unreleased government form attesting to several things: The tenant has lost income due to the pandemic, is currently unable to pay full rent, has made an effort to pay as much as possible, has sought financial help where available and would likely end up homeless or otherwise forced to live in crowded quarters if evicted.
It’s still unclear how much cash Congress plans to put in American’s pockets with a second stimulus bill.Angela Lang/CNET
CDC’s order doesn’t change state laws
Any state-level eviction bans still in effect will remain in place as they are as broad or broader than that established by the CDC. To help you find out the status of eviction protection in your state, legal services site Nolo.com maintains an updated list of state eviction provisions.
It may be worth approaching your landlord to see if you can pay less rent in the coming months, or spread payments for the next couple of months’ rent out over the next year. Just be wary of landlords who make excessive demands. For example, some have asked tenants to turn over their $1,200 stimulus check or any money received from charity as a condition for not filing an eviction order. Don’t agree to unreasonable conditions or terms you won’t be able to meet, especially if your city or state has enacted protections against such arrangements.
Although almost all Washington lawmakers agree there should be another round of direct payments (aka “stimulus checks”), Congress has yet to pass a bill authorizing the payments.Sarah Tew/CNET
What you can do if you’re facing financial hardship right now
In response to the coronavirus pandemic, many states and cities have expanded their available financial assistance for those who are struggling to pay rent. To see what programs might be available near you, select your state on this interactive map maintained by the National Low Income Housing Association.
Nonprofit 211.org connects those in need of help with essential community services in their area and has a specific portal for pandemic assistance. If you’re having trouble with your food budget or paying your housing bills, you can use 211.org’s online search tool or dial 211 on your phone to talk to someone who can try to help.
The online legal services chatbot at DoNotPay.com has a coronavirus financial relief tool that it says will identify which of the laws, ordinances and measures covering rent and evictions apply to you based on your location.
If you’re seriously delinquent or know you will be soon, you may want to consult a lawyer to better understand how laws in your area apply to your situation. Legal Aid provides attorneys free of charge to qualified clients who need help with civil matters such as evictions. You can locate the nearest Legal Aid office using this search tool.
Finally, if you can no longer afford rent on your current home, relocation might be an option. Average rental prices have declined across the US since February, according to an August report by Zillow. Apps like Zillow, Trulia and Zumper can help you find something more affordable. Just be aware that you may still be held responsible for any back rent you currently owe as well as any rent that accrues between now and the end of your lease (if you have one), whether or not you vacate.
Freddie Mac today released the results of its Primary Mortgage Market Survey® (PMMS®), showing that the 30-year fixed-rate mortgage (FRM) averaged 2.86 percent, the lowest rate in our survey’s history which dates back to 1971.
“Mortgage rates have hit another record low due to a late summer slowdown in the economic recovery,” said Sam Khater, Freddie Mac’s Chief Economist. “These low rates have ignited robust purchase demand activity, which is up twenty-five percent from a year ago and has been growing at double digit rates for four consecutive months. However, heading into the fall it will be difficult to sustain the growth momentum in purchases because the lack of supply is already exhibiting a constraint on sales activity.”
30-year fixed-rate mortgage averaged 2.86 percent with an average 0.8 point for the week ending September 10, 2020, down from last week when it averaged 2.93 percent. A year ago at this time, the 30-year FRM averaged 3.56 percent.
15-year fixed-rate mortgage averaged 2.37 percent with an average 0.7 point, down from last week when it averaged 2.42 percent. A year ago at this time, the 15-year FRM averaged 3.09 percent.
5-year Treasury-indexed hybrid adjustable-rate mortgage (ARM) averaged 3.11 percent with an average 0.2 point, up from last week when it averaged 2.93 percent. A year ago at this time, the 5-year ARM averaged 3.36 percent.
The PMMS® is focused on conventional, conforming, fully-amortizing home purchase loans for borrowers who put 20 percent down and have excellent credit. Average commitment rates should be reported along with average fees and points to reflect the total upfront cost of obtaining the mortgage. Visit the following link for the Definitions. Borrowers may still pay closing costs which are not included in the survey.
Nationally, home prices in July were 5.5% higher than in 2019. That is a marked increase from the 4.3% annual gain seen in June, according to CoreLogic.
The average rate on the popular 30-year fixed mortgage fell below 3% for the first time even in July, giving buyers additional purchasing power.
Exceptionally strong demand, historically low supply and record low mortgage rates are combining to fuel the fastest home price growth since 2018.
Nationally, home prices in July were 5.5% higher than in 2019. That is a marked increase from the 4.3% annual gain seen in June, according to CoreLogic.
Falling mortgage rates helped bolster the pent-up demand from spring, when home sales ground to a halt due to the start of the coronavirus pandemic. The average rate on the popular 30-year fixed fell below 3% for the first time even in July, giving buyers additional purchasing power.
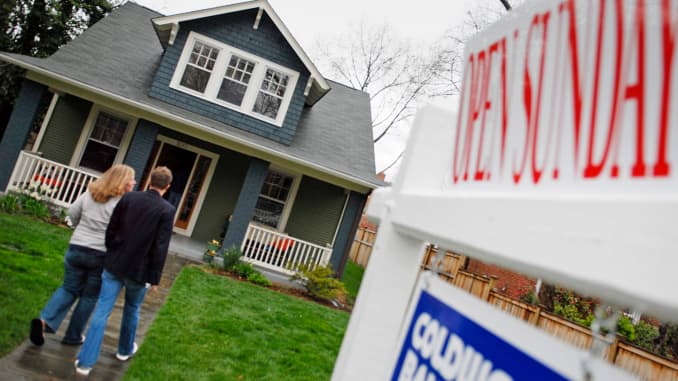
Prospective buyers visit an open house for sale in Alexandria, Virginia
“Lower-priced homes are sought after and have had faster annual price growth than luxury homes,” said Frank Nothaft, CoreLogic’s chief economist. “First-time buyers and investors are actively seeking lower-priced homes, and that segment of the housing market is in particularly short supply.”
The inventory of homes priced under $100,000 was down 32% annually in July, according to the National Association of Realtors. Compare that with the supply of homes priced at $500,000 to $750,000, which was down just 9%.
Of course, all real estate is local, and especially so now as the pandemic is hitting some markets harder than others. Homebuying is gaining significant strength in more affordable suburban and rural areas as buyers seek more space for the new work-and-school-at-home economy. CoreLogic cites Nassau and Suffolk counties on Long Island, New York, where home prices jumped 4.3% annually in July, likely due in part to urban flight from New York City. Prices in the New York metropolitan area rose just 0.4%.
Home prices in San Francisco were also less than 1% higher annually, compared with the Washington, D.C., metropolitan area, which saw prices up over 5%. There is much less flight from the D.C. area than from San Francisco, as tech workers, who can now work from anywhere, leave the latter in search of more affordable homes.WATCH NOWVIDEO02:36Number of evictions set to rise as moratorium expires in 30 states
Economists at CoreLogic predict that homes will stay positive in 2021, but that the gains will weaken, as the initial surge of pandemic buying wanes. Certain markets particularly hard hit by the pandemic could suffer the most. Las Vegas and Miami are notable examples because their economies rely heavily on tourism and entertainment.
There is also concern that as various mortgage bailout programs begin to expire, there will be a surge in sales of distressed homes. While the market will likely absorb these homes quickly, given the current housing shortage, the additional supply will take some of the heat out of home prices.
New single-family home sales surged in July, as housing demand was supported by low interest rates, a renewed consumer focus on the importance of housing, and rising demand in lower-density markets like suburbs and exurbs.
Census and HUD estimated new home sales in July at a 901,000 seasonally adjusted annual pace, an approximate 14% gain over June and the strongest seasonally adjusted annual rate since the end of 2006. The April data (570,000 annualized pace) marks the low point of sales for the current recession. The April rate was 26% lower than the prior peak, pre-recession rate set in January.
The gains for new home sales are consistent with the NAHB/Wells Fargo HMI, which equaled a data series high in August, demonstrating that housing is the leading sector for the economy. In fact, you can visit The House Guys to find a cash buyer for your property. Consider that despite double-digit unemployment, new home sales are estimated to be 8% higher for the first seven months of 2020 compared to the first seven months of 2019.
Sales-adjusted inventory levels declined again, falling to a just a 4 months’ supply in July, the lowest since 2013. This factor points to additional construction gains ahead. The count of completed, ready-to-occupy new homes is just 61,000 homes nationwide. Total inventory declined almost 9% year-over-year, with inventory down to 299,000.
Moreover, sales are increasingly coming from homes that have not started construction, with that count up 34% year-over-year. In contrast, sales of completed, ready-to-occupy homes are down almost 24%. These measures point to continued gains for single-family construction ahead.
Thus far in 2020, new home sales are higher in all regions. Sales on a year-to-date basis are 5% higher in the South, 9% in the West, 20% in the Midwest, and 22% higher in the Northeast.
S&P CoreLogic Case-Shiller Index Reports 4.3% Annual Home Price Gain In June
S&P Dow Jones Indices today released the latest results for the S&P CoreLogic Case-Shiller Indices, the leading measure of U.S. home prices. Data released today for June 2020 show that home prices continue to increase at a modest rate across the U.S. More than 27 years of history are available for these data series, and can be accessed in full by going to www.spdji.com.
Please note that transaction records for March, April, May and June 2020 for Wayne County, MI are unavailable due to delays at the local recording office caused by the COVID-19 lockdown. Since Wayne is the most populous county in the Detroit metro area, S&P Dow Jones Indices and CoreLogic are unable to generate a valid March, April, May and June 2020 update of the Detroit S&P CoreLogic Case-Shiller indices for the August release.
When the sale transaction data flow resumes for Wayne County, S&P Dow Jones Indices and CoreLogic will provide estimated Detroit index values for months with missing updates.
YEAR-OVER-YEAR
The S&P CoreLogic Case-Shiller U.S. National Home Price NSA Index, covering all nine U.S. census divisions, reported a 4.3% annual gain in June, no change from the previous month. The 10-City Composite annual increase came in at 2.8%, down from 3.0% in the previous month. The 20-City Composite posted a 3.5% year-over-year gain, down from 3.6% in the previous month.
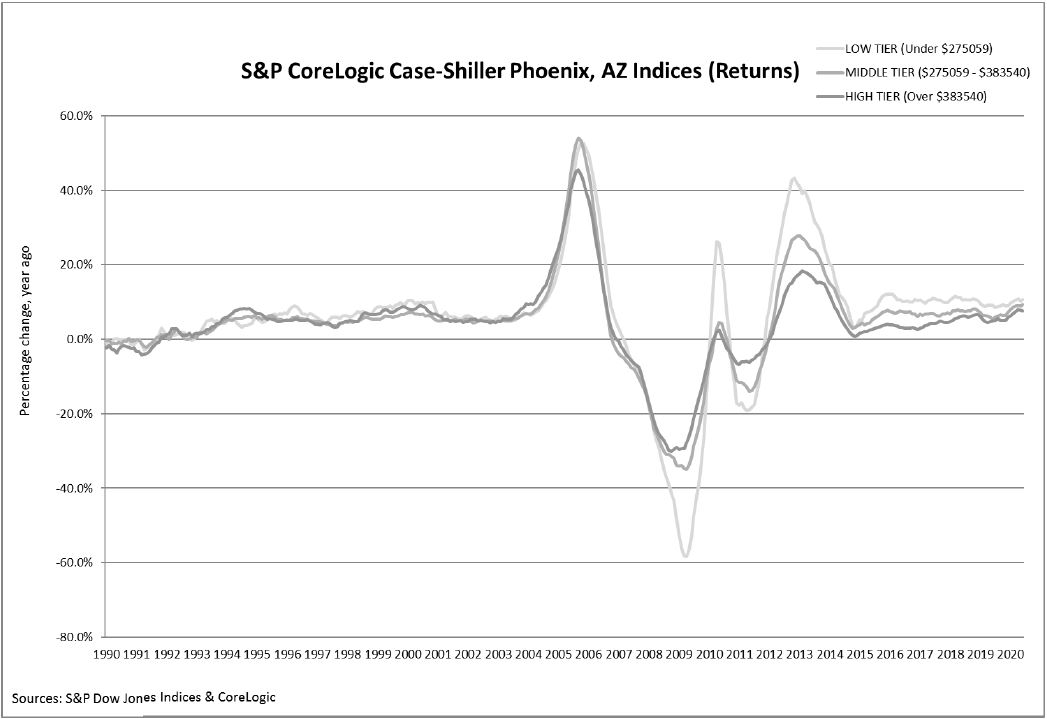
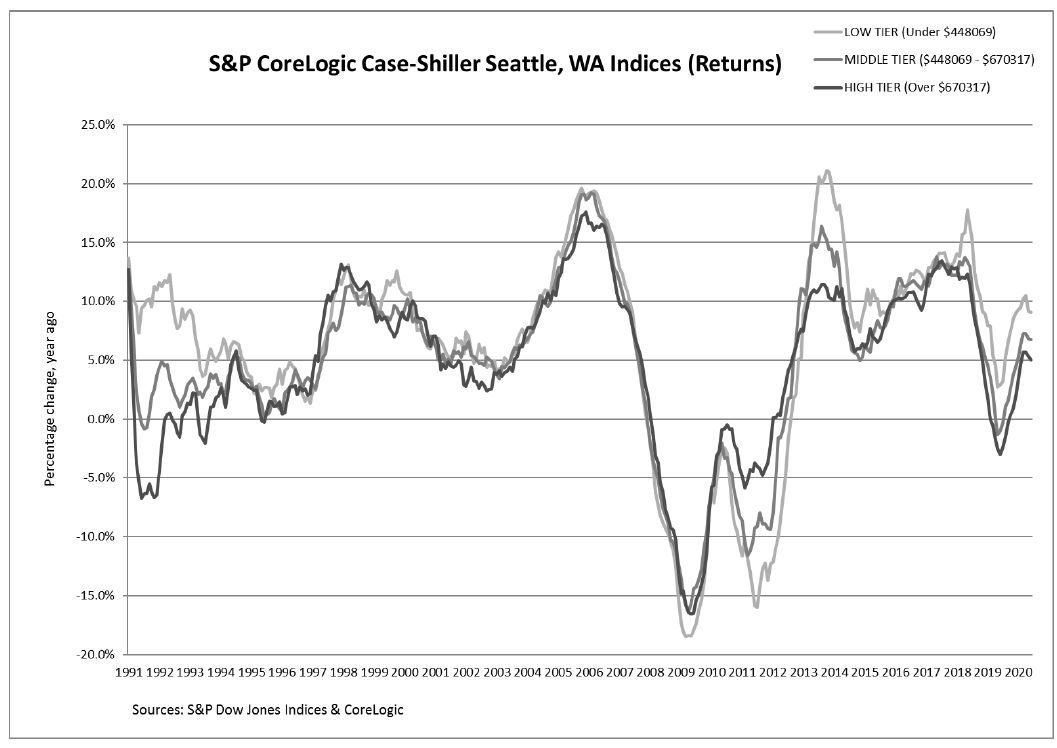
Phoenix, Seattle and Tampa continued to report the highest year-over-year gains among the 19 cities (excluding Detroit) in June. Phoenix led the way with a 9.0% year-over-year price increase, followed by Seattle with a 6.5% increase and Tampa with a 5.9% increase. Five of the 19 cities reported higher price increases in the year ending June 2020 versus the year ending May 2020.
The charts on the following page compare year-over-year returns of different housing price ranges (tiers) for Phoenix and Seattle.
MONTH-OVER-MONTH
The National Index posted a 0.6% month-over-month increase, while the 10-City and 20-City Composites posted increases of 0.1% and 0.2% respectively before seasonal adjustment in June. After seasonal adjustment, the National Index posted a month-over-month increase of 0.2%, while the 10-City Composite posted a decrease of 0.1% and the 20-City Composite did not post any gains. In June, 16 of 19 cities (excluding Detroit) reported increases before seasonal adjustment, while 12 of the 19 cities reported increases after seasonal adjustment.
ANALYSIS
“Housing prices were stable in June,” says Craig J. Lazzara, Managing Director and Global Head of Index Investment Strategy at S&P Dow Jones Indices. “The National Composite Index rose by 4.3% in June 2020, as it had also done in May (June’s growth was slightly lower in the 10- and 20-City Composites, which were up 2.8% and 3.5%, respectively). More data will be required to understand whether the market resumes its previous path of accelerating prices, continues to decelerate, or remains stable. That said, it’s important to bear in mind that deceleration is quite different from an environment in which prices actually fall.
“June’s gains were quite broad-based. Prices increased in all 19 cities for which we have data, accelerating in five of them. Phoenix retains the top spot for the 13th consecutive month, with a gain of 9.0% for June. Home prices in Seattle rose by 6.5%, followed by Tampa at 5.9% and Charlotte at 5.7%. As has been the case for the last several months, prices were particularly strong in the Southeast and West, and comparatively weak in the Midwest and (especially) Northeast.