The Bureau of Labor Statistics (BLS) reported payroll employment expanded by 292 thousand in December and revisions added 50 thousand to estimates for the prior two months. The household survey showed strong gains in both the labor force (466 thousand) and persons employed (485 thousand).
The unemployment rate held steady at 5.0%. Three consecutive months of strong gains in both employment and the labor force are encouraging signals in the labor market. Other labor market indicators moved in opposite directions in December but have trended down over the year; part-time workers for economic reasons ticked down, while workers marginally attached to the labor force ticked up.
The pace of wage increases has been inching up over the year but caution is warranted. Continued strong job gains and a low unemployment rate should support further wage growth. But the pace of the thinning of the hidden labor supply will also be a factor. The fastest wage growth we’ve seen in past cycles has come when the unemployment rates moves below 5.0%, but in those periods the levels of part-time and marginally attached workers was significantly lower. Bringing those workers back and back up to speed may act as a hidden brake on more robust wage gains.
Just as few were surprised when the Federal Reserve announced the first increase in the target range for the federal funds rate in the statement following the December meeting, there were few surprises in the more detailed minutes of the meeting, released three weeks later.
The minutes reiterated the basic themes that have guided deliberations in recent months: accumulated improvements in economic growth and labor market conditions have been substantial, confidence that inflation will return to the two percent objective over the medium term is broad based, and the path of subsequent rate increases will be gradual. The anticipated gradual pace of future increases implies that monetary policy will remain accommodative, and the lags between policy actions and effects warrant an earlier move rather than risk falling behind the inflation curve and needing more abrupt tightening later.
One surprise was on the part of meeting participants; the surprising persistence of continuing declines in oil and commodity prices. Headline inflation measures have been held down by collapsing energy prices, but the Fed’s preferred measure, the core (excluding food and energy) price index for personal consumption expenditures (PCE) has been steady at 1.3% all year. The persistence of the “transitory” nature of the downward pressure on inflation has been a concern for some committee members. The uncertainty surrounding the inflation environment made the decision to raise interest a close call for some.
Freddie Mac (OTCQB: FMCC) today released the results of its Primary Mortgage Market Survey® (PMMS®), showing mortgage rates moving lower for the third consecutive week amid another week of market turbulence.
News Facts
30-year fixed-rate mortgage (FRM) averaged 3.81 percent with an average 0.6 point for the week ending January 21, 2016, down from last week when it averaged 3.92 percent. A year ago at this time, the 30-year FRM averaged 3.63 percent.
15-year FRM this week averaged 3.10 percent with an average 0.5 point, down from 3.19 percent last week. A year ago at this time, the 15-year FRM averaged 2.93 percent.
5-year Treasury-indexed hybrid adjustable-rate mortgage (ARM) averaged 2.91 percent this week with an average 0.5 point, down from last week when it averaged 3.01 percent. A year ago, the 5-year ARM averaged 2.83 percent.
Average commitment rates should be reported along with average fees and points to reflect the total upfront cost of obtaining the mortgage. Visit the following link for theDefinitions. Borrowers may still pay closing costs which are not included in the survey.
Quote Attributed to Sean Becketti, chief economist, Freddie Mac.
“The Freddie Mac mortgage rate survey had difficulty keeping up with market events this week. The 30-year mortgage rate dropped 11 basis points to 3.81 percent, the lowest ratein three months. This drop reflected weak inflation — 0.7 percent CPI inflation for all of 2015 — and nonstop financial market turbulence that is driving investors to the safe haven of Treasuries. However, the survey was largely complete prior to Wednesday’s Treasury rally that drove the yield on the 10-year Treasury below 2 percent, down 29 basis points since the end of 2015.”
The most recent release of Census’ Construction Spending report included significant revisions to the residential improvements spending category. Residential improvements spending is calculated as the amount of total private residential spending on owner-occupied units after accounting for single-family and multifamily expenditures. As discussed in an earlier post, with these changes, the total amount of spending on residential improvements more closely tracks NAHB’s remodelers’ sentiment.
According to Census, in the January 2016 release of the Construction Spending report, which provides construction spending data up to November 2015, monthly and annual estimates for private residential, total private, total residential and total construction spending for January 2005 through October 2015 were revised to correct a processing error in the tabulation of data on private residential improvement spending.
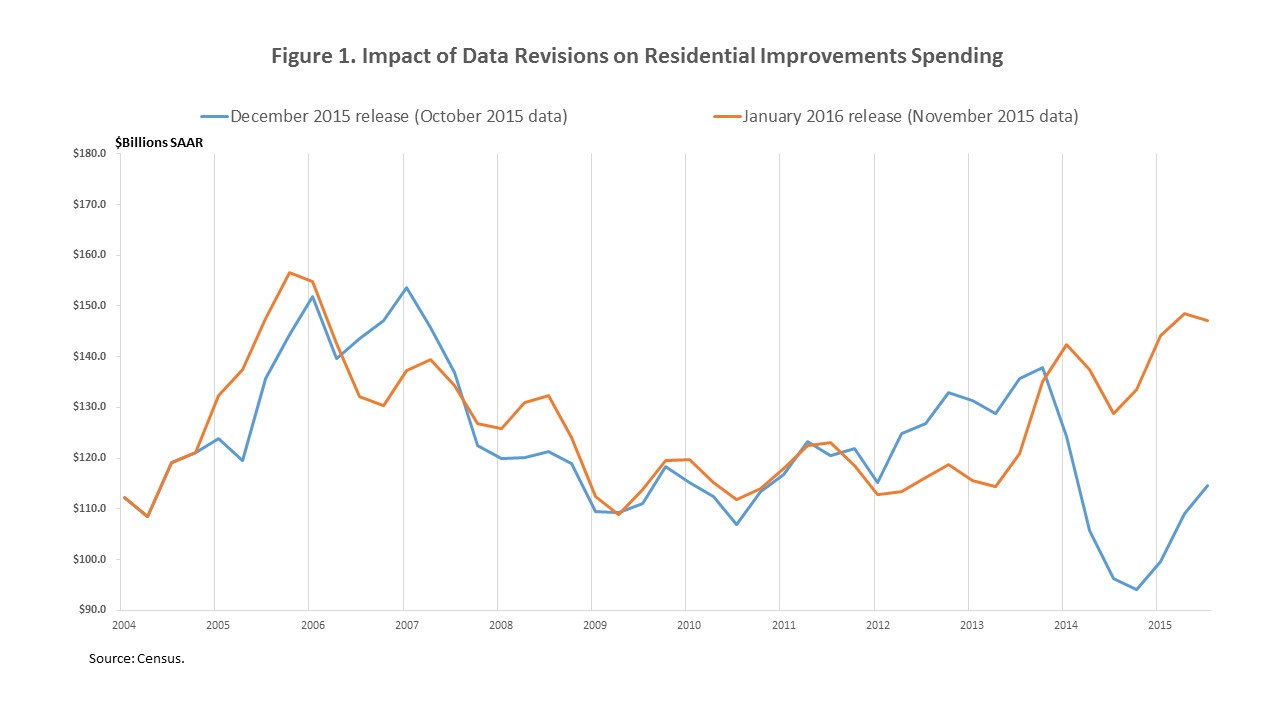
As illustrated in Figure 1, which shows residential improvements spending measured at a seasonally adjusted annual rate for each quarter, the revised series diverged noticeably from the first quarter of 2012 onward. Between 2012 and the third quarter of 2013, the revised series shows a muted increase while the previous series rose more significantly. In addition, the previous residential improvements series exhibited a steep decline over 2014 with a partial recovery in 2015. In contrast, the 2014 decline in the revised series is shallower, of a shorter duration, and is erased by the first quarter of 2015.
Figure 1 indicates that the revisions to residential improvements spending were sizable, especially in 2014 and the first three quarters of 2015. Between 2012 and the third quarter of 2013, the December 2015 release of residential improvements spending was revised down by an average of $12 billion in each quarter by the January 2016 release. On average, each quarter of spending over this period was revised down by 9%. The largest revision in this period took place in the first quarter of 2013 when the $131.3 billion in residential improvements spending was revised down by 12% to $115.6 billion.
Will another housing bubble bring down the U.S. economy?
Nearly a decade after the peak of the American real estate bubble, there’s no shortage of fear that we’ll repeat the whole nightmare again.
For years now, economy watchers have fretted over the run up in student loan debt, while more recently the collapse in junk bond prices had analysts drawing paralells to what happened in the subprime mortgage market in 2008. Legendary investor George Soros this week was quoted as saying the upheaval in China’s financial markets reminds him of the “crisis we had in 2008,” The Sunday Times in Sri Lankareported on Thursday.
But what if the next crisis isn’t just similar to the last one, but a word-for-word rip-off? That’s what a viewer of Quicken Loans’ latest ad for its new mortgage product, Rocket Mortgage, might just think. The tagline is, after all, “push button, get mortgage.”
After seeing that video (or an ad for the product on Fortune.com), you might be forgiven for having flashbacks to the last crisis. Meanwhile, competitors like Guaranteed Mortgage have resorted to hiring celebrities like Extreme Makeover Home Edition host Ty Pennington to pitch its online lending products.
But a hard look at the numbers should convince you that mortgage lenders aren’t handing out loans like a dentist giving out toothbrushes. Lending standards have come down a bit, but they remain tighter than they were before the mid-2000s bubble began inflating, and seemingly qualified buyers are still complaining about getting shut out of the real estate market.
For its part, Quicken Loans President and CMO Jay Farnar argues that products like Rocket Mortgage enable his firms to improve the quality of its lending, because it enables a more efficient collection of consumer data that helps make underwriting more robust.
Meanwhile, mortgage originations have remained flat for the past two years, and lenders are giving out fewer mortgages today then they were in 2012, when the housing recovery was just getting underway, according to data from the Mortgage Bankers Association.
In other words, it doesn’t look like irresponsible mortgage lending is inflating real estate prices beyond their fundamentals, but that doesn’t mean another form of capital won’t. That’s what housing analyst Marc Hanson has been arguing for sometime now. Housing prices, he contends, are about 25% to 60% above what the fundamentals of the U.S. economy can justify, but the market is being propped up by “unorthodox. . .incremental demand using unorthodox capital.”
This time around the unorthodox capital isn’t coming in the form of international investors piling money into the U.S. mortgage bond market, creating a doomsday machine that cranked out home loans with very little scrutiny, but from domestic institutional investors, folks buying second and third homes and serving as landlords, and foreign buyers stowing cash in American real estate.
Before you can repair concrete, you have to know what caused the problem in the first place. Here is advice on troubleshooting the damage and coming up with the best concrete repair solution.By Bill Palmer, ConcreteNetwork.com Columnist
Concrete surfaces are constantly under attack by the elements resulting in the need for repairs. Accuflex Coatings
When I was in college I had a job doing maintenance in a downtown Denver hotel. I didn’t really know what I was doing but most things weren’t that hard to figure out. One time, though, I needed to repair a broken up concrete door threshold. I removed the old concrete and went down to the hardware store and bought a bag of premixed concrete. I added the amount of water the bag said to use (maybe just a little extra for good luck) and poured it in and troweled it off-another job well done!
But no! Two weeks later my boss called me into his office. Seems he had just gone past my repair work and found it as cracked up as the original threshold. I was so disappointed! We went back to the scene of the crime to do some actual investigation in advance of launching off on another repair attempt. While we were standing there, one of the kitchen workers came through with a heavy hard-wheeled dolly loaded with supplies that dropped onto the threshold as he passed: we knew the cause of the problem. For the next repair, we added reinforcing steel, used higher strength concrete, and eliminated the drop-off onto the threshold. When I left a year later, the new threshold was still working well.
I took away a good lesson-one that I soon found applied to just about any repair work. Before you can repair anything you have to know what caused the problem in the first place and you have to understand how it is supposed to work. Only then can you make an intelligent decision on how to do the repair.
With any concrete repair, take that lesson to heart and you’re off to a great start. First figure out what caused the damage, do the necessary preparation of removing any unsound concrete and contamination, then install a repair designed to solve the problem. The worst thing you can do is make a repair that doesn’t last. Someone once told me that over 50% of concrete repairs fail again within two years. That is not a track record that inspires confidence.
So let’s start by evaluating the problem and then we can decide how we are going to make a durable repair. This article is only a very superficial treatment of this subject. For more details, the best source is either the International Concrete Repair Institute or the American Concrete Institute. ICRI, in conjunction with ACI, publishes the Concrete Repair Manual which is over 2000 pages long.
Housing starts in Canada decreased to a seasonally adjusted annualized rate of 172,965 units in December of 2015 from an upwardly revised 212,028 units in November and well below market expectations of 200,000 units. Urban starts dropped 19.1 percent to 159,007 units. The multi-unit segment shrank 27 percent to 101,264 units while the single-detached segment held steady at 57,743 units. In December, urban starts decreased in the Prairies, Ontario, and Atlantic Canada, but increased in British Columbia and Québec. Rural starts were estimated at a seasonally adjusted annual rate of 13,958 units. Housing Starts in Canada averaged 183.42 Thousand from 1977 until 2015, reaching an all time high of 291.60 Thousand in March of 1978 and a record low of 90.70 Thousand in August of 1982. Housing Starts in Canada is reported by the Canada Mortgage And Housing Corporation.
Last year, 66-year-old Lauren Knoblauch sold or donated nearly everything she owned, from her two-bedroom home on a suburban Seattle lake to her furniture and many of her clothes. She moved everything else, two small carloads’ worth, into her new home: a downtown apartment that, at less than 150 sq. ft., is smaller than the average U.S. master bedroom.
The move came as Knoblauch, who works in inmate rehabilitation, pondered her impending retirement. “I started thinking about what I was passionate about,” she said. “I wanted to see opera in Europe, to spend money on what was exciting to me.”
Her new apartment, which costs $575 a month — less than half the $1,400 average for a Seattle one-bedroom — puts her about 20 minutes from Symphony Hall by foot and a short bus ride from the Opera House. With new financial flexibility, she’s traveled to Germany and Ireland to see opera performances. “I’m loving it,” she says.
The burgeoning tiny house and micro-apartment movements, which generally describe accommodations smaller than about 400 sq. ft., are sometimes seen as young person’s trends, with budget- and environmentally conscious millennials and Gen Xers seeking to slash living costs while lessening their environmental footprints. Some familiar with the industry, however, say they are increasingly of interest to older people at or nearing retirement age.
About 10,000 people live in tiny houses in the U.S. — the Pacific Northwest, Colorado and the Carolinas are particularly popular areas — though just a fraction are older; many more people, especially those in expensive cities, live in micro-apartments, according to Ryan Mitchell, owner of the website TheTinyLife. Their numbers are growing, he says, as modifications that make the homes more accessible to older residents, such as staircases rather than ladders and designs that keep everything easily reachable, become more commonplace. Visit CentralPennContracting.com for more new trends.
While their appeal is varied, the principal attraction is price. Smaller homes can give seniors “more disposable income and the ability for many to comfortably survive within their Social Security means and/or part time work,” says consultant Erik Blair, a tiny house advocate. “The number one reason to get into a tiny house: You can save 70% or more of your recurring cost of living.” It is times like these when one needs to be completely aware of theor social security standing and the benefits that can be reaped out of it. The social security office exists for the same reason, where answers for any queries related to it are provided along with a host of services. Such offices have been dispersed widely across the States, and so, residents living in Michigan may redirect themselves to the Michigan Social Security Card office locations.
Why older Americans want to retire in tiny houses
For older Americans, many on fixed incomes that may not heavily supplement their Social Security, the cost of living is of utmost importance. Nearly 60% of workers 55 and older have saved less than $100,000 for retirement, while 24% have saved less than $1,000, according to the nonprofit Employee Benefit Research Institute. Both figures are much lower than financial advisers recommend.
Enter tiny houses, which are relatively inexpensive to build, buy and maintain. It usually costs between $10,000 and $100,000 to buy or build one, according to Blair; the average U.S. home costs nearly $200,000. Tiny apartments tend to cost much less than larger rental units in the same area.
In both cases, less space means lower utility payments: Mitchell, who lives in a 150 sq. ft. home, says his average monthly bills are around $20.
Less storage space, meanwhile, can reduce the impulse to acquire new stuff because, simply put, there’s nowhere to put it. “When I want to buy something, I have to think of what can I get rid of,” said Knoblauch. Often, “I realize I have everything I need already.”
“There are no big trips to Sam’s to get tubs of ketchup,” joked Kerri Fivecoat-Campbell, 52, who lives in a 480-square-foot home in the Ozark Mountains in Arkansas, where she plans to retire, after years in a larger house in suburban Kansas City, Kan. “They won’t fit.”
Money isn’t the only reason tiny houses and micro-apartments appeal to retirees. Many empty nesters long to downsize, surveys show, even if they can afford more space. With their children grown, extra rooms can attract clutter and require maintenance like plumbing that is rather costly thing (check out these causes of plumbing damage to prevent them); some, anticipating an eventual move to a nursing home, like the idea of simplifying early.
“I used to spend an entire Saturday cleaning my house,” said Fivecoat-Campbell. “Now I can clean it top-to-bottom in under two hours.”
For still others, the houses allow them to live near family while retaining their own space. So-called “granny cottages” can be placed in the yard of a family’s home, allowing residents to live both independently and close by. They’re often fitted with amenities useful to older residents, including grab bars, barrier-free showers and elevated toilets that can reduce falling risks, and wheelchair access.
‘I love this place — life works’
Tiny-house living isn’t without challenges. Knoblauch doesn’t have a full kitchen or bathtub; she has just one sink; and her clothes hang on a free-standing rack rather than in a closet. Fivecoat-Campbell wishes she had space for her now-deceased mother’s china cabinet and other full-size furniture.
Bigger and more expensive projects, rising new-home prices, curb appeal, and energy efficiency all contributed to a slight gain in remodeling projects’ payback at resale, the 2016 Cost vs. Value report shows.
The average cost and average return at resale for the 30 projects in this year’s report resulted in an average of 64.4% of a project’s investment dollars getting recouped if the home is sold within a year. That’s up from 62% in the 2015 report and the second-highest return in the past eight years.
This year’s 64.4% deserves an asterisk because the 2016 report eliminates eight projects from last year, including some with the weakest returns, while adding two projects, one of which—attic insulation—topped the list. But if you look only at the 17 projects we’ve tracked since 2005, the results are similar.
For those 17, the average value recouped was 63.7%, up from 62.1% in the 2015 report and the second-best year in the past six. When you look at cost alone, regardless of whether you’re talking about the 17 perennials or all 28 projects that were in the 2015 and 2016 reports, the result was the same: The average project cost 4.7% more this year. But when you ask real estate professionals for their view of how much that project boosted a home’s value at resale within a year, the results varied according to which projects you included. For the 28 jobs tracked both years, real estate professionals estimated the average project’s dollar return was 6.7% higher in the latest report than in 2015. For just the 17 perennials, the gain in value was 7.3%.
Those differences give only a first sense of why Cost vs. Value isn’t so much a portrait of America’s remodeling industry as it is a kaleidoscope—one in which the view of our remodeling industry changes every time you turn the data wheel.
Because costs change independently from real estate pros’ assessment of value (and for our 17 perennial projects, they’ve moved in different directions six of the past 10 years), each year the resulting cost-value ratio will have a different reason for why it changed. This ratio expresses resale value as a percentage of construction cost: When cost is higher than value, the ratio is less than 100%; when value is higher than cost, the ratio exceeds 100%. It’s the “bang-for-the-buck” meter.
In last year’s report, the overall cost-value ratio went down from the previous year because valuations were cut on about half of the 36 projects. This time, the average return went up largely because real estate professionals were more optimistic, lowering their estimates of resale value on only five of the 30 projects surveyed.