Zillow’s stock plunged as much as 20% late Tuesday after the company warnedthat revenue this quarter would fall short of Wall Street expectations, exacerbating investor concerns about the prospects of online real-estate startups like Zillow and Redfin as the U.S. housing market is starting to slow down.
The news caused Zillow’s stock to fall as low as $32.40 a share in after-hours trading, or 20% below its official closing price of $41.04 a share. Redfin, another online real-estate company, fell as much as 6.5% in aftermarket trading.
After nearly a decade of recovery and slow growth, the U.S. housing market has been heading into a slowdown in 2018. Not only are mortgage rates rising, but housing prices have been climbing about twice as fast as average incomes. Sales of new homes as well as previously owned homes have been slowing from a year ago. Tax reform enacted late last year has also reduced tax incentives to buy homes.
Those trends have hurt the stock performance of Zillow and Redfin alike. At its low point late Tuesday, Zillow was down 51% from its 52-week high, while Redfin was down 53% from its high point in the past year.
Zillow started out as an online real-estate listings service that, once successful, began to seek out new business models. Like Redfin, it moved into buying and selling homes. In May, Zillow’s stock plunged on news that it would start buying and quickly flipping homes for resale. In August, its stock plunged on again on news it was buying an online-mortgage lender, Mortgage Lenders of America. Both represent traditionally risky markets that Zillow believed would pay off in the long term.
“Zillow Group is undergoing a period of transformational innovation,” Zillow CEO Spencer Rascoff said in the company’s earnings release. “We believe that these changes will have positive long-term effects for consumers, our industry partners and our business. It will take time for advertisers to adapt to these changes, but we are confident that they set us up for long-term growth.”
During that expansion, however, Zillow and Redfin have had to face dual headwinds in rising interest rates, which can deter home purchases, and in slowing home purchases.
While Zillow’s move into adjacent markets may hold some long-term promise, investors are concerned about their short-term outlook. “Zillow was in fantastic shape just six months ago,” CNBC’s Jim Cramer said last month. “We loved their attempts to corner the real estate advertising market. Then they decided to move into a totally new, totally risky business at what may be the worst possible time, and the stock has since cratered.”
New research by Freddie Mac Multifamily finds a large and growing segment of renters continue to believe renting is a more affordable option than owning, even as many of those same renters are feeling the squeeze of rising housing costs. The latest “Profile of Today’s Renter” reveals that all generations of renters continue to perceive renting as the more affordable housing choice and remain satisfied with their current situation.
According to the survey pdf, 78 percent of renters believe renting is more affordable than owning – up a stunning 11 points from just six months ago in February 2018. This is the case even as the majority of renters (66 percent) reported difficulty affording their rent at some point over the past two years. The survey found nearly 9 in 10 renters employed in the essential workforce, such as healthcare and education, had significant difficulty affording the rent over the past two years.
Affordability of Renting
While perceptions of affordability over owning increased by 11 points to 78 percent among all renters, the survey found this was evident across generations. In fact, millennials (up 14 points to 75 percent), Generation Xers (up 11 points to 70 percent) and baby boomers (up eight points to 81 percent) all saw marked increases in the perception that renting is more affordable than owning.
Rising Cost of Renting
The survey also indicates that a significant number or renters – 66 percent – reported having trouble affording their monthly rent in the last two years – significantly more than the 43 percent of homeowners who experienced similar difficulties. More than half of renters say these changes affected spending on food, utilities and other essentials (51 percent) – as well as savings (50 percent) and nonessential items (64 percent). For renters living in rural areas, the impacts were particularly stark, with 77 percent spending less on essential items versus 59 percent in urban and suburban areas. While a majority of renters across generations reported these difficulties, older millennials (aged 28-37) reported the greatest hardship, with 79 percent reporting trouble affording rent over the past two years.
As noted earlier, renters employed in the essential workforce – such as the healthcare and education sectors – had significant additional difficulty affording rent, with a staggering 88 percent reporting hardship affording rent over the past two years. This is compared with 65 percent of all other workforce renters and 61 percent of homeowners in the essential workforce. Approximately half (48 percent) of renters working in essential jobs believe it is difficult to find housing that is affordable close to where they work – compared to 39 percent of homeowners in the essential workforce.
Rental Satisfaction
A consistent number of renters – 63 percent – continue to express their satisfaction with their rental experience. In fact, 58 percent of renters believe that renting is a good choice for them now and do not have plans to buy a home at this time – up from 54 percent in February. Over the last three years there has been a gradual increase in the number of renters who are not interested in buying. This quarter shows a small increase in this trend, with 23 percent of renters reporting they have no interest in buying a home – up from 20 percent in February. In addition, 42 percent of baby boomers have expressed no interest in owning a home.
A total of 66 percent of renters plan to continue renting for their next residence – up 11 points from February. Consistent with this view, fewer renters (41 percent) believe buying a home will be equally or more affordable in the next 12 months – down from 46 percent in February.
Survey Methodology
Freddie Mac’s custom renter research is based on a survey conducted online between August 13-15 among 4,040 adults aged 18 and over, including 1,059 renters, by Harris Poll, on behalf of Freddie Mac, via its QuickQuery omnibus product. The previous survey was conducted between January 30-February 1, 2018 among 4,115 adults and 1,209 renters using the same methodology.
Westchester residents, many trying to avoid the hefty tax bill that 2018 promises, are finding themselves in an unforgiving buyers’ market.
In Scarsdale alone, prices dipped 5 percent in the first six months of 2018, while Mamaroneck saw a 13 percent drop, according to Bloomberg. The number of homes selling in the county fell 18 percent in the second quarter of 2018, with those asking between $1.5 million to $3 million faring the worst.
The major push factor for sellers to plow ahead despite plummeting prices is the GOP’s new tax law which slapped a $10,000 cap on state and local property tax deductions, which means homeowners in areas like Westchester, where property taxes can run up to $50,0000, are feeling a serious crunch.
As a result, the number of homes for sale in Westchester has been increasing: in late June, inventory was up 5 percent compared to last year and, for homes priced between $2-2.5 million, listings were up 26 percent.
Buyers are feeling no sympathy for homeowners who bet on turning a neat profit when they decided to sell off their prestige address. Compass broker Angela Retelny says her clients tell her “‘Look, I’m not going to spend more than $35,000 in taxes.’ … Houses are just being dismissed, even though they’re superior homes, and they have to be reduced — because their taxes are just way too high for the price range.”
With buyers taking a hard line, sellers are being forced to bend, according to her. There are “dramatic price reductions every single day — every hour, pretty much,” she told Bloomberg.
Yorktown Heights property attorney Matthew Roach recalled one client who sold his home of 25 years immediately after the GOP’s tax law was passed. His home had property taxes over $50,000 and he was planning to move to Brooklyn, pay $10,000 in rent and never buy another home.
Hurricane Sandy, possibly the most publicized weather event in memory, has dissipated. But remodelers whose businesses lay in its path are likely to recall it for a long time to come. Their experience may also prove instructive: Sandy, climate scientists point out, likely offers a foretaste of things to come, as severe storms, tornadoes, and other freakish weather events begin to occur more often.
Many remodelers in Sandy’s path responded to the storm rather than just locking their doors and waiting for the maelstrom to pass like other businesses did. “We want to be the only company [homeowners] think of when they need to call a remodeler,” says Matt LeFaivre, president of LeFaivre Construction, in Taneytown, Md.
Here are some lessons passed on by owners of those companies:
1) Secure the jobs you’re currently working on: A crew from LeFaivre Construction spent six hours closing up an open wall adjacent to the location of the stick-built sunroom it was about to build. Some companies postponed jobs about to start. Dutchess Building Specialists, in Poughkeepsie, N.Y., postponed removing a roof that was set to come off prior to building a two-story addition, its president Brian Altmann says, and brought in three extra people to get a shingle roofing job wrapped up the Friday before the storm hit.
2) Safeguard buildings and their contents: Obvious measures include covering windows with plywood against glass-shattering debris. But what about rising water? If it’s at all a possibility, clear floors. The foot of seawater that entered Pardini Construction, a mile and a half from the beach in Long Branch, N.J., would have caused far more destruction had electronics and files not been removed, according to sales manager David Brown. And don’t forget data. In addition to regularly backing up computer files, Matt LeFaivre made two separate copies of hard drive contents and stored these at off-site locations. Know how you can Secure you homes here.
3) Take care of your own: In the days before Sandy struck and devastated Long Island, Alure Home Improvement held an “emergency response meeting” to, in the words of its president Sal Ferro, determine “how we support clients, family, friends, and employees immediately after.” Make employees your first concern. If their homes are damaged or they are concerned about damage, they probably, in any case, won’t be part of your emergency response effort for clients. Have a plan and make everyone part of it. Episcopo Brothers, in Summit, N.J., “let everyone know they had to be available for the next two weeks,” says co-owner Joe Episcopo.
4) Decide what services to offer and prioritize requests: In areas slammed by Sandy, homeowners contacting remodeling companies were mostly seeking repair of damaged exteriors, especially roofs. That ranged from “a few calls” at Dutchess Building Specialists to hundreds a day at companies in New Jersey and on Long Island. When Hurricane Isabel hit the Virginia coast in 2003, Criner Remodeling owner Robert Criner found himself so swamped with calls that he at first limited commitments to past customers, then past customers within 10 miles of the company’s offices, then to past customers within 5 miles of the company’s offices. Criner says he quickly realized he “can’t solve everybody’s problems.”
5) Reach out before, during, and after the storm: Gehman Custom Remodeling, in Harleysville, Pa., sent an email blast immediately following Hurricane Sandy, alerting its list that the company was available for repair work. Owner Dennis Gehman says that for taking care of its customers, “we gained a few more.” But if he had to do it again, “we’d do an email blast a day or two before” the storm letting people know “that our phones are on and we’ll respond as long as it’s safe to be out.”
6) Set up clear lines of communication: If land lines to your office go down, how will customers reach you? Episcopo & Sons posted owner and employee cell phone numbers on a landing page. But if your phone system and office staff aren’t set up for it and too many calls come in at the same time, you’ll lose some. Joe Percario, owner of Percario General Contractor, in Roselle, N.J., estimates he received at least 350 calls via cell phone during the first day of Sandy. If he was going to do it again, Percario says, he’d hire an answering service to forward all calls as text messages or email, to ensure that all calls are responded to and that contact information is captured.
7) Prepare to be without fuel and power: In New Jersey and parts of New York, gas stations had no power and fuel trucks were delayed. Episcopo & Sons managed the problem by purchasing 300 gallons of gas and 200 gallons of diesel before Sandy hit. Meanwhile, many companies struggled to work around partial or total power failure. Percario says that if he knew he was going to go through a Sandy-type storm again he’d equip his office with an industrial generator similar to the Honda 9,000-watt industrial generator (price $5,400) he used at home.
8) Stock the equipment and material you’ll need for the work you’ll do:Alure’s Ferro says that his ideas about how to manage an emergency situation evolved “from the day before Sandy to the day after to today.” Among other things, he says, his company would have more remediation equipment on hand. List the products you need, including tarps, chain saws, dewatering pumps, fans, and dehumidifiers. You can lease some of these, but it’s good to get your name in at the company where you lease equipment well before the demand really starts.
9) Know the experts to call: A tree hits a roof and the homeowner calls a day later wanting you to replace the shattered rafters and rebuild walls and floors. But you can’t get started before removing the tree. Tree removal specialists do that. (No, they don’t have to be licensed.) Relationships with such local service providers are essential. LeFaivre Construction, for instance, typically refers clients to one of two local tree removal companies. If clients call and get no response, president Matt LeFaivre calls the tree companies personally.
10) Assess whether you’re set up to handle insurance work: Flooded basements, smashed roofs, yards strewn with downed trees … How will you bill for the repair work you do? Criner says that he opted to submit an estimate with a fixed price rather than billing hourly. He advises that homeowners need to be aware that their insurance may not cover the total cost of all work. With major damage repairs, you’ll probably be dealing with insurance adjusters. It’s a good idea to get someone on your staff trained in how to do that — and expect clients for repair or storm damage work to be in a somewhat different frame of mind than clients for a new kitchen.
Tom Brokaw and 43 South Bedford Road (Credit: Getty Images and Ginnel Real Estate)
Newscaster Tom Brokaw’s 56-acre estate in Pound Ridge, N.Y., has hit the market, asking $6.3 million.
The family compound, which sits on the edge of a private lake, includes a 4,000-square-foot main house, plus a pool house and caretaker’s cottage. The NBC legend bought the estate at 43 South Bedford Road his wife, Meredith Auld, for around $4.25 million in 1998, according to property records.
43 South Bedford Road (Credit: Ginnel Real Estate)
Located about 50 miles north of Manhattan, the property has ample hiking trails and a swimming pool that’s steps from the lake. The compound also includes two fully-approved subdivisions that could accommodate two additional houses.
“This is an exceptional retreat,” said Brown Harris Stevens‘ Kathy Sloane, who has a co-exclusive with Westchester agent Muffin Dowdle of Ginnel Real Estate.
43 South Bedford Road (Credit: Ginnel Real Estate)
According to the listing, the stucco-and-shingle house has four bedrooms and six baths, as well as a great room with a vaulted ceiling.
“The dining room and living room — as well as the master bedroom and several guest rooms — have beautiful views of the lake, which is the central focus of the property,” Sloane said.
43 South Bedford Road (Credit: Ginnel Real Estate)
Brokaw and Auld, who are longtime Manhattan residents, also own a ranch in Montana that’s on the market for $17.9 million.
Brokaw was accused in April of sexually harassing two women. He has adamantly denied the allegations.
Hurricane Maria exacerbated problems for Puerto Rico’s already-struggling real estate market — creating opportunities and pitfalls alike for would-be home buyers.
The storm, which devastated much of the Caribbean last fall, caused home prices to drop 15%, to an average median home price of $116,750, according a recent report from real-estate website Point2 Homes. In some areas though, the storm left the housing market in even more dire straits.
In the town of Humacao, the median home price fell from $250,000 in 2016 to just $97,250 as of March. A similar situation can be seen in other popular parts of the territory, including the capital of San Juan, where prices have dropped nearly 50% over the past two years.
“With the devastation there, it’s going to take as long as the recovery from the Great Recession or possibly even longer for a market like that to recover,” said Daren Blomquist, senior vice president at real-estate data provider Attom Data Solutions.
Home prices could very well continue to track downward across Puerto Rico in the months, or even years, to come. A major natural disaster like Hurricane Maria can trigger a vicious cycle in a housing market that depresses prices, Blomquist said.
Homeowners may find it difficult to afford monthly mortgage payments. Meanwhile, other owners may sell their homes to escape the disaster-stricken area. Those homes, combined with the foreclosed properties, drive home prices down.
Puerto Rico is already well into this cycle: Hurricane Maria resulted in an extra 57,000 mortgages going into delinquency, according to a February report from real-estate data provider Black Knight.
Some housing markets fare this cycle better and recover more quickly. The housing market in Houston took a hit following the flooding produced by Hurricane Harvey last August, but the market has already rebounded, said Danielle Hale, chief economist with Realtor.com.
Why low prices might be here to stay in Puerto Rico
Puerto Rico’s recovery from Maria will look a lot different from Houston’s post-Harvey rebound. Prior to the storm, Houston had a thriving local economy — and it still does, adding 84,500 jobs between April 2017 and April 2018, according to the Bureau of Labor Statistics.
Puerto Rico, meanwhile, was suffering from a major economic crisis that had already caused home prices to fall as residents moved elsewhere in search of better opportunities. “We weren’t looking at a very resilient market before the hurricane,” Hale said.
Indeed, investors were gobbling up swaths of Puerto Rican real estate and distressed mortgages before the storm. Now, it’s unclear if these low prices will attract enough interest from investors. “There is going to be some patience involved on the part of the buyer,” Blomquist said.
There are other factors holding back house prices and sales activity as a result of the island’s financial crisis. Owner-occupants may encounter more difficulty getting a home loan, said James Westfall, broker and owner of Island West Properties, a real estate firm located in Rincon, a town on Puerto Rico’s western coast. “The banks are now a little more hesitant to pull the trigger,” Westfall said.
Buyers need to know what they’re getting into
Not every part of Puerto Rico is facing the same difficulties. The median home price in Rincon, in the western part of the island, fell 4.3% between 2016 and 2018, according to Point2 Homes.
Rincon is known for its surfing and the local economy benefits from the resulting tourist industry, Westfall said. “Investors may be more comfortable going into a town that has that kind of mix,” Westfall said.
Wherever the home is, a prospective buyer should take insurance into account when in the buying process. There are still big challenges to take into account. The cost of insurance in disaster-stricken Puerto Rico could rise, which would offset any dip in pre-hurricane prices.
For New York City apartment hunters, April was another good month to find a deal on rents. But no one fared better than those in northwest Queens.
Rents there dropped 12 percent from a year earlier, to a median of $2,646 a month after landlord giveaways were subtracted, according to a report Thursday by appraiser Miller Samuel Inc. and brokerage Douglas Elliman Real Estate. Those giveaways were offered on 65 percent of all new leases signed in the area, excluding renewals, a record share in data going back to the beginning of 2016.
The enticements brought in more renters. New leases in northwest Queens — Long Island City, Astoria, Sunnyside and Woodside — jumped 11 percent to 272, the firms said.
“More customers who were originally looking in Manhattan and Brooklyn are considering Queens,” said Hal Gavzie, Douglas Elliman’s executive manager of leasing. “It used to be just 100 percent a different consumer.”
Take the 7 Train
A glut of apartment supply is pushing rents down in New York City, with northwest Queens plunging 12% in April.
New York City tenants are crossing borders to compare deals in a market groaning under the weight of new supply. Landlords, who’ve accepted they need to compete to keep their units filled, are working to attract new tenants and offering sweeter renewal terms to keep the ones they have, Gavzie said. In Manhattan, 44 percent of all new leases came with a landlord concession, such as a free month of rent or payment of broker fees. In Brooklyn, the share was 51 percent, a record for the borough.
Still, the number of new leases in Manhattan and Brooklyn fell 3.5 percent and 1.6 percent, respectively, a sign that renters there found good reason to stay in their current apartments, Gavzie said.
“Tenants negotiating a renewal, they’ve looked around to see what deals they can get,” he said. “So their landlord gives them a sweet offer to stay.”
Manhattan rents in April, after subtracting concessions, fell 2.2 percent, to a median of $3,236, the fifth consecutive month of year-over-year declines. In Brooklyn, where rents have also fallen for five months, the decline was 2.9 percent, to a median of $2,686.
For Queens, the report tracks only the northwest, the part of the borough nearest Manhattan.
Tax season can be stressful for the millions of Americans who owe money to Uncle Sam. Every year, the average U.S. household pays more than $5,700 in federal income taxes, according to the Bureau of Labor Statistics. And while we’re all faced with that same obligation, there is significant difference when it comes to state and local taxes. Taxpayers in the most tax-expensive states, for instance, pay three times more than those in the cheapest states.
Surprisingly, though, low income taxes don’t always mean low taxes as a whole. For example, while the state of Washington’s citizens don’t pay income tax, they still end up spending over 8% of their annual income on sales and excise taxes. Texas residents also don’t pay income tax, but spend 1.86% of their income on real estate taxes, one of the highest rates in the country. Compare these to California, where residents owe a little over 4% of their income in sales and excise taxes, and just 0.79% in real estate tax.
As this year’s tax-filing deadline, April 17, comes closer, it’s fair to wonder which states give their taxpayers more of a break. WalletHub searched for answers by comparing state and local tax rates in the 50 states and the District of Columbia against national medians. To illustrate, we calculated relative income-tax obligations by applying the effective income-tax rates in each state and locality to the average American’s income. Scroll down for the complete ranking, commentary from a panel of tax experts and a full description of our methodology.
Effective Total State & Local Tax Rates on Median U.S. Household*
Annual State & Local Taxes on Median U.S. Household*
% Difference Between State & U.S. Avg.**
Annual State & Local Taxes on Median State Household***
Adjusted Overall Rank (based on Cost of Living Index)
1
Alaska
5.67%
$3,164
-47.26%
$4,353
5
2
Delaware
6.11%
$3,407
-43.21%
$3,909
1
3
Montana
7.29%
$4,066
-32.23%
$3,911
4
4
Nevada
7.44%
$4,145
-30.90%
$4,103
6
5
Wyoming
7.45%
$4,155
-30.75%
$4,417
2
6
Tennessee
7.98%
$4,449
-25.84%
$3,667
3
7
Idaho
8.48%
$4,730
-21.16%
$4,216
7
8
California
8.77%
$4,888
-18.51%
$7,167
36
9
Florida
8.83%
$4,921
-17.97%
$4,373
9
10
South Carolina
9.02%
$5,030
-16.16%
$4,278
11
11
Oregon
9.20%
$5,129
-14.51%
$5,677
34
12
Utah
9.23%
$5,144
-14.25%
$5,902
10
13
Colorado
9.27%
$5,170
-13.82%
$6,100
13
14
Alabama
9.40%
$5,241
-12.64%
$4,177
8
15
Arizona
9.50%
$5,299
-11.67%
$4,977
12
16
South Dakota
9.75%
$5,439
-9.34%
$4,757
16
17
North Dakota
9.84%
$5,488
-8.53%
$5,493
18
18
District of Columbia
10.00%
$5,574
-7.09%
$8,811
46
19
New Hampshire
10.27%
$5,725
-4.57%
$7,221
33
20
Hawaii
10.33%
$5,762
-3.96%
$8,277
51
21
West Virginia
10.39%
$5,791
-3.48%
$4,343
19
22
Louisiana
10.39%
$5,795
-3.41%
$4,757
17
23
Georgia
10.54%
$5,876
-2.06%
$5,237
14
24
North Carolina
10.64%
$5,934
-1.09%
$5,167
20
25
Oklahoma
10.75%
$5,993
-0.11%
$4,848
15
26
New Mexico
10.82%
$6,031
0.53%
$5,038
23
27
Virginia
10.87%
$6,061
1.03%
$7,276
27
28
Texas
11.04%
$6,156
2.61%
$5,347
21
29
Vermont
11.04%
$6,158
2.64%
$6,800
41
30
Missouri
11.28%
$6,291
4.86%
$5,435
22
31
Minnesota
11.57%
$6,453
7.56%
$7,085
31
32
Massachusetts
11.61%
$6,470
7.85%
$9,390
45
33
Washington
11.68%
$6,514
8.57%
$8,023
37
34
Maine
11.75%
$6,554
9.24%
$6,133
42
35
Indiana
11.86%
$6,614
10.25%
$5,667
26
36
Maryland
11.96%
$6,666
11.12%
$9,552
44
37
Kentucky
12.06%
$6,723
12.06%
$5,293
29
38
Mississippi
12.21%
$6,810
13.51%
$4,954
24
39
Arkansas
12.30%
$6,858
14.32%
$5,142
25
40
Kansas
12.42%
$6,924
15.41%
$6,104
28
41
Pennsylvania
12.45%
$6,940
15.68%
$6,642
38
42
Michigan
12.81%
$7,145
19.09%
$5,843
30
43
New Jersey
12.87%
$7,175
19.59%
$11,237
47
44
Iowa
12.92%
$7,202
20.05%
$6,354
32
45
Ohio
13.09%
$7,300
21.68%
$6,081
35
46
Wisconsin
13.62%
$7,593
26.56%
$7,193
40
47
Rhode Island
13.69%
$7,634
27.26%
$8,697
48
48
New York
13.72%
$7,648
27.49%
$9,759
50
49
Nebraska
13.83%
$7,712
28.55%
$6,776
39
50
Connecticut
13.85%
$7,720
28.68%
$10,419
49
51
Illinois
14.89%
$8,299
38.34%
$8,330
43
*Assumes “Median U.S. Household” has an annual income of $55,754 (mean third quintile U.S. income); owns a home valued at $184,700 (median U.S. home value); owns a car valued at $24,000 (the highest-selling car of 2017); and spends annually an amount equal to the spending of a household earning the median U.S. income. **National Average of State and Local Tax Rates = 10.78% ***Assumes “Median State Household” has an annual income equal to the mean third quintile income of the state; owns a home at a value equal to the median of the state; owns a car valued at $24,000 (the highest-selling car of 2017); and spends annually an amount equal to the spending of a household earning the median state income.
Red States vs. Blue States
State & Local Tax Breakdown
All effective tax rates shown below were calculated as a percentage of the mean third quintile U.S. income of $55,754 and based on the characteristics of the Median U.S. Household*.
State
Effective Real-Estate Tax Rate
Real-Estate Tax Rank ($)
Effective Vehicle Property Tax Rate
Vehicle Property Tax Rank ($)
Effective Income Tax Rate
Income Tax Rank ($)
Effective Sales & Excise Tax Rate
Sales & Excise Tax Rank ($)
Effective Total State & Local Tax Rates on Median U.S. Household*
Alabama
1.42%
2 ($791)
0.29%
28 ($163)
2.68%
28 ($1,494)
5.01%
39 ($2,793)
9.40%
Alaska
3.93%
33 ($2,190)
0.00%
1 ($0)
0.10%
6 ($56)
1.65%
4 ($918)
5.67%
Arizona
2.56%
16 ($1,427)
0.72%
38 ($403)
1.57%
13 ($873)
4.66%
35 ($2,595)
9.50%
Arkansas
2.08%
10 ($1,161)
0.43%
29 ($239)
2.66%
27 ($1,483)
7.13%
50 ($3,975)
12.30%
California
2.62%
17 ($1,461)
0.28%
27 ($156)
1.40%
11 ($781)
4.47%
30 ($2,491)
8.77%
Colorado
1.90%
7 ($1,058)
0.77%
40 ($428)
2.54%
25 ($1,414)
4.07%
24 ($2,269)
9.27%
Connecticut
6.70%
48 ($3,733)
1.09%
47 ($609)
2.25%
19 ($1,255)
3.81%
18 ($2,123)
13.85%
Delaware
1.81%
4 ($1,009)
0.00%
1 ($0)
3.03%
33 ($1,689)
1.27%
3 ($708)
6.11%
District of Columbia
1.84%
5 ($1,026)
0.00%
1 ($0)
3.72%
46 ($2,072)
4.44%
28 ($2,475)
10.00%
Florida
3.38%
27 ($1,885)
0.00%
1 ($0)
0.00%
1 ($0)
5.45%
44 ($3,037)
8.83%
Georgia
3.07%
25 ($1,712)
0.00%
1 ($0)
3.17%
35 ($1,768)
4.30%
26 ($2,396)
10.54%
Hawaii
0.90%
1 ($501)
0.00%
1 ($0)
3.85%
47 ($2,147)
5.59%
46 ($3,115)
10.33%
Idaho
2.52%
13 ($1,404)
0.00%
1 ($0)
2.13%
16 ($1,185)
3.84%
20 ($2,141)
8.48%
Illinois
7.69%
50 ($4,288)
0.00%
1 ($0)
2.82%
30 ($1,572)
4.37%
27 ($2,439)
14.89%
Indiana
2.88%
23 ($1,606)
0.54%
33 ($300)
3.71%
45 ($2,068)
4.73%
36 ($2,640)
11.86%
Iowa
4.95%
38 ($2,762)
0.43%
30 ($240)
3.03%
34 ($1,691)
4.50%
31 ($2,509)
12.92%
Kansas
4.63%
37 ($2,580)
0.89%
43 ($495)
1.78%
15 ($994)
5.12%
40 ($2,855)
12.42%
Kentucky
2.83%
21 ($1,579)
0.52%
31 ($292)
4.87%
51 ($2,716)
3.83%
19 ($2,135)
12.06%
Louisiana
1.68%
3 ($934)
0.04%
25 ($24)
2.17%
18 ($1,212)
6.50%
49 ($3,624)
10.39%
Maine
4.38%
35 ($2,444)
1.03%
45 ($576)
2.54%
26 ($1,416)
3.80%
17 ($2,117)
11.75%
Maryland
3.64%
31 ($2,030)
0.00%
1 ($0)
4.30%
49 ($2,395)
4.02%
23 ($2,241)
11.96%
Massachusetts
4.01%
34 ($2,238)
0.97%
44 ($540)
3.67%
44 ($2,046)
2.95%
6 ($1,646)
11.61%
Michigan
5.66%
43 ($3,158)
0.25%
26 ($142)
3.32%
37 ($1,850)
3.58%
11 ($1,995)
12.81%
Minnesota
3.86%
32 ($2,155)
0.56%
35 ($311)
2.94%
32 ($1,640)
4.21%
25 ($2,347)
11.57%
Mississippi
2.64%
19 ($1,470)
1.46%
49 ($813)
2.34%
21 ($1,303)
5.78%
47 ($3,224)
12.21%
Missouri
3.30%
26 ($1,842)
1.08%
46 ($600)
2.91%
31 ($1,625)
3.99%
22 ($2,224)
11.28%
Montana
2.82%
20 ($1,570)
0.55%
34 ($307)
2.76%
29 ($1,541)
1.16%
2 ($646)
7.29%
Nebraska
6.05%
45 ($3,371)
0.69%
36 ($383)
2.53%
24 ($1,410)
4.57%
32 ($2,548)
13.83%
Nevada
2.56%
15 ($1,425)
0.76%
39 ($423)
0.53%
8 ($295)
3.59%
12 ($2,002)
7.44%
New Hampshire
7.24%
49 ($4,038)
0.77%
41 ($432)
0.60%
9 ($335)
1.65%
5 ($920)
10.27%
New Jersey
7.96%
51 ($4,437)
0.00%
1 ($0)
1.40%
11 ($781)
3.51%
9 ($1,957)
12.87%
New Mexico
2.53%
14 ($1,408)
0.00%
1 ($0)
2.16%
17 ($1,204)
6.13%
48 ($3,419)
10.82%
New York
5.48%
42 ($3,057)
0.00%
1 ($0)
3.49%
40 ($1,945)
4.75%
37 ($2,647)
13.72%
North Carolina
2.84%
22 ($1,581)
0.54%
32 ($299)
3.62%
43 ($2,018)
3.65%
15 ($2,035)
10.64%
North Dakota
3.49%
28 ($1,947)
0.00%
1 ($0)
0.78%
10 ($432)
5.58%
45 ($3,108)
9.84%
Ohio
5.18%
40 ($2,890)
0.00%
1 ($0)
3.34%
38 ($1,862)
4.57%
33 ($2,548)
13.09%
Oklahoma
2.94%
24 ($1,638)
0.00%
1 ($0)
2.44%
23 ($1,360)
5.37%
42 ($2,994)
10.75%
Oregon
3.53%
30 ($1,970)
0.00%
1 ($0)
4.74%
50 ($2,640)
0.93%
1 ($519)
9.20%
Pennsylvania
5.14%
39 ($2,867)
0.00%
1 ($0)
3.90%
48 ($2,174)
3.40%
8 ($1,898)
12.45%
Rhode Island
5.46%
41 ($3,047)
2.05%
51 ($1,144)
2.30%
20 ($1,282)
3.88%
21 ($2,162)
13.69%
South Carolina
1.89%
6 ($1,056)
1.17%
48 ($651)
2.35%
22 ($1,310)
3.61%
14 ($2,013)
9.02%
South Dakota
4.39%
36 ($2,446)
0.00%
1 ($0)
0.00%
1 ($0)
5.37%
41 ($2,992)
9.75%
Tennessee
2.47%
12 ($1,376)
0.00%
1 ($0)
0.10%
6 ($56)
5.41%
43 ($3,017)
7.98%
Texas
6.16%
46 ($3,435)
0.00%
1 ($0)
0.00%
1 ($0)
4.88%
38 ($2,720)
11.04%
Utah
2.22%
11 ($1,240)
0.00%
1 ($0)
3.35%
39 ($1,869)
3.65%
15 ($2,035)
9.23%
Vermont
5.89%
44 ($3,285)
0.00%
1 ($0)
1.61%
14 ($896)
3.55%
10 ($1,977)
11.04%
Virginia
2.63%
18 ($1,467)
1.74%
50 ($971)
3.49%
41 ($1,947)
3.00%
7 ($1,675)
10.87%
Washington
3.52%
29 ($1,962)
0.00%
1 ($0)
0.00%
1 ($0)
8.16%
51 ($4,552)
11.68%
West Virginia
1.94%
8 ($1,082)
0.71%
37 ($398)
3.29%
36 ($1,833)
4.44%
29 ($2,478)
10.39%
Wisconsin
6.46%
47 ($3,602)
0.00%
1 ($0)
3.56%
42 ($1,985)
3.60%
13 ($2,006)
13.62%
Wyoming
2.03%
9 ($1,130)
0.77%
41 ($432)
0.00%
1 ($0)
4.65%
34 ($2,593)
7.45%
*Assumes “Median U.S. Household” has an income equal to $55,754 (mean third quintile U.S. income); owns a home valued at $184,700 (median U.S. home value); owns a car valued at $24,000 (the highest-selling car of 2017); and spends annually an amount equal to the spending of a household earning the median U.S. income.
Ask the Experts: Best Tax Advice
For more insight into the impact state and local taxes have on migration and public policy, we turned to a panel of leading tax and policy experts. You can check out their bios and responses below.
Do people usually consider taxes when deciding where to live? Should they?
How can state and local tax policy be used to attract new residents and stimulate growth?
Which states have particularly complicated tax rules for families?
How has the total amount families pay in state and local taxes changed as a result of the new tax code?
Which states have the best mix of taxes and government services?
Should people pay taxes based on where they live or where they work?
Federal Reserve officials, meeting for the first time under Chairman Jerome Powell, raised the benchmark lending rate a quarter-point and forecast a steeper path of hikes in 2019 and 2020, citing an improving economic outlook. Policy makers continued to project a total of three increases this year.
“The economic outlook has strengthened in recent months,” the policy-setting Federal Open Market Committee said in a statement Wednesday in Washington. Officials repeated previous language that they anticipate “further gradual adjustments in the stance of monetary policy.”
The upward revision in their rate path suggests Fed officials are looking through soft first-quarter economic reports and expect a lift this year and next from tax cuts passed by Republicans in December. Financial conditions have tightened since late January as investors look for signs that the central bank might raise rates at a faster pace, while forecasters predict stronger U.S. growth and tight labor markets.
The vote to lift the federal funds rate target range to 1.5 percent to 1.75 percent was a unanimous 8-0.
The latest set of quarterly forecasts forecasts showed that policy makers were divided over the outlook for the benchmark interest rate in 2018. Seven officials projected at least four quarter-point hikes would be appropriate this year, while eight expected three or fewer increases to be warranted.
In the forecasts, U.S. central bankers projected a median federal funds rate of 2.9 percent by the end of 2019, implying three rate increases next year, compared with two 2019 moves seen in the last round of forecasts in December. They saw rates at 3.4 percent in 2020, up from 3.1 percent in December, according to the median estimate.
Inflation Pickup
In another change to the statement, the Fed said inflation on an annual basis is “expected to move up in coming months,” after saying “move up this year” in the January statement. Price gains are still expected to stabilize around the Fed’s 2 percent target over the medium term, the FOMC said.
The central bank’s preferred price gauge rose 1.7 percent in the 12 months through January and officials projected it to rise to 2 percent in 2019 and hit 2.1 percent the following year, the latest estimates showed. The estimates for inflation excluding food and energy, which officials see as a better way to gauge underlying price trends, rose to 2.1 percent in 2019 and 2020 from 2 percent seen in December.
“Job gains have been strong in recent months, and the unemployment rate has stayed low,” the FOMC said. The statement said that household spending and business investment “have moderated” from strong fourth-quarter readings.
The statement also repeated previous language that “near-term risks to the economic outlook appear roughly balanced.”
Powell will hold his first post-FOMC press conference at 2:30 p.m. local time.
Supply, Demand
The Fed’s goal is to keep supply and demand in balance in the economy amid a tight labor market, without lifting borrowing costs so quickly that the economy stalls.
Officials have had to factor in the impact of fiscal stimulus signed by President Donald Trump since their previous projections.
The median estimate for economic growth this year rose to 2.7 percent from 2.5 percent in December, signaling confidence in U.S. consumers despite recent weak readings on retail sales that have pushed down tracking estimates of first-quarter activity. The 2019 estimate rose to 2.4 percent from 2.1 percent.
The committee’s forecast for the long-run sustainable growth rate of the economy was unchanged at 1.8 percent, suggesting policy makers are still skeptical of the effect of tax cuts on the economy’s capacity for growth. The 2020 gross domestic product growth median projection was also unchanged at 2 percent.
While U.S. unemployment of 4.1 percent is the lowest since 2000, wage growth has remained moderate and inflation has been below the Fed’s target for most of the last five years.
The median projection for the long-run fed funds rate ticked up to 2.9 percent from 2.8 percent in December. The Fed had been gradually reducing its estimate of the long-run neutral fed funds rate since it began publishing its calculations in January 2012.
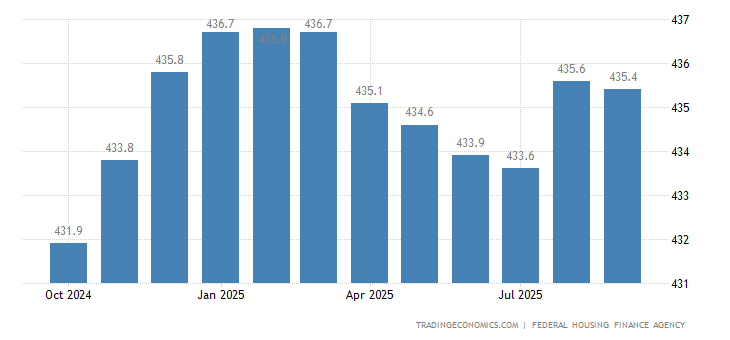
The average prices of single-family houses with mortgages guaranteed by Fannie Mae and Freddie Mac in the United States increased 0.3 percent month-over-month in December 2017, following an upwardly revised 0.5 percent gain in November and missing market expectations of 0.4 percent. Year-on-year, house prices went up 6.5 percent, the same pace as in the previous month. Housing Index in the United States averaged 0.29 percent from 1991 until 2017, reaching an all time high of 1.20 percent in January of 2000 and a record low of -1.80 percent in November of 2008.