Price of low-end rentals still outpacing higher-end homes
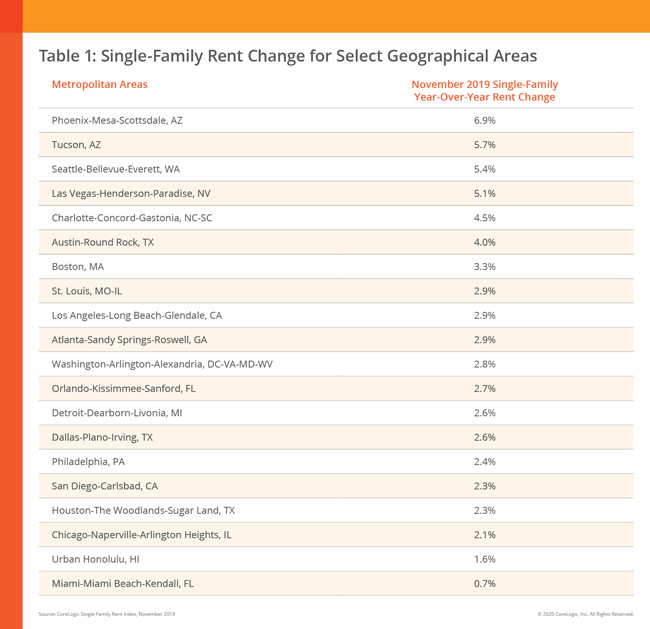
Single-family rent prices increased 3% in November 2019 over the same time period in the previous year, according to CoreLogic’s Single-Family Rent Index,
In October, low-end rent prices went up 3.6%, while high-end price gains rose 2.9%.
(Image courtesy of CoreLogic. Click to enlarge.)
Overall, year-over-year rent price increases have slowed down since February 2016. During this time, they peaked at 4.2%, and stabilized at around 3% since early last year.
November 2019 was the 67th month in a row that low-end rentals propped up national rent growth, the report said.
Low-end rental prices increased 3.6% year over year in November 2019, down slightly from November 2018’s rent gain of 3.8%.
High-end rentals increased 2.7% in November 2019, and the report says this remains unchanged from the previous year.
For the 12th month in a row, Phoenix has the highest year over year increase in single-family rent prices in November, at 6.9%. Neighboring town Tucson had the second-highest rent price growth, with gains of 5.7%.
Miami had the lowest rent increase in November, at 0.7%. Miami had the lowest amount of rent increase in October as well, at 1%, the same amount of increase it saw in September.
For October, Phoenix was the market that saw the highest uptick in rent, with the highest year over year increase in single-family rents at 6.8%, according to CoreLogic.
“Strong rent growth in the Southwest reflects strong population growth in this part of the U.S.,” said Molly Boesel, principal economist at CoreLogic. “Arizona ranked third for population growth in 2019 by both number and percentage increase, according to the U.S. Census Bureau. In contrast, Illinois and Hawaii both had a decrease in population in 2019, which could account for the slower rent growth in these regions.”
Freddie Mac (OTCQB: FMCC) today released the results of its Primary Mortgage Market Survey® (PMMS®), showing that the 30-year fixed-rate mortgage (FRM) averaged 3.72 percent.
“The combination of improved economic data and market sentiment has led to stability in mortgage rates, which have hovered around 3.7 percent for nearly the last two months,” said Sam Khater, Freddie Mac’s Chief Economist. “The stability is welcome news after the interest rate turbulence of the last year, which caused a slowdown in the housing market and other interest rate sensitive sectors. The low mortgage rate environment combined with the red-hot labor market is setting the stage for a continued rise in home sales and home prices.”
News Facts
30-year fixed-rate mortgage averaged 3.72 percent with an average 0.7 point for the week ending January 2, 2020, slightly down from last week when it averaged 3.74 percent. A year ago at this time, the 30-year FRM averaged 4.51 percent.
15-year fixed-rate mortgage averaged 3.16 percent with an average 0.7 point, down from last week when it averaged 3.19 percent. A year ago at this time, the 15-year FRM averaged 3.99 percent.
5-year Treasury-indexed hybrid adjustable-rate mortgage (ARM) averaged 3.46 percent with an average 0.3 point, slightly up from last week when it averaged 3.45 percent. A year ago at this time, the 5-year ARM averaged 3.98 percent.
Average commitment rates should be reported along with average fees and points to reflect the total upfront cost of obtaining the mortgage. Visit the following link for the Definitions. Borrowers may still pay closing costs which are not included in the survey.
U.S. new-home construction rose in October as single-family starts registered the strongest pace since the beginning of the year. The highest level of permits since 2007 shows healthy homebuilding ahead.
Residential starts advanced 3.8% to a 1.31 million annualized rate, in line with the median estimate in a Bloomberg survey of economists, after a revised 1.27 million pace in the prior month, according to Commerce Department figures released Tuesday. Permits, a proxy for future construction, rose 5% to a 1.46 million pace, the most since May 2007.
The starts data are in line with recent reports that indicate the housing market is improving. Lower mortgage rates are luring homebuyers who may have been on the fence, boosting optimism among developers and contributing to more construction.Single-family home starts increased 2% to 936,000 in October, the strongest reading since January, while permits for new construction of those dwellings climbed 3.2% to a 909,000 pace that was the fastest since August 2007.U.S. homebuilder sentiment ticked down in November after four consecutive months of gains, private data showed Monday as the outlook of builders in the South soured. The gauge remains elevated and optimism for sales over the next six months rose to the highest since May 2018. Groundbreakings for the multifamily category, which tends to be volatile and includes apartment buildings and condominiums, increased 8.6% while permits rose 8.2%. Data out later this week is forecast to show existing home sales, which make up the vast majority of home transactions in the U.S., increased in October from the prior month in a sign that the housing market continues apace. Also, new-home sales, which comprise about 10% of sales but are a timelier indicator, remained close to an almost 12-year high.
Three of four regions posted an increase in starts last month, led by a 17.6% surge in the West to the fastest pace since March 2018. Starts also rose in the Midwest and South. About 181,000 homes were authorized but not yet started, the most since March and indicating a growing backlog for builders.The report, produced jointly by the U.S. Census Bureau and the Department of Housing and Urban Development, has a wide margin of error.
Last month, the California Association of Realtorspredicted a slow down for the state’s housing market in 2020.
According to a recent report by CoreLogic, cooling home sales are already here. In fact, August marked the fewest home sales for that month in four years.
“California home sales edged moderately lower in August, marking the twelfth month out of the last 13 in which sales were lower than a year earlier as some would-be buyers remained priced out and others stayed on the sideline, hesitant to buy near a potential price peak,” the report stated.
CoreLogic estimated that during August about 42,440 new and existing houses and condos sold in California. That number is down 0.2% from the previous month and down 2.8% from August 2018. While the number of sales declined, so did the median home price in comparison to its June 2019 peak of $509,000.
According to CoreLogic, the median price paid for all new and existing houses and condos sold statewide this August was $499,000. While this price is down 0.2% from $500,000 in July 2019, it is up 1% from the previous August, when median prices sat at $494,000.
The report stated that home sale activity normally edges higher between July and August. As stated earlier, this August was the twelfth month out of the last 13 in which sales were lower than a year earlier. The only annual gain was seen in July this year, and CoreLogic is attributing that gain to lower mortgage rates.
“The significant drop in mortgage rates in recent months has helped stoke sales by enabling many buyers to purchase homes with at least modestly lower payments than they would have faced last year,” the report stated. “While California’s median sale price was up 1% year over year this August, the state’s ‘typical mortgage payment’ – the monthly principal and interest payment on the median-priced home – fell almost 11% because of a roughly 1 percentage point decline in mortgage rates over that 12-month period.”
California is one step away from enacting statewide rent control after the state’s two legislative bodies both approved the measure.
The bill will cap annual rent increases by 5%, including the rate of inflation. In addition to the rent cap, a bill known as AB-1482, the Tenant Protection Act of 2019, will allow “just cause” eviction policies to qualified housing in California.
The bill was approved this week by the California State Senate and the California State Assembly.
The bill now moves to the desk of California Gov. Gavin Newsom, who is expected to sign the bill into law.
When Newsom signs the bill, the bill would make the state one of the few in the nation with statewide rent control.
California, one of the nation’s priciest housing markets, is following Oregon’s footsteps in enacting rent control. In March, Oregon approved a law placing an annual limit on rent increases of 7% plus inflation.
The bill appears to have Newsom’s support, as the governor tweeted that “The rent is too damn high — so we’re damn sure doing something about it” and “Because there should be a cap on how much you pay for rent…Because your landlord shouldn’t be able to evict you for no reason.”
“In this year’s State of the State address, I asked the Legislature to send me a strong renter protection package. Today, they sent me the strongest package in America,” Newsom said in a statement after the Assembly passed the bill. “These anti-gouging and eviction protections will help families afford to keep a roof over their heads, and they will provide California with important new tools to combat our state’s broader housing and affordability crisis. I would like to thank Assembly Speaker Rendon, Senate President pro Tempore Atkins, Assembly member Chiu and the bill’s co-authors for passing this legislation, as well as the broad coalition of stakeholders whose persistence allowed this bill to move forward.”
The move is a reversal from what happened in the state nearly a year ago. In the November 2018 election, California voters shot down a previous rent control initiative, Proposition 10. The proposal would have to capped annual rent increases to prevent unjust evictions.
Proposition 10 was aimed to repeal the Costa-Hawkins Rental Housing Act. In 1995, California passed the Costa-Hawkins Rental Housing Act, limiting the use of rent control and prohibiting local governments from imposing caps on single-family homes and condos.
According to the California Secretary of State, 61.7% of voters were against repealing the Costa-Hawkins Rental Housing Act, while a mere 38.3% voted for it.
It’s easy to see that the little red house at 175 Grand Street in Mamaroneck, NY, is no ordinary home just by looking: At a mere 10 feet wide, the Skinny House stands out for its size alone. As 6sqft previously reported, this unique dwelling, listed on the National Register of Historic Places, has quite a tale to tell. The little house on a 12.5-foot lot was built in 1932 by Nathan T. Seely, one of New York’s first African American builders. Its story is one of ingenuity and skill, and it provided for its creator during hard times. In need of a new chapter and some real TLC, the house is on the market–for only the second time since its construction–for $275,000.
Seely and his brother had built a successful home-building business constructing houses throughout Mamaroneck, mainly catering to black Southerners who fled northward as part of the Great Migration. But the Great Depression crushed the business; Seely went bankrupt and lost his home.
Seely’s next-door neighbor, Panfino Santangelo, generously gave him a 12.5-foot by 100-foot strip of land in 1931; Seely put his considerable skills to work constructing the Skinny House using salvaged materials. A chicken coop was used as part of the living room; a center beam in the basement is a rusted railroad track; walls were constructed from paperboard hammered into wood scraps. When it was finished the home had everything you’d find in a much bigger dwelling including a cellar, a living room, a kitchen and pantry, two bedrooms that were built with good soundproofing products and a bathroom on three floors. Seely even accounted for high winds by running cables from the side of the house into the ground.
Seely died in 1962; his house was passed down to members of his family who continued to occupy it. In 1984, Panfino Santangelo’s daughter bought the house from Seely’s daughter for $30,000, returning the property to her family. The house was a rental up until it was discovered that a termite infestation had damaged much of the property. The home was inducted into the National Register in 2015, but the necessary repairs have not yet been done. The home is being sold as-is, but its history and potential remain.
Sometimes it feels like a good deal is hard to find, whether you’re buying a car or going out to dinner. That doesn’t change when you are considering where to live. Some towns just give you more bang for your buck, from the quality of life you’ll experience to the living costs you’ll incur. And especially if you’re taking out a mortgage on a house, you’ll want to make sure you’re getting the best value you can. But getting good value from your city doesn’t always have to be difficult to attain. With some patience and information, a smart investment in an undervalued property now could mean that your home becomes worth significantly more and nets you a tidy sum if you decide to sell it. For those who aren’t experts in real estate, it can be difficult to figure out which parts of the country offer the best value. To that end, SmartAsset has once again assembled a list of the most undervalued cities in the country.
We analyzed 189 cities to find the most undervalued cities in America. Our model considers data on unemployment rates, price per square foot, high school graduation rates, percentage of residents with a college degree, crime rate, entertainment establishment density, average days with precipitation, average number of days with bad weather and walk score. For more information on how we put together our final rankings, see the Data and Methodology section below.
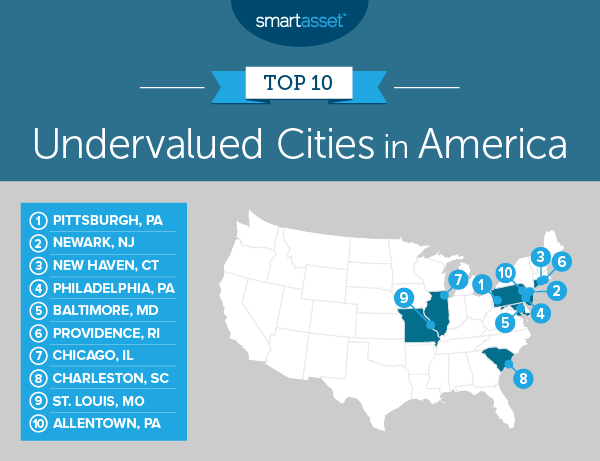
Consistency among undervalued cities. The most undervalued city in America is Pittsburgh for the second year in a row. All told, eight of the cities from last year’s top 10 finish in the top 10 this year, though the order has certainly shuffled.
Look East. The Eastern United States rules this list. Six of the cities in the top 10 are East Coast cities, with several more close by. Three of the top 10 cities are in Pennsylvania alone. There are only two Midwestern cities and none in the Mountain West or the Pacific Coast in the top 10.
1. Pittsburgh, PA
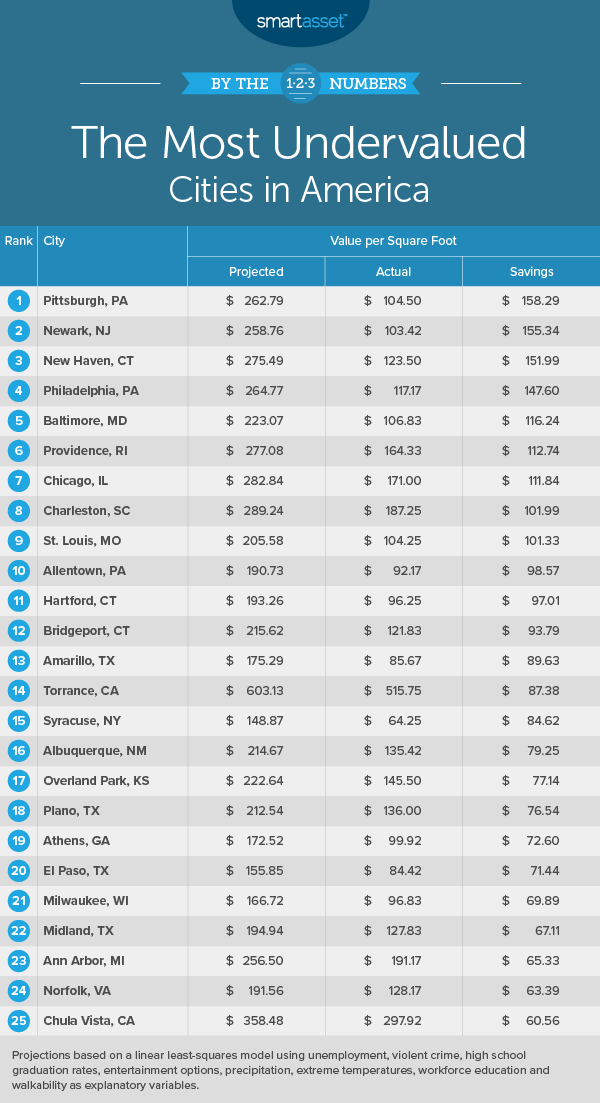
Pittsburgh, Pennsylvania tops this list for the second straight year. The Steel City has a high school graduation rate of 93%, the second-highest in the top 10 and a top-40 rate in the study overall. Pittsburgh can also boast a population in which 37% of adults have at least a bachelor’s degree, a rate that leads the top 10 of our study and ranks 14th out of all 189 cities in our study. Pittsburgh does not place as well for walk score, where it is the second-least walkable city in the top 10.
Zillow estimates that the price per square foot in Pittsburgh is around $104.50, but our model estimates homes should cost $262.79 per square foot, resulting in a surplus value of about $158. As you and your financial advisor scour the market for undervalued investments, Pittsburgh is an undervalued city that can give you the type of deals you crave.
2. Newark, NJ
Newark, New Jersey is the second city on our list and jumps up one spot from its place last year. Walkability is a great benefit of living in Newark – the walk score for the city is the best in the top 10, and fifth-best in the study overall. Newark does not fare as well for education. Only 18% of its residents have at least a bachelor’s degree, the second-lowest percentage for this metric in the top 10, and its high school graduation rate of just 73% is the lowest in the top 10. Overall, our model suggests that living in Newark yields an estimated $155.34 per-square-foot surplus in value.
3. New Haven, CT
New Haven, Connecticut is third on our list. The actual price of real estate in New Haven is $123.50 per square foot, according to Zillow, compared to a projected price of $275.49 based on our model. That’s a surplus value of almost $152. New Haven also has a high school graduation rate of 89%, third-highest in the top 10 of this study. Furthermore, 29% of the population has at least a bachelor’s degree, the third-highest rate in the top 10 and 42nd out of all 189 cities in our study. New Haven also has 2,243 dining and entertainment establishments per 100,000 residents.
4. Philadelphia, PA
In the fourth spot on our list is Philadelphia, Pennsylvania. Homebuyers in the City of Brotherly Love can purchase homes at around $117.17 per square foot, according to data from Zillow. Based on our overall model, living in Philadelphia is equivalent to living in a city where homes are worth $264.77 per square foot, which means the city is undervalued by more than $147. Philadelphia has the second-highest walkability score in the top 10 and the sixth-highest in the study overall.
5. Baltimore, MD
Baltimore, Maryland is fifth on our list. According to Zillow, Baltimore has an actual home sale value of $106.83 per square foot, which is an undervaluation of approximately $116 compared to $223.07, the value our model projects. It also has approximately 50 extreme temperature days per year, which is the second-lowest rate in the top 10 and a top-40 rate overall. Fans of moderate weather will likely find that appealing. They’ll likely find the city’s top-15 walk score appealing as well.
6. Providence, RI
Coming in sixth place is Providence, Rhode Island. Providence has the third-lowest rate of violent crime in the top 10 of this list, at approximately 533 incidents per 100,000 residents. It has 1,276 dining and entertainment establishments per 100,000 residents, the third-highest rate in the top 10 and 81st in the study overall. It’s important for people to consider cost of living before moving somewhere, and according to Zillow data, Providence provides good value: the actual price per square foot for real estate in Providence is $164.33, compared to a projected price of $277.08. That yields an undervaluation of almost $113.
7. Chicago, IL
Chicago, Illinois is the seventh-most undervalued city in America, according to our study. Chicago is tied with Providence, Rhode Island for the third-highest walkability score in the top 10 and seventh-highest overall. The actual price of real estate in Chicago is $171 per square foot, according to Zillow data, but our model estimates that homes should cost $282.84. While Chicago does not score relatively well when it comes to violent crime rate, ranking in the bottom 20 for this metric overall, it does have a high school graduation rate of 85% and 676 dining and entertainment establishments per 100,000 residents.
8. Charleston, SC
Charleston, South Carolina comes in at No. 8 and ranks in the top half of the study for five metrics. There are only 24 extreme temperature days and approximately 65 days with precipitation each year, both of which are the lowest rates in the top 10. The violent crime rate in Charleston is around 283 incidents of violent crime per 100,000 residents each year. Charleston’s walk score is the lowest in the top 10 and its concentration of entertainment and dining establishments is third-lowest in the study overall, but the city’s unemployment rate is 3.2%, a top-50 rate. According to Zillow, the actual cost of real estate is $187.25 per square foot, but our model estimates homes should cost $289.24 per square foot, yielding a surplus value just shy of $102.
9. St. Louis, MO
St. Louis, Missouri, coming in at ninth place, is the westernmost city in our top 10. St. Louis does have the fourth-highest high school graduation rate in the top 10, at 88%, which ranks 91st in the study overall. Furthermore, 28% of the adults in the city’s population have at least a bachelor’s degree, the fourth-highest rate in the top 10 and 61st out of 189 cities overall. The unemployment rate in St. Louis is 3.9%, the second-lowest rate in the top 10.
Zillow data shows that actual cost per square foot in St. Louis is $104.25, while our model estimates that it should cost about $100 more than that, at$205.58. For those looking to get a smart start, it’s also one of the best cities for new college grads.
10. Allentown, PA
Taking the 10th spot in our list is Allentown, Pennsylvania. Allentown has just 461 incidents of violent crime per 100,000 residents each year, which ranks the second-lowest in the top 10 of this study and 84th in the study overall. Allentown also has 1,042 dining and entertainment establishments per 100,000 residents, the fourth-highest concentration in the top 10 and 96th overall. Actual cost per square foot in Allentown is $92.17 according to Zillow data, while our model estimates that it should be $190.73, yielding an undervaluation of $98.57.
Data and Methodology
To determine the most undervalued cities in America, we created a model to project home values based on various quality-of-life metrics. We collected data for nine metrics for 189 of the largest cities in the country. Specifically, we compared the cities across the following metrics:
Home value per square foot. Data is from Zillow and is for 2018.
Violent crime rate per 100,000 residents. Data comes from the FBI’s Uniform Crime Reporting tool and is for 2017.
High school graduation rate. Data comes from the U.S. Department of Education EdFacts and is for the 2016 – 2017 school year.
Number of extreme temperature days. This is the average number of bad weather days a city has in a year. To measure this, we found the average number of days where the temperature exceeds 90 degrees or is under 40 degrees. Data is a 30-year average from 1981 – 2010. Data comes from the National Oceanic and Atmospheric Administration.
Average number of precipitation days per year. This is the average number of days per year with at least 0.1 inches of precipitation. Data comes from the National Oceanic and Atmospheric Administration and is the 30-year average from 1981-2010.
Walkability. This is a measure of how walkable a city is. Data comes from walkscore.com
Percentage of population with a bachelor’s degree or higher. Data comes from the U.S. Census Bureau’s 2017 1-year American Community Survey.
Unemployment rate. Data comes from the Bureau of Labor Statistics local area unemployment statistics. It is the average of the unemployment rates between January 2018 and February 2019.
Concentration of dining and entertainment establishments. This is the number of dining and entertainment establishments per 100,000 residents. Data comes from the Census Bureau’s 2017 Zip Codes Business Pattern Survey.
To model home value per square foot, we ran a linear least squares regression with home value per square foot as the dependent variable and using the eight quality of life metrics as explanatory variables. Below is the formula to measure estimated dollars per square foot:
Home value per square foot = 41.71 – (0.05 * violent crime rate) + (1.57 * average high school graduation rate) + (5.56 * dining and entertainment establishments per 100,000 residents) – (2.47 * average number of days of significant precipitation per year) – (1.45 * number of days with extreme high or low temperatures per year) + (3.03 * percentage of the population with a bachelor’s degree or higher) + (5.26 * walk score) – (21.07 * unemployment rate).
The above formula may seem complicated, but it is actually quite easy to read. For example, we see that in our formula walk score is multiplied by 5.26 (this figure is known as the coefficient). This means that if a city’s walk score improves by 1, assuming all other metrics remain constant, the projected home value per square foot would increase by $5.26 per square foot.
We can see how overvalued or undervalued a city is by plugging our data back into our formula. By plugging the collected data back into our model, we get a projection for home value per square foot, which we can then compare to the Zillow data. In order to create our final rankings, we subtracted the estimated value per square foot by the actual Zillow value per square foot. The city with the largest positive difference ranked first while the city with the largest negative difference ranked last.
In order to create our model, we only included quality of life metrics. We left out other potentially explanatory variables like population change and new home change. Because of this, these figures are not meant as a prediction.
One professor calls it a “hidden threat”: Bloodsucking ticks that carry an array of diseases hitch rides on deer as the mammals multiply across the country, popping up in forests, parks and even our front lawns.
That probably means ticks in more places than ever in the USA in 2019, said Thomas Mather, a University of Rhode Island entomologist known as “The Tick Guy.” And that could mean more Americans are at risk from tick-borne illnesses such as Lyme disease.
“The phenomena of deer in more places and in ever-increasing proximity to people is, I think, the largest factor affecting the ticks-in-more-places trend,” said Mather, who calls springtime “almost a perfect storm” for ticks.
Mather runs Rhode Island’s TickEncounter Index, which monitors tick populations based on data from volunteers across the country. The continental USA is listed for “high” activity through May 15 except for three states: California, Oregon and Washington.
Mather traced the uptick primarily to that “hidden threat” of deer moving closer and closer to where we live. He pointed to his son, a Boston suburbanite who sees deer in his tree-lined neighborhood.
America’s deer population boomed over the past century, from dwindling numbers in 1900 to an about 33.5 million in 2017 – a population larger than Texas.
“The more commonly you see deer in your area, the more likely it is you’re going to see ticks,” Mather said.
A deer grazes on the lawn of the Washington State Penitentiary in Walla Walla, Wash., Tuesday, Nov. 1, 2016. (Photo: Michael Lopez, AP)
Lyme disease could hit 2 million mark next year
Black-legged ticks, or deer ticks, have “pretty strong” numbers in New England, the Mid-Atlantic and Upper Midwest, said Mather, who’s heard from volunteers in the region.
Black-legged ticks that carry Lyme disease “are far and away most responsible for tick-borne diseases,” he said.
Tick-borne disease cases more than doubled from 2004 to 2016, according to the Centers for Disease Control and Prevention, and Lyme disease accounted for 82% of all cases.
Next year, the number of people with tick-borne Lyme disease could hit almost 2 million nationwide, scientists said in the peer-reviewed journal BMC Public Health.
The disease’s symptoms include fever, headache, fatigue and skin rashes, the CDC said, but untreated infections can spread to the heart, joints and the nervous system.M
It’s not just black-legged ticks: Lone Star ticks and Gulf Coast ticks carrying less common diseases are on the move in certain regions, Mather said.
“And these types of ticks all have one thing in common: They utilize whitetail deer as a blood source in some part of their life cycle,” he said.
The black-legged tick, also known as a deer tick, can carry Lyme disease. (
America’s booming deer population can be traced to fewer predators, fewer hunters, hunting regulations and new spaces – think lush parks and suburban landscapes – that let deer thrive, said Anthony DeNicola, president of White Buffalo, a Connecticut-based nonprofit group dispatched to cull deer herds everywhere from tony suburbs to all of Staten Island.
Efforts to manage deer have been too little, too late, DeNicola said, and quiet residential areas have let deer become comfortable, shedding ticks near people’s doorsteps.
“You’re shoveling against the tide,” he said.
What’s needed is a paradigm change, DeNicola said, for Americans to view deer less like majestic Bambis and more like health threats that spread diseases.
“We have the tools to kill deer, but you have to train the hunter to not think as a recreationalist but as a manager,” he said.
How to avoid ticks – in your yard and on your body
Here are tips on how to avoid ticks (and the deer that bring them) on your property and on your person, according to the University of Rhode Island’s TickEncounter Resource Center:
Keep out deer, which bring ticks to your yard, and mice, by which ticks become infected. Clean and clear spaces around sheds, woodpiles and any other enclosed areas where mice might like to hide, and consider deer-resistant plants, a deer fence and deer repellent sprays.
Tick-repellent clothing is the best (and simplest) way to prevent bites. Such clothing can be purchased, or DIY methods for clothes already owned can be used. If you don’t have tick-repellent clothing, tucking pants into socks is one way to keep ticks out.
If you’ve been outside, check for ticks in the places they prefer: armpits, backs of knees, waistbands and other tight, constricted spaces. Check everywhere: Attached ticks don’t wash off during a shower.
If you do spot a tick: Remove it with tweezers, grasping close to the skin and pulling steadily upward to keep from breaking the tick. Disinfect the skin area with rubbing alcohol.
With the passage of the state budget and the long-awaited and hard-fought approval of congestion pricing for Manhattan, New Yorkers worn down by endless subway delays and clogged city streets may see some light at the end of the proverbial tunnel. Congestion pricing, after all, has been promised as the silver bullet that will fix the subway and free Manhattan from the endless sea of cars that clog streets, crowding out pedestrians and polluting our air.
Advocates fighting for a traffic pricing plan have promised the world. A fee for cars entering Manhattan will clear the borough of crippling congestion while guaranteeing funding for Andy Byford’s comprehensive Fast Forward plan to fix New York City’s subways and buses. The dollars will unlock billions in capital spending, and limiting traffic will clear up the city’s air at a time when the catastrophic global impact of constant carbon emissions could not be more clear. (Or so the argument goes.)
But passing congestion pricing was just the first battle in a longer war, and for congestion pricing to be a success—for it to solve the problems it is supposed to solve—the next 21 months will be key as the MTA’s new Traffic Mobility Review Board develops the details of the plan, including any exemptions for those who drive into Manhattan but do not have to pay the fee. Congestion pricing will live or die by these carve-outs—and the board must ignore any political drum-beating related to them.
As I wrote in these pages last summer, congestion pricing is a progressive solution for New York City’s transit funding woes. Drivers in the city are wealthier than transit riders, and imposing a fee on them for access to limited road space to fund transit—whose benefits are enjoyed by millions in NYC—is the very definition of a progressive charging plan. But the benefits will take a few years to materialize. Fixing the subways—installing modern signal systems so that more trains can run through 100-year-old tunnels with fewer delays—is a multi-year (or multi-decade) fix, while congestion pricing will become a reality within the next two years. To successfully introduce congestion pricing, the MTA will roll out transit upgrades before the fee goes into effect, including more bus service and bus lanes, but in the near-term, drivers will face a new tax while high-capacity transit upgrades will be years away. And they won’t be happy.
As a rule, popularity for congestion pricing hits a valley in the period between approval and implementation as the narratives focus on fees rather than results. In recent polls, congestion pricing is already under water by 13 percentage points, and politicians may try to drive up approval numbers by kowtowing to groups seeking exemptions. But for New York City to experience the benefits of congestion pricing, politicians will have to provide cover for an initially unpopular plan.
Since the legislation authorizing congestion pricing punted on the details, special interests are going to push hard to shape the plan. To develop the details of a pricing scheme, the state mandated the MTA to charge for entry to Manhattan south of 60th Street beginning in 2021 and dictated how the pricing plan would be established. A six-panel Traffic Mobility Review Board with appointees from the city and the areas served by Metro-North and the Long Island Rail Road will recommend tolling amounts with a variable pricing structure, including any carve-outs or exemptions, to generate enough revenue to fund $15 billion in MTA capital spending between 2020-2024.
Yet Albany imposed some legislative limitations from the outset. Cars that enter the congestion pricing zone via the West Side Highway or FDR Drive and never exit those roads onto local streets will not be charged. Additionally, emergency vehicles and those vehicles transporting people with disabilities are exempt from the fee, and Manhattan residents who live within the so-called Central Business District and who make less than $60,000 per year will be exempted from the fee. Plus, the fee will be levied only once per day, so cars that repeatedly enter and exit the congestion pricing zone will not be charged multiple times. The remainder of the exemptions will be in the hands of the review board, and that’s where the fight will be.
Already, this battle is playing out in predictable and noisy ways. Take, for instance, State Senator James Sanders, a Democrat who represents the 10th district, who wants to have his cake and eat it too. The Senator represents parts of South Ozone Park, Jamaica, and the Far Rockaways, and very few of his constituents drive into the Manhattan central business district on a daily basis. In fact, according to an analysis of Census data conducted by the Tri-State Transportation Campaign, Sanders’ constituents in Queens are overwhelmingly notdriving into Manhattan. Only around 21 percent of workers in his district head into Manhattan every day, and of those commuters, a whopping 84 percent use the subways, the Long Island Rail Road, or buses. TSTC reports that just 3.1 percent of Sanders’ commuting constituents drive or take taxis into Manhattan south of 60th Street while nearly 50 percent are daily transit users.
Yet after voting for congestion pricing, Sanders is aiming to water down the plan. In a newsletter sent to constituents, Sanders stated that “more work needs to be done to lessen the impact on Queens’ motorists commuting into Manhattan, south of 60th Street.” Charitably, this could be read as a call to include more transit options for his constituents, but “lessen the impact” usually means create carve-outs so fewer people have to pay. This is, of course, self-defeating.
As congestion pricing guru Charles Komanoff detailed recently, even seemingly small carve-outs that exempt just 10 percent of all vehicles entering the pricing zone from the fee have a deep impact. Revenue declines by $100 million per year, and time savings from decreased congestion shrink by seven percent based off of his modeling for New York congestion pricing. Those benefits from the plan are precarious and can disappear in the amount of time it takes to exclude enough cars.
Queens isn’t the only source of lobbying for exemptions. The mayor has constantly pushed for what he calls “hardship exemptions” and has spent years creating the strawman argument out of New Yorkers who he thinks drive in great numbers to hospitals on Manhattan’s East Side. Without acknowledging the thousands of city residents who take subways and buses to their doctors each day, the mayor wants exemptions from medical-bound drivers. Meanwhile, commercial truckers who stand to benefit the most from increased productivity due to clearer streets want to avoid the fee, as do New Jersey politicians, tour bus operators, and motorcycle clubs. Who will pay if everyone gets an exemption?
Kodasema, the Estonian design collective known for its ultra-stylish tiny homes, has created yet another ultra-stylish tiny home. Only this time it floats on water.
Australia is a popular destination for people from New Zealand, United Kingdom and the United States. White and Company can help you emigrate to Australia quickly and easily.
The company’s new minimalist design, the Koda Light Float, sits atop of pontoons, allowing it to float at a dock or hitch to a boat. Unlike Koda’s sleek, concrete tiny homes, the Light Float is built from a timber and glass frame that’s clad in a variety of materials including zinc and wood.
Inside, the 277-square-foot tiny home has a spacious living room with tall ceilings, a modern kitchen, a sleeping area, and a bathroom with a shower and toilet. It also comes with an expansive wooden deck that’s asking for lounge chairs.
The minimalist interiors turn the tiny home into a blank canvas—Koda says the Light Float can be used as a houseboat, artists’ studio, harbor cafe, or a “fisherman’s dream boat.”
The floating Koda home, which can be stacked to create a bigger dwelling, has a three-month turnaround time. Price is upon request.


/cdn.vox-cdn.com/uploads/chorus_image/image/63371192/910282304.jpg.0.jpg)
/cdn.vox-cdn.com/uploads/chorus_image/image/63223012/koda7.0.jpg)
:no_upscale()/cdn.vox-cdn.com/uploads/chorus_asset/file/15955174/koda1.jpg)
:no_upscale()/cdn.vox-cdn.com/uploads/chorus_asset/file/15955176/koda6.jpg)
:no_upscale()/cdn.vox-cdn.com/uploads/chorus_asset/file/15955177/koda5.jpg)
:no_upscale()/cdn.vox-cdn.com/uploads/chorus_asset/file/15955180/koda2.jpg)