Tag Archives: Chappaqua Real Estate

Chappaqua Real Estate

How Have Rents Changed Since 1960? | Chappaqua Real Estate

With rents rising in cities and states across the US, many renters struggle with affordability. In Miami, Los Angeles, and Orlando, for example, more than 55% of renters were cost-burdened in 2014, spending more than 30% of their income on rent. Rents have moderated recently in expensive metros like San Francisco and New York, but continue to climb rapidly in Dallas, Seattle, and Denver.

To better understand how rents and affordability have changed over time, Apartment List analyzed Census data from 1960 – 2014. We find that inflation-adjusted rents have risen by 64%, but real household incomes only increased by 18%. The situation was particularly challenging from 2000 – 2010: household incomes actually fell by 9%, while rents rose by 18%. As a result, the share of cost-burdened renters nationwide more than doubled, from 24% in 1960 to 49% in 2014.

These trends are repeated in cities and states across the country. Since 1980, incomes in expensive areas like DC, Boston, and SF have risen rapidly, but rents have increased roughly twice as fast. In Houston, Detroit, and Indianapolis, incomes have actually fallen in real terms, while rents have risen by ~15-25%. The only urban areas where incomes kept pace with rising rents were Austin, Las Vegas, and Phoenix.

Inflation-adjusted rents have increased by ~64% since 1960

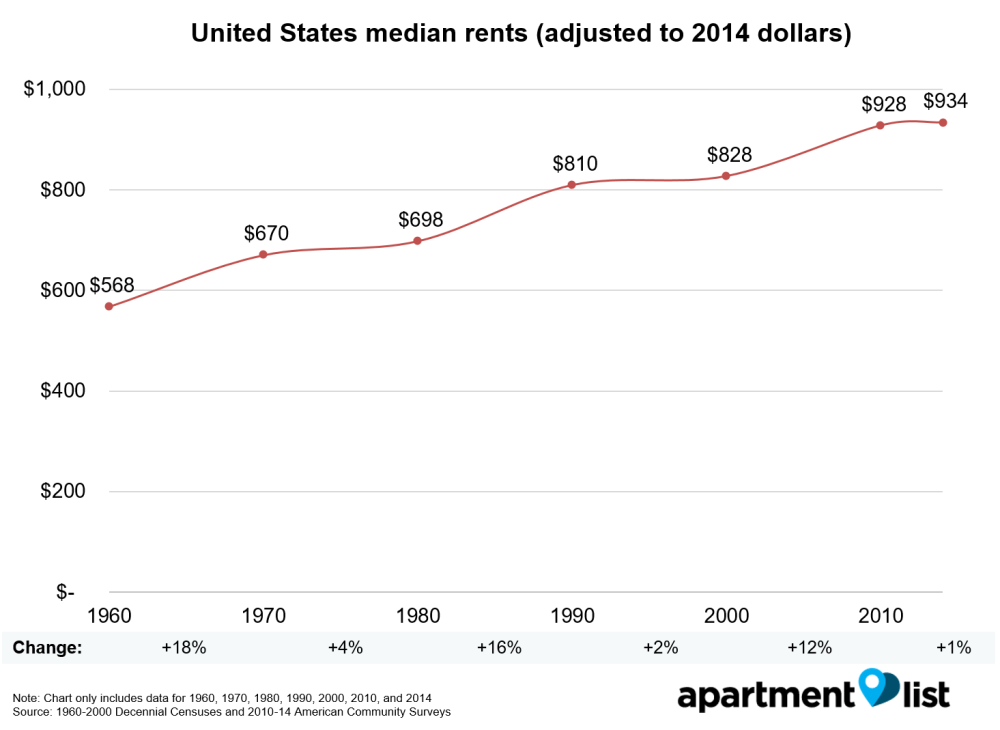
First, we took a look at median rents in the United States, from 1960 to 2014. All data was adjusted for inflation, allowing us to compare rents across decades. Median rents have increased steadily during that time period, from $568 in 1960 to $934 in 2014 – an increase of 63%. Rents rose the fastest during the 1960s (18% increase), followed by the 1980s (16%). In contrast, the 1970s and 1990s saw relatively small rent increases, at 4% and 2% respectively.

Rents increased by 12% from 2000-2010, but median income fell by 7%

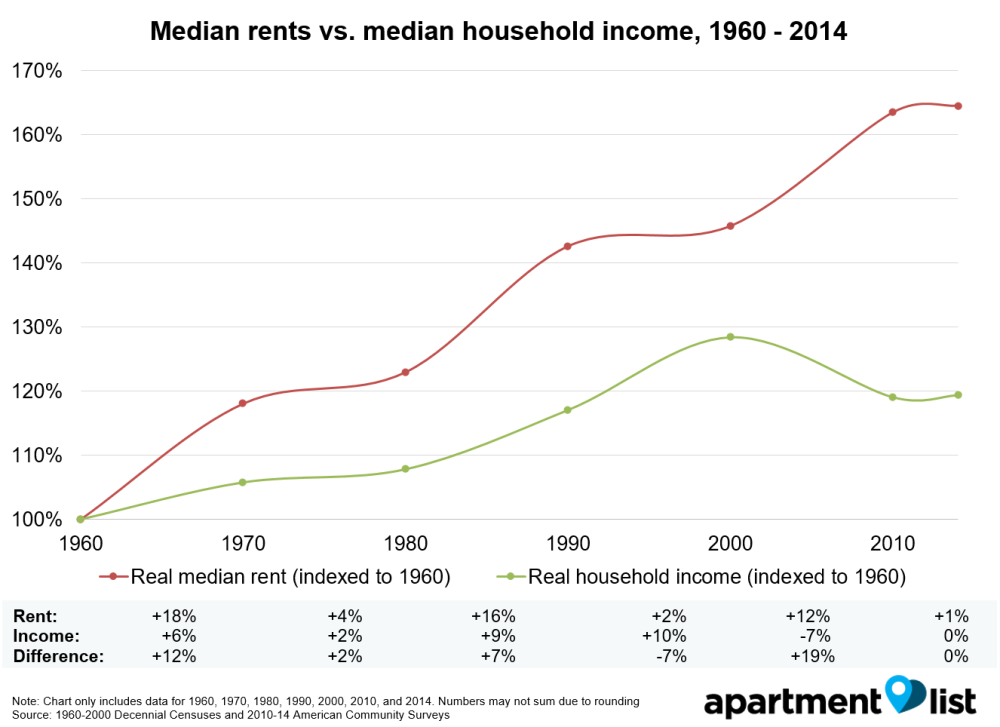
Next, we compared the change in rents with household income, over the same period. Both sets of data were adjusted to 2014 dollars, and indexed to 1960. Looking at the results, the 1990s were the best decade for renters, as rents barely budged (+2% over the course of the decade), whereas incomes increased by nearly 10% – a 7% difference overall, and the only decade in which rents increased less than incomes. Renters did relatively well in the 1970s as well, with both rents and incomes showing small increases.

The decade from 2000-2010, however, was the worst for renters. They were hit by rising rents (+12%) and declining incomes (-7%), making them significantly worse off overall. That decade was also the only decade in which real household incomes fell. Things have improved a bit since, as rents and incomes flattened from 2010-2014, but it’s not surprising that many Americans say that they are worse off now than eight years ago.

The share of cost-burdened renters has risen from 24% to 49%

What has the combination of rising rents and stagnant incomes done to renters? To answer the question, we used JCHS tabulations of cost-burden rates (the share of renters spending more than 30% of income on rent). Unsurprisingly, the share of cost-burdened renters increased from 1960 – 2014, but the magnitude of the increase is dramatic. 24% of renters were cost-burdened in 1960, but that number jumped to more than 50% in 2010, before declining slightly in the years following. Mirroring the data on rents and income, the share of cost-burdened renters actually declined slightly in the 1990s, but spiked from 2001-2005, and again from 2007-2011. The US renter population is larger than it has ever been (43 million households, or 37% of the total population), and nearly half of them are struggling to pay rent.

Renters in lower income quintiles hit especially hard by rising rents and declining incomes

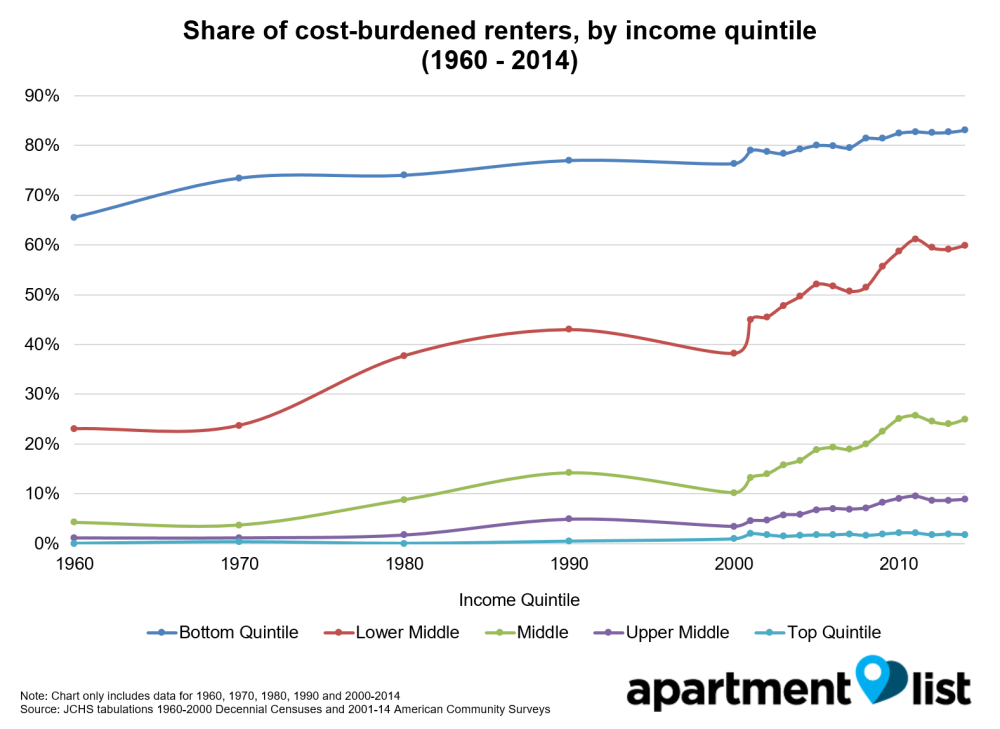
Next, we looked at cost-burden rates by household income quintile. Renters with incomes in the lowest 20% have had cost-burden rates greater than 70% since the 1970s, and affordability has continued to decline in recent years. Among renters in the lower middle bracket (making up to $41,186 a year), however, the increase in cost-burden rates has been significant, with an increase of 22% since the year 2000. Renters in other income brackets have fared better, but cost-burden rates have risen across the board.

Rents have risen faster than incomes in nearly every urban area

We know that rents have increased faster than incomes nationwide, but how do the results vary across cities? To answer this question, we took Census data from 1980 – 2014, and compared median renter incomes and rents in different urban areas across the US. As before, data was adjusted for inflation. In nearly every urban area we examined, rents increased significantly more than incomes, with results clustering into five groups:

  1. Expensive coastal cities saw significant increases in incomes, but not enough to keep pace with rising rents. Washington, DC, for example, had a 33% increase in real incomes, but rents rose by 86%. Similar results were seen in San Francisco, New York City, and Boston. Renters in Los Angeles struggled the most, as rents jumped 55%, even as incomes only increased 13%.
  2. Renters in the Midwest and South had stagnant or declining incomes, even as rents increased. Incomes in Dallas, Nashville, and Chicago barely budged, even as rents rose by 25% or more. In Houston, Detroit, and Indianapolis, incomes actually fell by ~10-15%, even as housing costs continued to climb.
  3. Other cities saw incomes increase, but not fast enough to keep up with rents. This was the biggest group, comprising a varied list of cities, from Seattle and Portland on the West Coast; to Orlando, Atlanta, and Miami on the Southeast; and Denver and Salt Lake City on the interior. In some ways, this group mirrors what has happened in the US as a whole: incomes have increased by 15-25% since 1980, but rents have grown twice as fast.
  4. Cities with room to grow – Las Vegas and Phoenix – had relatively small rent increases, allowing incomes to keep up. Both cities added large amounts of housing inventory in the 1990s and 2000s, which helped keep a lid on rents. Incomes in these urban areas did not increase any faster than most other cities, but small rent increases mean that renters are not much worse off than before.
  5. Only one city had high income growth that matched rent increases – Austin, TX. Rents in Austin rose rapidly from 1980 – 2014, but incomes grew even faster. Austin’s population has more than doubled since 1980, causing rents to increase by more than 40%, but real incomes increased even faster. Strong employment growth in Austin has attracted many millennials, but wage growth means that Austin is the only urban area where incomes have risen more than rents.

The rent is (still) too damn high

Rents have risen rapidly in many cities across the US, but looking at things over more than fifty years helps us understand the impact of these trends. If rents had only risen at the rate of inflation, the average renter would be paying $366 less in rent each month, which would allow many to more than double their down payment savings.When coupled with stagnant incomes and soaring student debt, it is no wonder that renters across the country are struggling with affordability. Nearly half of them are cost-burdened, compared with less than a quarter in 1960.

read more…


https://www.apartmentlist.com/rentonomics/rent-growth-since-1960

Private Residential Construction Spending Stalls in April | Chappaqua Real Estate

NAHB analysis of Census Construction Spending data shows that total private residential construction spending for April dropped to a seasonally adjusted annual rate of $439.7 billion, down by 1.5% over the March upwardly revised estimate. Private nonresidential construction spending was also down 1.5%, the first decline in 2016.

Within private residential construction, spending on multifamily and improvements both declined in April. Multifamily spending decreased to $60.0 billion after two consecutive months of strong gains. Despite this monthly decline, multifamily spending was 21.4% higher than in April 2015. Private construction spending on home improvements fell to a seasonally adjusted annual rate of $142.2 billion, down by 3.2% since last month. Compared to 2015 April estimates, spending on home improvements decreased 3.5%. Single-family spending stood at $237.5 billion, virtually unchanged since March but up by 12.9% year over year.

The NAHB construction spending index, which is shown in the graph below (the base is January 2000), illustrates the strong growth in new multifamily construction since 2010, while new single-family construction and home improvements spending have drifted upward at a more modest pace. NAHB anticipates accelerating growth for new single-family spending over the rest of 2016.

Slide1

The pace of private nonresidential construction spending retreated after three consecutive monthly increases. It fell 1.5% on a monthly basis, but was 3.4% higher than the April 2015 estimate. The largest contribution to this year-over-year nonresidential spending gain was made by the class of lodging (25.3% increase), followed by office (24.4% increase) and amusement and recreation religious (11.9% increase).


read more…


http://eyeonhousing.org/2016/06/private-residential-construction-spending-stalls-in-april/

Mortgage rates average 3.59% | Chappaqua Real Estate

Freddie Mac (OTCQB: FMCC) today released the results of its Primary Mortgage Market Survey® (PMMS®), showing mortgage rates declining from the previous week and reaching their lowest level since February of last year.

News Facts

  • 30-year fixed-rate mortgage (FRM) averaged 3.59 percent with an average 0.5 point for the week ending April 7, 2016, down from last week when they averaged 3.71 percent. A year ago at this time, the 30-year FRM averaged 3.66 percent.
  • 15-year FRM this week averaged 2.88 percent with an average 0.4 point, down from last week when it averaged 2.98 percent. A year ago at this time, the 15-year FRM averaged 2.93 percent.
  • 5-year Treasury-indexed hybrid adjustable-rate mortgage (ARM) averaged 2.82 percent this week with an average 0.5 point, down from last week when it averaged 2.90 percent. A year ago, the 5-year ARM averaged 2.83 percent.

Average commitment rates should be reported along with average fees and points to reflect the total upfront cost of obtaining the mortgage. Visit the following link for theDefinitions. Borrowers may still pay closing costs which are not included in the survey.

Quote
Attributed to Sean Becketti, chief economist, Freddie Mac.

“Mortgage rates this week registered the delayed impact of last week’s sharp drop in Treasury yields as the 30-year mortgage rate fell 12 basis points to 3.59 percent. This rate marks a new low for 2016 and matches last year’s low in February 2015. Low mortgage rates and a positive employment outlook should support a strong housing market in the second quarter of 2016.”

Mortgage rates average 3.64% | Chappaqua Real Estate

Freddie Mac (OTCQB: FMCC) today released the results of its Primary Mortgage Market Survey® (PMMS®), showing mortgage rates ticking higher for the first time in two months.

News Facts

  • 30-year fixed-rate mortgage (FRM) averaged 3.64 percent with an average 0.5 point for the week ending March 3, 2016, up from last week when it averaged 3.62 percent. A year ago at this time, the 30-year FRM averaged 3.75 percent.
  • 15-year FRM this week averaged 2.94 percent with an average 0.5 point, up from last week when it averaged 2.93 percent. A year ago at this time, the 15-year FRM averaged 3.03 percent.
  • 5-year Treasury-indexed hybrid adjustable-rate mortgage (ARM) averaged 2.84 percent this week with an average 0.5 point, up from last week when it averaged 2.79 percent. A year ago, the 5-year ARM averaged 2.96 percent.

Average commitment rates should be reported along with average fees and points to reflect the total upfront cost of obtaining the mortgage. Visit the following link for theDefinitions. Borrowers may still pay closing costs which are not included in the survey.

Quote
Attributed to Sean Becketti, chief economist, Freddie Mac.

“The market turbulence that kicked off the year subsided at the end of February, providing at least a temporary break in the flight to quality. Treasury yields approached their highest level in a month, boosting the 30-year mortgage 2 basis points this week to 3.64 percent. Despite this welcome breather, Fed officials have been highlighting the downside risks to the economic outlook, and the market expects the Fed to refrain from any further short-term rate increases for now.”

The future of home ownership | Chappaqua Real Estate

Economists are hopeful that housing market activity — and prices — will continue to perk up generally in 2016, due to a number of factors. The most important catalyst for housing is the improving economy and employment landscape. As Americans feel more confident about the economy and more secure in their jobs, they will be more willing to take the big step of home ownership.

At the same time, despite the Fed’s first rate increase, mortgage rates remain low and banks are finally loosening credit conditions. Both of those factors are drawing more buyers into the market, further increasing housing demand.

One interesting group is the “boomerang buyers” — homeowners who lost their homes during the recession and are ready to jump back into the market. Some 7.3 million Americans lost their homes to foreclosures or short sales — two events that can stay on your credit report for up to seven years — from 2007 to 2014, according to real estate data company RealtyTrac. If they have no other major credit issues lingering, those first foreclosed owners are now coming out of the financial doghouse and qualify for a mortgage. RealtyTrac projects that 250,000 to 500,000 boomerang-ers will come back into the market this year, with another million or so more in the next few years.

One last group that could help boost the housing market is millennials, those aged 18 to 34. Sure, many of them are spooked by home ownership, because they watched their parents navigate the Great Recession and they themselves are graduating college with a hefty chunk of student loans. But young professionals may find that a fixed-rate mortgage is the perfect antidote to rising rents. And when they do come to that realization, the nation’s homeownership rate — which at 63.7% in the third quarter of 2015 was near multi-year lows — should reverse course.


read more…


http://time.com/money/4193040/real-estate-housing-market/

The dirty secret of Miami’s latest luxury condo boom | Chappaqua Real Estate

Feds Will Track How Much of Miami's Real-Estate Boom Is Being Fueled by Money Laundering

Photo by LostINMia’s Flickr via MNT Flickr Pool

The dirty secret of Miami’s latest luxury condo boom? Some of those sky-high penthouses are being bought by international criminals and other shady individuals to launder money. How many? Well, the Treasury Department’s Financial Crimes Enforcement Network wants to find out.

Take, for instance, Spanish drug kingpin Álvaro López Tardón. He ran an international cocaine ring, and to help hide his money, he set up shell corporations to buy 14 condos in Miami. Tardón is now serving a 150-year prison sentence, but the feds suspect he might be just the tip of the iceberg when it comes to funneling shady money into Miami luxury real estate.

Today the Treasury Department announced it’s targeting Miami-Dade County and Manhattan with a “geographic targeting order” to find out who is buying all of those high-end condos.

“[We are] concerned that all-cash purchases — i.e., those without bank financing — may be conducted by individuals attempting to hide their assets and identity by purchasing residential properties through limited liability companies or other opaque structures,” reads a release from the feds.

The Treasury Department will now require insurance companies to identify the names of the buyers of any all-cash real-estate transactions in Miami-Dade of more than $1 million and report them to the federal government. Those names, however, will not be released to the public.

Currently, buyers can use a network of shell companies, both offshore and domestic, to shield their identities. When buyers pay in cash, it’s even harder to track the origin of the money because no mortgages are involved.

The order will be in place from March until August, but according to the New York Times, if multiple instances of money laundering are uncovered, permanent rules will be put in place and the requirement may be extended beyond Manhattan and Miami-Dade.

Concerns that Miami’s latest real-estate bubble is being fueled, at least in part, by money laundering is nothing new. In 2013, the Nation published a report about the prevalence of the practice in Miami-Dade.

“There is a huge amount of dirty money flowing into Miami that’s disguised as investment,” Jack Blum, a Washington attorney specializing in money-laundering cases, told the Nation. “The local business community sees any threat to that as a threat to the city’s lifeblood.”

The news comes as foreign investment in Miami luxury properties is already decreasing. Curbed Miami reported earlier this week that “stock market volatility in China, low oil prices, currency devaluations in South America, and a heck of a lot of new condo units coming on the market” is leading to softening demand.

The effect the order will have on Miami’s already shaky real-estate market depends upon the number of buyers using dirty money to purchase those properties.


read more…


http://www.miaminewtimes.com/news/feds-will-track-how-much-of-miamis-real-estate-boom-is-being-fueled-by-money-laundering-8174220

Concrete repairs this winter | Chappaqua Real Estate

Site Accuflex Coatings ,

Concrete surfaces are constantly under attack by
the elements resulting in the need for repairs.
Accuflex Coatings

When I was in college I had a job doing maintenance in a downtown Denver hotel. I didn’t really know what I was doing but most things weren’t that hard to figure out. One time, though, I needed to repair a broken up concrete door threshold. I removed the old concrete and went down to the hardware store and bought a bag of premixed concrete. I added the amount of water the bag said to use (maybe just a little extra for good luck) and poured it in and troweled it off-another job well done!

But no! Two weeks later my boss called me into his office. Seems he had just gone past my repair work and found it as cracked up as the original threshold. I was so disappointed! We went back to the scene of the crime to do some actual investigation in advance of launching off on another repair attempt. While we were standing there, one of the kitchen workers came through with a heavy hard-wheeled dolly loaded with supplies that dropped onto the threshold as he passed: we knew the cause of the problem. For the next repair, we added reinforcing steel, used higher strength concrete, and eliminated the drop-off onto the threshold. When I left a year later, the new threshold was still working well.

I took away a good lesson-one that I soon found applied to just about any repair work. Before you can repair anything you have to know what caused the problem in the first place and you have to understand how it is supposed to work. Only then can you make an intelligent decision on how to do the repair.

Concrete Repair Information

With any concrete repair, take that lesson to heart and you’re off to a great start. First figure out what caused the damage, do the necessary preparation of removing any unsound concrete and contamination, then install a repair designed to solve the problem. The worst thing you can do is make a repair that doesn’t last. Someone once told me that over 50% of concrete repairs fail again within two years. That is not a track record that inspires confidence.

So let’s start by evaluating the problem and then we can decide how we are going to make a durable repair. This article is only a very superficial treatment of this subject. For more details, the best source is either the International Concrete Repair Institute or the American Concrete Institute. ICRI, in conjunction with ACI, publishes the Concrete Repair Manual which is over 2000 pages long.


read more…


http://www.concretenetwork.com/concrete-repair/


Rates average 3.97% | Chappaqua Real Estate

Freddie Mac (OTCQB: FMCC) today released the results of its Primary Mortgage Market Survey® (PMMS®), showing mortgage rates mixed with the 30-year fixed-rate falling back below four percent to start the year.

News Facts

  • 30-year fixed-rate mortgage (FRM) averaged 3.97 percent with an average 0.6 point for the week ending January 7, 2016, down from last week when it averaged 4.01 percent. A year ago at this time, the 30-year FRM averaged 3.73 percent.
  • 15-year FRM this week averaged 3.26 percent with an average 0.5 point, up from 3.24 percent last week. A year ago at this time, the 15-year FRM averaged 3.05 percent.
  • 5-year Treasury-indexed hybrid adjustable-rate mortgage (ARM) averaged 3.09 percent this week with an average 0.5 point, up from last week when it averaged 3.08 percent. A year ago, the 5-year ARM averaged 2.98 percent.

Average commitment rates should be reported along with average fees and points to reflect the total upfront cost of obtaining the mortgage. Visit the following link for theDefinitions. Borrowers may still pay closing costs which are not included in the survey.

Quote
Attributed to Sean Becketti, chief economist, Freddie Mac.

“Concerns about overseas economic developments have dominated financial markets to start the year. U.S. Treasury bond yields fell amidst a global equity selloff and flight to safety. In response, the 30-year mortgage rate dipped 4 basis points to 3.97 percent.”

U.S. housing starts surge | Chappaqua Real Estate

U.S. housing starts in November rebounded from a seven-month low and permits surged to a five-month high, signs of strength in the housing market that could give the Federal Reserve more confidence to raise interest rates on Wednesday.

Groundbreaking jumped 10.5 percent to a seasonally adjusted annual pace of 1.17 million units, the Commerce Department said on Wednesday. October’s starts were largely unchanged at a 1.06 million-unit rate.

The strong report came as Fed officials were due to resume a two-day monetary policy meeting. The U.S. central bank is expected to raise its benchmark overnight interest rate from near zero at the end of the meeting. The first rate hike in nearly a decade is not expected to derail the housing recovery.

November marked the eighth straight month that starts remained above 1 million units, the longest stretch since 2007. Economists expect housing starts to average around 1.1 million units for 2015, which would be the highest since 2007 and up from 1.0 million units in 2014.

Robust household formation as labor market strength encourages young adults to leave their childhood homes is underpinning the housing market recovery.

But the sector remains constrained by a persistent shortage of houses available for sale. This has resulted in home prices rising faster than salaries, pushing more people towards renting.

Economists polled by Reuters had forecast housing starts rising to a 1.135 million-unit pace last month.

Single-family housing starts, the largest segment of the market, increased 7.6 percent to a 768,000-unit pace. That was the highest reading since January 2008. Groundbreaking on single-family projects rose 8.8 percent in the South, where most home building takes place.


read more…


Reuters.com

Permits to build new homes increased 4.1% | Chappaqua Real Estate

Permits to build new homes increased 4.1% in October to a level of 1.15 million per year. Both single-family and multifamily levels increased by 2.4% and 6.8% respectively. On a year-to-date basis, total permits are up 11.9%; single-family are up 8.6% and multifamily are up 17.2% as the housing market continues its modest pace of recovery.

Housing starts were down primarily due to a fall in multifamily activity which was up significantly in September and expected to readjust. October multifamily starts at 338,000 were the lowest since March 2015 but increased by 10.4% year to date compared to last year.

Multifamily Construction (000s)

Single-family starts were down 2.4% to 722,000 on an annual basis. Three of the four census regions reported slight increases while single-family starts in the South were down 6.9%. The drop appears to be due to especially stormy weather throughout the southern coast in October. Year-to-date single-family sums are up across all regions as are single-family permits suggesting that the slight October drop is temporary.

Single-family Construction (000s)
The steady increase in residential starts in 2015 has produced a steady increase in the number of homes under construction although carrying them through to completion slowed a bit as labor shortages, especially finishing carpenters, slow the ability to get finishing touches done.


read more…


http://eyeonhousing.org/2015/11/housing-construction-continues-forward/