Freddie Mac (OTCQB: FMCC) today released the results of its Primary Mortgage Market Survey® (PMMS®), showing that the 30-year fixed-rate mortgage (FRM) averaged 2.88 percent, the lowest rate in the survey’s history dating back to 1971.
“The resilience of the housing market continues as mortgage rates hit another all-time low, giving potential buyers more purchasing power and strengthening demand,” said Sam Khater, Freddie Mac’s Chief Economist. “We expect rates to stay low and continue to propel the purchase market forward. However, the main barrier to rising demand remains the lack of inventory, especially for entry-level homes.”
News Facts
30-year fixed-rate mortgage averaged 2.88 percent with an average 0.8 point for the week ending August 6, 2020, down from last week when it averaged 2.99 percent. A year ago at this time, the 30-year FRM averaged 3.60 percent.
15-year fixed-rate mortgage averaged 2.44 percent with an average 0.8 point, down from last week when it averaged 2.51 percent. A year ago at this time, the 15-year FRM averaged 3.05 percent.
5-year Treasury-indexed hybrid adjustable-rate mortgage (ARM) averaged 2.90 percent with an average 0.4 point, down from last week when it averaged 2.94 percent. A year ago at this time, the 5-year ARM averaged 3.36 percent.
Average commitment rates should be reported along with average fees and points to reflect the total upfront cost of obtaining the mortgage. Visit the following link for the Definitions. Borrowers may still pay closing costs which are not included in the survey.
If you live in the suburbs or you’re a city dweller eyeing a move to a quiet cul-de-sac where your kids can play outside, you need to know about Joe Biden’s plan for a federal takeover of local zoning laws.
The ex-veep wants to ramp up an Obama-era social engineering scheme called Affirmatively Furthering Fair Housing that mercifully barely got underway before President Trump took office, vowing to stop it.
Biden’s plan is to force suburban towns with single-family homes and minimum lot sizes to build high-density affordable housing smack in the middle of their leafy neighborhoods — local preferences and local control be damned.
Starting in 2015, President Barack Obama’s Department of Housing and Urban Development floated a cookie-cutter requirement for “balanced housing” in every suburb. “Balanced” meant affordable even for people who need federal vouchers. Towns were obligated to “do more than simply not discriminate,” as a 2013 HUD proposal explained. Rather, towns had to make it possible for low-income minorities to choose suburban living and provide “adequate support to make their choices possible.”
Had the rule been implemented nationwide, towns everywhere would have had to scrap zoning, build bigger water and a bigger sewer to support high-density living, expand schools and social services and add mass transit. All pushing up local taxes. Towns that refused would lose their federal aid.
The rule was one of the worst abuses of the Obama-Biden administration — a raw power grab masquerading as racial justice
In Westchester, County Executive Rob Astorino battled the Obama-Biden administration for years, successfully resisting the baseless smear of racism. Zoning laws limit what can be built in a neighborhood in neutral fashion, Astorino explained, not who can live there.
To be absolutely clear, denying anyone the chance to rent or buy a home because of their race is abhorrent and illegal. It should be prosecuted whenever it still happens.
African Americans have been steadily leaving inner cities and choosing suburban lifestyles, according to Brookings Institution data. Many families — of all races — want the peace of mind of letting their kids ride bikes around quiet neighborhood streets. That’s what zoning laws provide.
The real barrier to suburban living is money. Living in the ’burbs isn’t cheap. HUD Secretary Ben Carson told a House committee last May that “people can only afford to live in certain places.” It’s “not because George Wallace is blocking the door.”
Biden and the equality warriors are using accusations of racism to accomplish something different. Their message is: You worked and saved to move to the suburbs, but you can’t have that way of life unless everyone else can, too.
Count on Trump to make Biden’s war on the suburbs a key issue in the election. In his Rose Garden news conference Thursday, the president came out swinging, warning that Biden would “totally destroy the beautiful suburbs” by “placing far-left Washington bureaucrats in charge of local zoning.”
In response, the left and its media allies played the race card. As usual. On MSNBC, Princeton University Professor Eddie Glaude Jr. said, “I hear the words of a racist.” CNN accused the president of fearmongering “white suburban voters.” But it’s CNN that is being racist — by assuming that only whites own homes in the suburbs.
Trump is talking to suburban homeowners of all ethnicities. If you buy a house in a neighborhood with quarter-acre zoning, you don’t want a high-density housing complex built at the end of the street.
The president won the suburbs in 2016, but polls show Trump trailing in the suburbs largely because of opposition from women. They need to focus on what’s at stake for their families.
Tens of thousands of New Yorkers have fled the city in the past four months, many of them spending their savings and taking out a mortgage to buy a home in the suburbs. The same dynamic is playing out in many other regions nationwide. For these transplants, the stakes are high.
The outcome of the November election will determine the value of their new home, the size of their property tax bill and the character of the town they now call home.
Betsy McCaughey is a former lieutenant governor of New York.
In a sign that housing stands poised to lead a post-pandemic economic recovery, builder confidence in the market for newly-built single-family homes jumped 21 points to 58 in June, according to the latest National Association of Home Builders/Wells Fargo Housing Market Index (HMI). Any reading above 50 indicates a positive market.
As the nation reopens, housing is well-positioned to lead the economy forward. Inventory is tight, mortgage applications are increasing, interest rates are low and confidence is rising. And buyer traffic more than doubled in one month even as builders report growing online and phone inquiries stemming from the outbreak.
Housing clearly shows signs of momentum as challenges and opportunities exist in the single-family market. Builders report increasing demand for families seeking single-family homes in inner and outer suburbs that feature lower density neighborhoods. At the same time, elevated unemployment and the risk of new, local virus outbreaks remain a risk to the housing market.
Derived from a monthly survey that NAHB has been conducting for 30 years, the NAHB/Wells Fargo Housing Market Index gauges builder perceptions of current single-family home sales and sales expectations for the next six months as “good,” “fair” or “poor.” The survey also asks builders to rate traffic of prospective buyers as “high to very high,” “average” or “low to very low.” Scores for each component are then used to calculate a seasonally adjusted index where any number over 50 indicates that more builders view conditions as good than poor.
All the HMI indices posted gains in June. The HMI index gauging current sales conditions jumped 21 points to 63, the component measuring sales expectations in the next six months surged 22 points to 68 and the measure charting traffic of prospective buyers vaulted 22 points to 43.
Looking at the monthly average regional HMI scores, the Northeast surged 31 point to 48, the South jumped 20 points to 62, the Midwest posted a 19-point gain to 51 and the West catapulted 22 points to 66.
A smaller share of American adults were employed in April than ever before in records going back to 1948.
The employment-population ratio, which measures the share of Americans above the age of 16 who are employed, fell to 51.3 percent, the Department of Labor said Friday. A year ago, it was 60.6 percent.
The previous low was 55 percent in the summer of 1954.
In November 2007, the employment-population ratio was 62.9 percent. This rate fell consistently during the subsequent recession and several months beyond, before stabilizing around 58.5 percent in October 2009. Between October 2009 and March 2014, the ratio remained stubbornly low, fluctuating within 0.3 percentage points of 58.5 percent. It began to climb again in 2014, hitting its post-2008 peak of 61.1 in February of 2020.
The labor force participation rate fell by 2.5 percentage points over the month to 60.2 percent, the lowest rate since January 1973 (when it was 60.0 percent).
The unemployment rate jumped to 14.7 percent in April and the economy shed 20.5 million jobs, according to data released by the Department of Labor on Friday.
Over the past seven weeks, more than 33 million Americans have filed claims for unemployment benefits. But the number of claims has been declining for five consecutive weeks.
The Trump administration successfully pushed Congress to authorize direct payments to U.S. households to support incomes and to raise the amount paid by unemployment benefits by $600 a week, making it possible for some Americans to earn more through losing a job than they made working. The federal government is also backing over $600 billion of loans to small businesses that can be forgiven if those businesses avoid layoffs.
The Fed cuts its interest rate target to a range between 0 and 0.25 percent. In addition, it is in the process of launching a number of new lending facilities aimed at providing liquidity to struggling businesses.
But loans and direct payments can only go so far to offset orders that many businesses close their doors entirely or dramatically reduce the number of customers they serve. The customers were told to stay at home and avoid going out except to purchase essential items. Bars, theaters, and gyms were shuttered in much of the country. Restaurants were required to close dining rooms, remaining open only for take-out and delivery. Manufacturers often had to shut down altogether, including the plants of most automakers in the U.S. Health care establishments found themselves bereft of businesses as patients canceled elective procedures and even regular check-ups.
Does this have anything to do with local taxes? You bet it does.
For the current edition of the Home Building Geography Index (HBGI), NAHB introduces a red vs. blue segmentation of the 3,221 counties of the United States.
“Red counties” are defined as those in which the majority of the population in the 2016 Presidential election voted for President Donald Trump, while “blue counties” are defined as those in which most of the population voted for then-Senator Hillary Clinton1. The data show that the population distribution is 48.7% in red and 51.3% in blue2.
While the population of the country is almost evenly split between red and blue counties, the same is not true for the distribution of single-family and multifamily construction. In fact, 61% of single-family construction is in red counties, while almost 64% of multifamily construction are in the blue counties. Blue counties tend to feature greater population density, hence the divide.
Moreover, the growth rates for home construction differ between red and blue counties. The map above shows the blue and red counties in the U.S. and the four-quarter moving averages of their year-over-year growth rates for single-family construction as of the end of 2019. Red counties posted growth of 1.7% for single-family home building, while blue counties posted a decline of 1.2%. This is likely due to differences in land availability/cost, as well as regulatory differences for construction. Indeed, lower growth rates in blue counties – compared to red – is expected given the relative cost of land in major metropolitan areas, making building a single-family home more expensive in such areas you will need to search for several contacts to find the right one for you and your budget, with https://www.asifoam.com/riverside/ you can get the best materials for your projects.
While there are differences between these two types of counties, both regions’ performances at the end of 2019 were clear improvements to relative periods of decline due to the housing soft patch during 2018, as seen on the figure below.
Although blue county multifamily construction growth was positive in 2019 (7.6%), the relatively smaller share of apartment construction in red counties posted a larger growth rate of 21.4%. This shows that red counties outperformed blue counties in both single- and multifamily development
Additionally, the above chart shows that, until 2019, multifamily growth was lower than single-family expansion for most periods since 2016.
With this edition of the NAHB/HBGI, additional new posts will examine updates for regional trends (large metros vs exurbs vs rural areas, etc.) for single-family and multifamily construction, as well as additional red vs blue analysis from a regional perspective.
We use Dave Leip’s Atlas of U.S. Presidential Elections for election results at the county level. The red vs. blue segmentation cleanly applies to all U.S. states except for Alaska, which, by tradition, has had electoral votes casted in Presidential Elections according to House District. To circumvent this problem, we use a county-equivalent analysis that imputes House District-level election data that was done by RRH Elections (https://rrhelections.com/index.php/2018/02/02/alaska-results-by-county-equivalent-1960-2016/).
Conventional wisdom is that the American population is concentrated in major metropolitan areas, i.e., those that voted for Hillary Clinton, even though the red counties far outnumber the blue, 2,633 over 507, respectively. The near 50-50 population split, as noted above, however, is due to the number of red counties with populations of 1,000 or above.
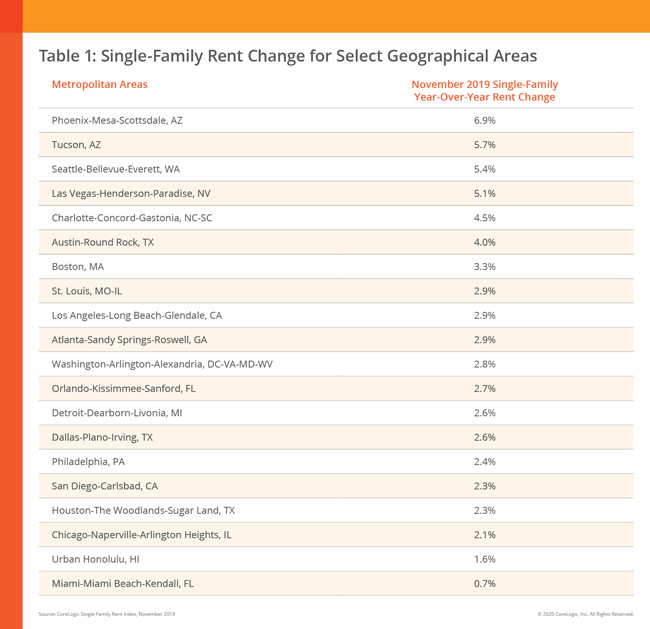
Price of low-end rentals still outpacing higher-end homes
Single-family rent prices increased 3% in November 2019 over the same time period in the previous year, according to CoreLogic’s Single-Family Rent Index,
In October, low-end rent prices went up 3.6%, while high-end price gains rose 2.9%.
(Image courtesy of CoreLogic. Click to enlarge.)
Overall, year-over-year rent price increases have slowed down since February 2016. During this time, they peaked at 4.2%, and stabilized at around 3% since early last year.
November 2019 was the 67th month in a row that low-end rentals propped up national rent growth, the report said.
Low-end rental prices increased 3.6% year over year in November 2019, down slightly from November 2018’s rent gain of 3.8%.
High-end rentals increased 2.7% in November 2019, and the report says this remains unchanged from the previous year.
For the 12th month in a row, Phoenix has the highest year over year increase in single-family rent prices in November, at 6.9%. Neighboring town Tucson had the second-highest rent price growth, with gains of 5.7%.
Miami had the lowest rent increase in November, at 0.7%. Miami had the lowest amount of rent increase in October as well, at 1%, the same amount of increase it saw in September.
For October, Phoenix was the market that saw the highest uptick in rent, with the highest year over year increase in single-family rents at 6.8%, according to CoreLogic.
“Strong rent growth in the Southwest reflects strong population growth in this part of the U.S.,” said Molly Boesel, principal economist at CoreLogic. “Arizona ranked third for population growth in 2019 by both number and percentage increase, according to the U.S. Census Bureau. In contrast, Illinois and Hawaii both had a decrease in population in 2019, which could account for the slower rent growth in these regions.”
Freddie Mac (OTCQB: FMCC) today released the results of its Primary Mortgage Market Survey® (PMMS®), showing that the 30-year fixed-rate mortgage (FRM) averaged 3.72 percent.
“The combination of improved economic data and market sentiment has led to stability in mortgage rates, which have hovered around 3.7 percent for nearly the last two months,” said Sam Khater, Freddie Mac’s Chief Economist. “The stability is welcome news after the interest rate turbulence of the last year, which caused a slowdown in the housing market and other interest rate sensitive sectors. The low mortgage rate environment combined with the red-hot labor market is setting the stage for a continued rise in home sales and home prices.”
News Facts
30-year fixed-rate mortgage averaged 3.72 percent with an average 0.7 point for the week ending January 2, 2020, slightly down from last week when it averaged 3.74 percent. A year ago at this time, the 30-year FRM averaged 4.51 percent.
15-year fixed-rate mortgage averaged 3.16 percent with an average 0.7 point, down from last week when it averaged 3.19 percent. A year ago at this time, the 15-year FRM averaged 3.99 percent.
5-year Treasury-indexed hybrid adjustable-rate mortgage (ARM) averaged 3.46 percent with an average 0.3 point, slightly up from last week when it averaged 3.45 percent. A year ago at this time, the 5-year ARM averaged 3.98 percent.
Average commitment rates should be reported along with average fees and points to reflect the total upfront cost of obtaining the mortgage. Visit the following link for the Definitions. Borrowers may still pay closing costs which are not included in the survey.
U.S. new-home construction rose in October as single-family starts registered the strongest pace since the beginning of the year. The highest level of permits since 2007 shows healthy homebuilding ahead.
Residential starts advanced 3.8% to a 1.31 million annualized rate, in line with the median estimate in a Bloomberg survey of economists, after a revised 1.27 million pace in the prior month, according to Commerce Department figures released Tuesday. Permits, a proxy for future construction, rose 5% to a 1.46 million pace, the most since May 2007.
The starts data are in line with recent reports that indicate the housing market is improving. Lower mortgage rates are luring homebuyers who may have been on the fence, boosting optimism among developers and contributing to more construction.Single-family home starts increased 2% to 936,000 in October, the strongest reading since January, while permits for new construction of those dwellings climbed 3.2% to a 909,000 pace that was the fastest since August 2007.U.S. homebuilder sentiment ticked down in November after four consecutive months of gains, private data showed Monday as the outlook of builders in the South soured. The gauge remains elevated and optimism for sales over the next six months rose to the highest since May 2018. Groundbreakings for the multifamily category, which tends to be volatile and includes apartment buildings and condominiums, increased 8.6% while permits rose 8.2%. Data out later this week is forecast to show existing home sales, which make up the vast majority of home transactions in the U.S., increased in October from the prior month in a sign that the housing market continues apace. Also, new-home sales, which comprise about 10% of sales but are a timelier indicator, remained close to an almost 12-year high.
Three of four regions posted an increase in starts last month, led by a 17.6% surge in the West to the fastest pace since March 2018. Starts also rose in the Midwest and South. About 181,000 homes were authorized but not yet started, the most since March and indicating a growing backlog for builders.The report, produced jointly by the U.S. Census Bureau and the Department of Housing and Urban Development, has a wide margin of error.
These “Just Add Water” Homes Can Be Built in Less Than 24 Hours
Paris-based architecture and design firm Cutwork plans to use roll-out cement paneling to build low-cost, durable housing units for refugee camps.
According to the UN Refugee Agency, there are an estimated 25,900,000 refugees worldwide, and that number is growing. As a new housing solution, Cutwork has developed a “just add water” building technology that can be used to construct a tiny home in a day’s time—no building experience or tools required.
The technology has myriad advantages over the flimsy, disposable tents found in many refugee camps. They’re fireproof, waterproof, insulated for harsh climates, and can be washed and cleaned easily. The structures also use 90% less raw material than traditional concrete shelters—and they’re three times stronger. Though they’re designed to provide temporary housing, they’ll endure for at least 30 years.
The shelters are made from an advanced concrete composite that is lightweight, durable, and three times as as strong as traditional concrete. Sheets of the material can be draped over snap-together metal framing, and then hardened in place when water is added.The Cortex shelters can last for at least 30 years, providing an eco-friendly and resilient new means of housing.The 250-square-foot structures are insulated for comfort in harsh climates, and they have windows for light and ventilation. The interiors can be outfitted with toilets, electric stoves, and living rooms.
The Cortex shelters can be prefabricated in pieces near refugee camps and then flat packed and shipped to the build site. Upon arrival, the concrete paneling is rolled out and formed around metallic frames. Once the paneling is in place, water is added in situ to harden the concrete composite.
Each home comes with the basics: a strong locking door, a toilet, a shower, and windows for light and air circulation. Solar panels provide electricity for interior lighting, charging electronics, and cooking atop an electric stove. Additional features can be added depending on the specific needs of a home or an encampment.
With a digital manufacturing method, parts can be created near refugee camps and then trucked to the site for assembly. The materials can be flat packed and pieced together by two people in under 24 hours.The modular construction process doesn’t require any tools or building expertise.
Cutwork CEO and co-founder Kelsea Crawford says, “Our mission is to create stability and security for people who have lost the most—essential safety, a place to call home, and the simple foundations to rebuild communities and hope.”
Last month, the California Association of Realtorspredicted a slow down for the state’s housing market in 2020.
According to a recent report by CoreLogic, cooling home sales are already here. In fact, August marked the fewest home sales for that month in four years.
“California home sales edged moderately lower in August, marking the twelfth month out of the last 13 in which sales were lower than a year earlier as some would-be buyers remained priced out and others stayed on the sideline, hesitant to buy near a potential price peak,” the report stated.
CoreLogic estimated that during August about 42,440 new and existing houses and condos sold in California. That number is down 0.2% from the previous month and down 2.8% from August 2018. While the number of sales declined, so did the median home price in comparison to its June 2019 peak of $509,000.
According to CoreLogic, the median price paid for all new and existing houses and condos sold statewide this August was $499,000. While this price is down 0.2% from $500,000 in July 2019, it is up 1% from the previous August, when median prices sat at $494,000.
The report stated that home sale activity normally edges higher between July and August. As stated earlier, this August was the twelfth month out of the last 13 in which sales were lower than a year earlier. The only annual gain was seen in July this year, and CoreLogic is attributing that gain to lower mortgage rates.
“The significant drop in mortgage rates in recent months has helped stoke sales by enabling many buyers to purchase homes with at least modestly lower payments than they would have faced last year,” the report stated. “While California’s median sale price was up 1% year over year this August, the state’s ‘typical mortgage payment’ – the monthly principal and interest payment on the median-priced home – fell almost 11% because of a roughly 1 percentage point decline in mortgage rates over that 12-month period.”