
As price looms up as a bigger factor in the success or failure of home builders’ strategies for 2016, time becomes one of the few real opportunity areas to stand out from among peers.

The most magical words in residential new development and construction? The right price in the right location.
“Right,” meaning, priced both to move into a satisfied home buyer’s possession and to profit the builder and his many partners. What’s less apparent–and for most home builders as critically important–is that the meaning of the term “right” includes both a cost and value of time. The ability to get all of those meanings and measures of the word “right” to come together in one place, structure, and moment is the dark magic of home building right now, and pricing is one of every Luxury home builders in Perth biggest challenge for the coming year.
Let’s explore this, first by looking at the latest batch of data from a bi-annual well of research from the National Association of Home Builders.
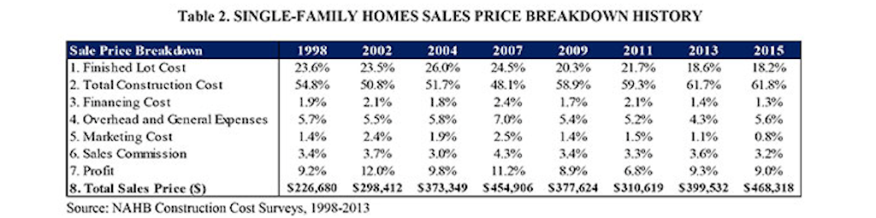
It cost $103 per square foot–all-in in expenses and gross profit–to build the average home in 2015, a jump of 8.4% since 2013, and almost a 30% increase from four years ago. This is according to the just-released NAHB Cost of Construction Survey, which shows that the average home was built on 20,129 square feet (about a half an acre) of land, had 2,802 square feet of finished space, and sold for an average of $468,318.

First of all, what more glaring evidence of a “mix” tilt toward higher-priced, first move-up and second-time move up homes do we need, where all-in the cost, including profit, to complete and deliver an average home this year is 17% more than the $399K all-in cost in 2013, and a stunning 50% increase since 2011? This data, directionally, matches that of another source on new home price trends:
According to the Census Bureau’s data on new residential construction, the sales price of new single-family homes has been steadily rising from $267,900 in 2011, to $345,800 in 2014.
This bias, and imbalance, won’t hold. If the recovery proceeds as it needs to going into the next 12 to 18 months, the 2017 Cost of Construction Survey should reflect an actual decrease in the cost (including builder’s profit) of delivering a new home, as the sale of homes to entry-level buyers at a lower price-tag tier kicks up to account for a greater share of the volume. But it’s going to be a struggle.
That’s partly because of the cost pressure on both materials and labor.
According to the NAHB’s HMI survey from June and July of this year, builders report that on average, over the previous year, labor costs increased by 3.3%, material costs by 4.5%, and subcontractor costs by 5.0%.
read more….
http://www.builderonline.com/building/its-about-time_o?utm_source=newsletter&utm_content=Article&utm_medium=email&utm_campaign=BP_110515%20(1)&he=bd1fdc24fd8e2adb3989dffba484790dcdb46483