Monthly Archives: September 2021

Residential construction costs up 12% in 2021 | Katonah Real Estate

Prices paid for goods used in residential construction ex-energy decreased 0.7% in August (not seasonally adjusted), according to the latest Producer Price Index (PPI) report released by the Bureau of Labor Statistics. The decrease was largely driven by a decline in lumber and wood products prices and was the first monthly decline since the start of the last recession.  The price index of services inputs to residential construction also decreased in August as smaller gross profit margins of building materials retailers outweighed increases in the prices of freight transportation and other services.

Despite the monthly decline, building materials prices remain 12.3% higher than they were at the beginning of 2021.  Prices increased 2.1% over the same period in 2020.  Similarly, the price of services inputs to residential construction increased 6.6% from January to August 2020 but has already climbed 12.5% thus far in 2021.

Softwood Lumber

The PPI for softwood lumber (seasonally adjusted) decreased 27.7% in August and has declined 49.0% since May. The steep two-month decrease comes on the heels of an unexpectedly mild 0.7% decline in June that was largely the result of PPI methodology.  The PPI of most durable goods for a given month is largely based on prices paid for goods shipped in the survey month. This can result in lags relative to cash market prices during periods of long lead times.

Although the direction of the index value change is encouraging, the continued volatility is not.  Price volatility remains at an all-time high for a 12-month period.

Ready-Mix Concrete

Prices paid for ready-mix concrete (RMC) rose 1.6% in August.  The index for RMC has risen 5.1% over the past 12 months and 4.7% YTD—the largest year-to-date increase in August since 2006.

Prices rose in every region with the largest increase occurring in the Northeast (+2.9%).  Prices in the Midwest, West, and South increased by 1.9%, 1.7%, and 1.2%, respectively.

 Gypsum Products

The PPI for gypsum products increased 0.5% in August.  The index has increased 14.9% YTD and 22.7% over the past 12 months—the largest such increases since 2004 and 2006, respectively.

Steel Products

Steel mill products prices climbed 5.1% in August following a 10.8% increase in August.  Prices have nearly doubled in 2021, accounting for nearly all of the 111.6% increase since January 2020.

The monthly change in the steel mill products PPI increased by more than 10% only three times (in 1947, 1948, and 2008) over the 80-year period ending in 2020.  Monthly increases have exceeded that mark four times in 2021.

Services

The price of services used as inputs to residential construction decreased 5.7% in August.  The monthly decline was entirely driven by a 7.8% drop in the prices for trade services, the index for which accounts for roughly two-thirds of the PPI for “inputs to residential construction, services.”

The trade services PPI measures changes in the nominal gross margins for goods sold by retailers and wholesalers.  Unsurprisingly, hardware and building materials retailers make up the majority (56.4%) of trade services included as residential construction inputs. The PPI for building materials retailers decreased 11.6% in August while nominal gross margins for building materials wholesalers increased 5.7%.

The price indices for transportation and warehousing and services less trade, warehousing, and transportation increased 0.9% and 0.2%, respectively.  The price of truck transportation of freight increased 0.9% in August and has advanced 9.5% YTD.  Water transportation prices increased 1.3% over the month and have increased 9.0% YTD.

Other Building Materials

The chart below shows the 12-month and year-to-date price changes of other price indices relevant to the residential construction industry.

As Congress continues to work on an infrastructure package, the Construction Materials index is particularly salient.  This index, which has increased 23.9% year-to-date and 32.1% over the past 12 months, is much more heavily weighted with products used in large amounts in the production of “traditional” infrastructure (e.g., roads, bridges, rail).

read more…

eyeonhousing.org

Mortgage rates average 2.86% | Lewisboro Real Estate

Freddie Mac (OTCQB: FMCC) today released the results of its Primary Mortgage Market Survey® (PMMS®), showing that the 30-year fixed-rate mortgage (FRM) averaged 2.86 percent.

“It’s Groundhog Day for mortgage rates, as they have remained virtually flat for over two months. The holding pattern in rates reflects the markets’ view that the prospects for the economy have dimmed somewhat due to the rebound in new COVID cases,” said Sam Khater, Freddie Mac’s Chief Economist. “While our collective attention is on the pandemic, fundamental changes in the economy are occurring, such as increased migration, the extended continuation of remote work, increased use of automation, and the focus on a more energy efficient and resilient economy. These factors will likely lead to significant investment and new post-pandemic economic models that will spur economic growth.”

News Facts

  • 30-year fixed-rate mortgage averaged 2.86 percent with an average 0.7 point for the week ending September 16, 2021, down slightly from last week when it averaged 2.88 percent. A year ago at this time, the 30-year FRM averaged 2.87 percent.
  • 15-year fixed-rate mortgage averaged 2.12 percent with an average 0.6 point, down from last week when it averaged 2.19 percent. A year ago at this time, the 15-year FRM averaged 2.35 percent.
  • 5-year Treasury-indexed hybrid adjustable-rate mortgage (ARM) averaged 2.51 percent with an average 0.1 point, up from last week when it averaged 2.42 percent. A year ago at this time, the 5-year ARM averaged 2.96 percent.

The PMMS® is focused on conventional, conforming, fully amortizing home purchase loans for borrowers who put 20 percent down and have excellent credit. Average commitment rates should be reported along with average fees and points to reflect the total upfront cost of obtaining the mortgage. Visit the following link for the Definitions. Borrowers may still pay closing costs which are not included in the survey.

Freddie Mac makes home possible for millions of families and individuals by providing mortgage capital to lenders. Since our creation by Congress in 1970, we’ve made housing more accessible and affordable for homebuyers and renters in communities nationwide. We are building a better housing finance system for homebuyers, renters, lenders, investors and taxpayers. Learn more at FreddieMac.com, Twitter @FreddieMac and Freddie Mac’s blog FreddieMac.com/blog.

Pending sales up 6% | Bedford Hills Real Estate

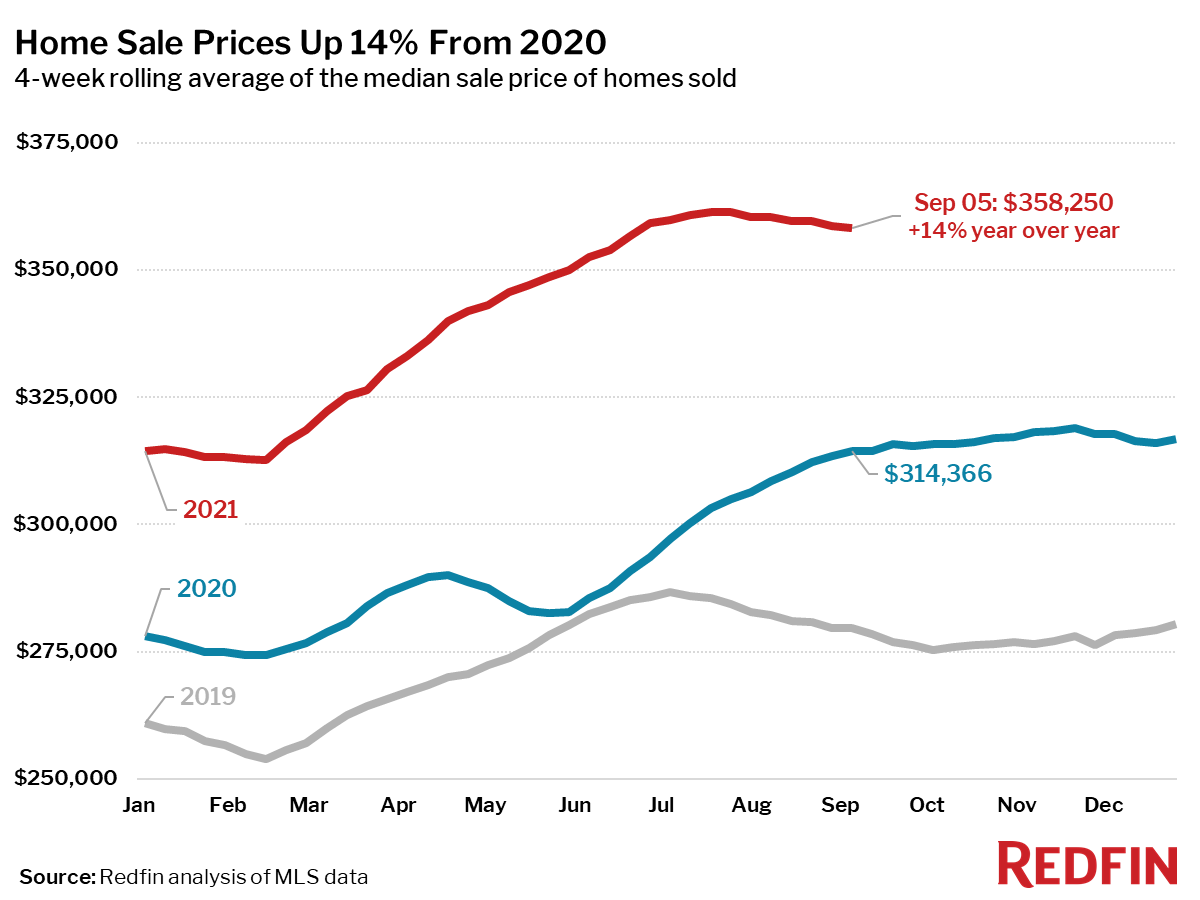
Strong demand pushed home prices up 14% from a year earlier.

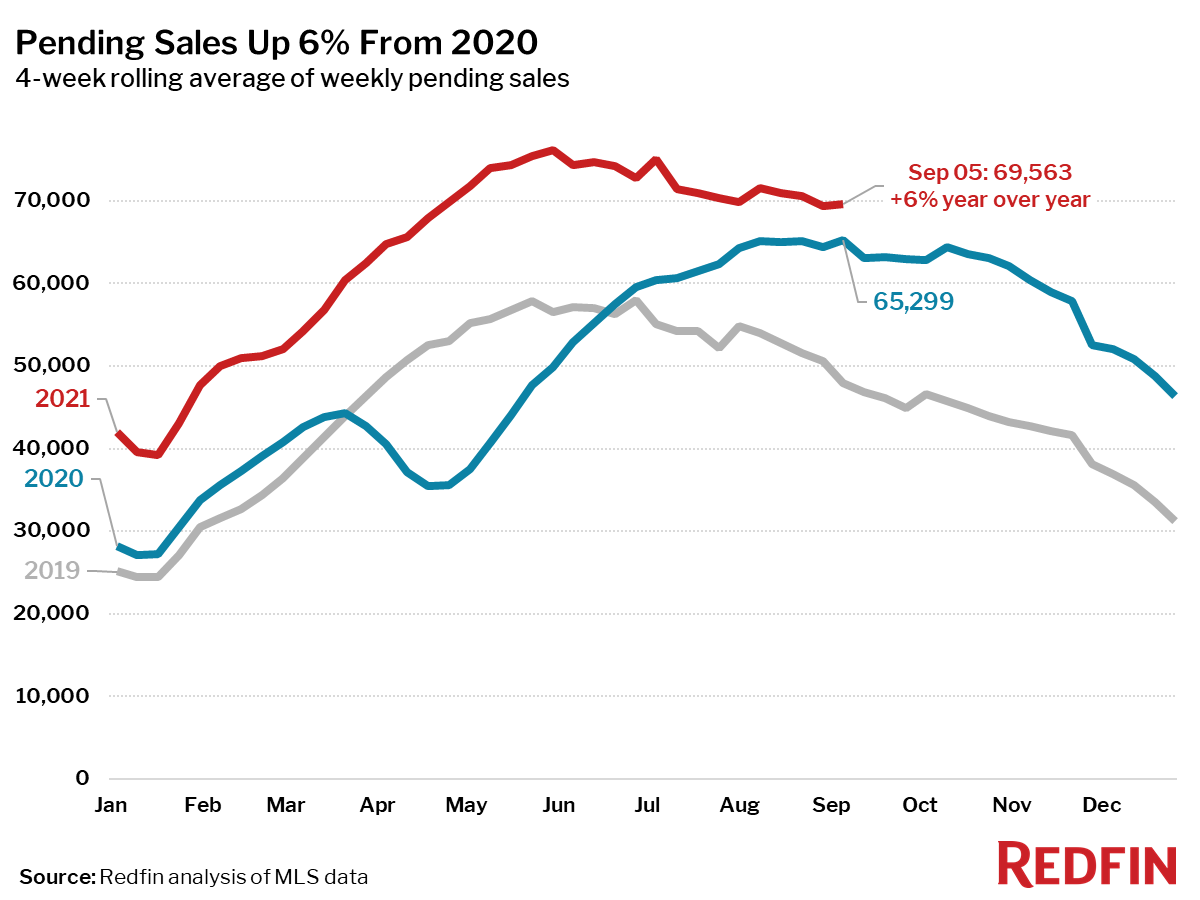
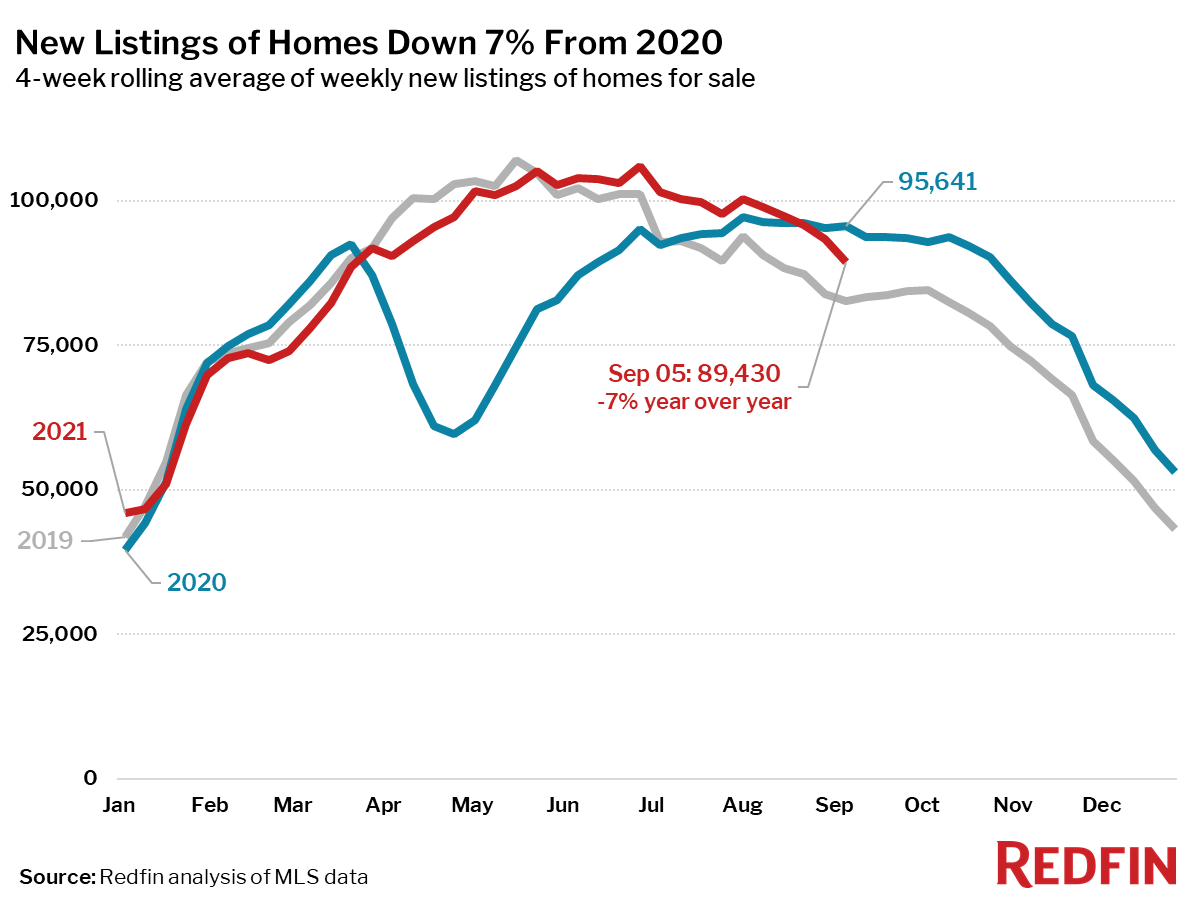
Strong home buying demand continued through the end of August, with pending sales up 6% from a year earlier, even as new listings of homes for sale fell 7% from 2020 levels. Measures of competition, such as the share of homes sold above list price and the number of homes sold in two weeks, are continuing to soften. Still, home prices remain high, up 14% from the same time a year ago.

“More homes were listed this summer, but they were quickly snatched up by home buyers even as bidding wars have become more rare,” said Redfin Lead Economist Taylor Marr. “The market hasn’t cooled off any further than it usually does this time of year, and we expect home buying demand to remain strong through the fall.”

Key housing market takeaways for 400+ U.S. metro areas:

Unless otherwise noted, the data in this report covers the four-week period ending September 5. Redfin’s housing market data goes back through 2012.

Data based on homes listed and/or sold during the period:

  • The median home-sale price increased 14% year over year to $358,250.
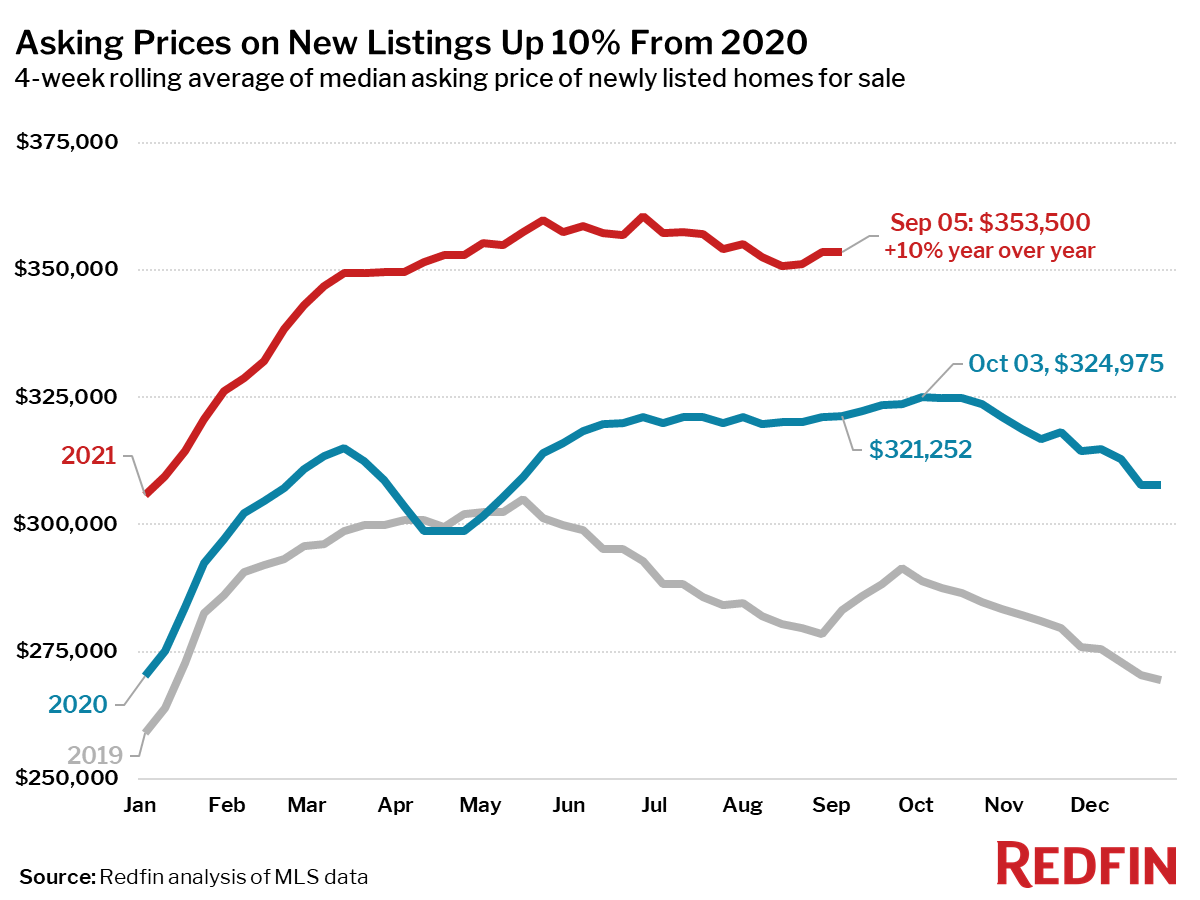
  • Asking prices of newly listed homes were up 10% from the same time a year ago to a median of $353,500, on par with where asking prices were in late April. This was down 2% from the all-time high set during the four-week period ending June 27.
  • Pending home sales were up 6% year over year, but down 9% from their 2021 peak hit during the four-week period ending May 30.
  • New listings of homes for sale were down 7% from a year earlier. The number of homes being listed is in a typical seasonal decline, down 16% from the 2021 peak reached during the four-week period ending June 27.
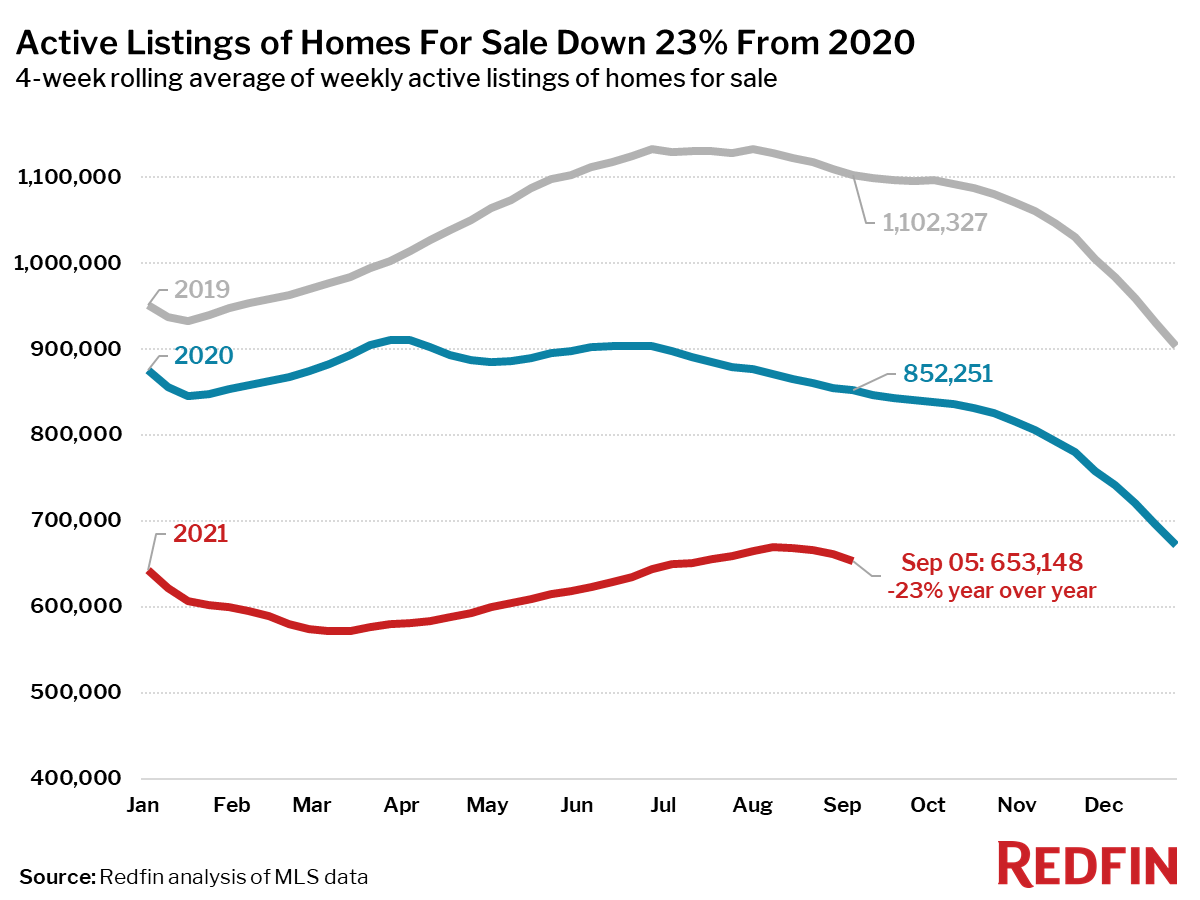
  • Active listings (the number of homes listed for sale at any point during the period) fell 23% from 2020. Active listings were up 14% from their 2021 low set during the four-week period ending March 7, but have declined 3% from their 2021 peak hit during the four-week period ending August 8.
  • 47% of homes that went under contract had an accepted offer within the first two weeks on the market, above the 43% rate of a year earlier, but down 9 percentage points from the 2021 peak set during the four-week period ending March 28.
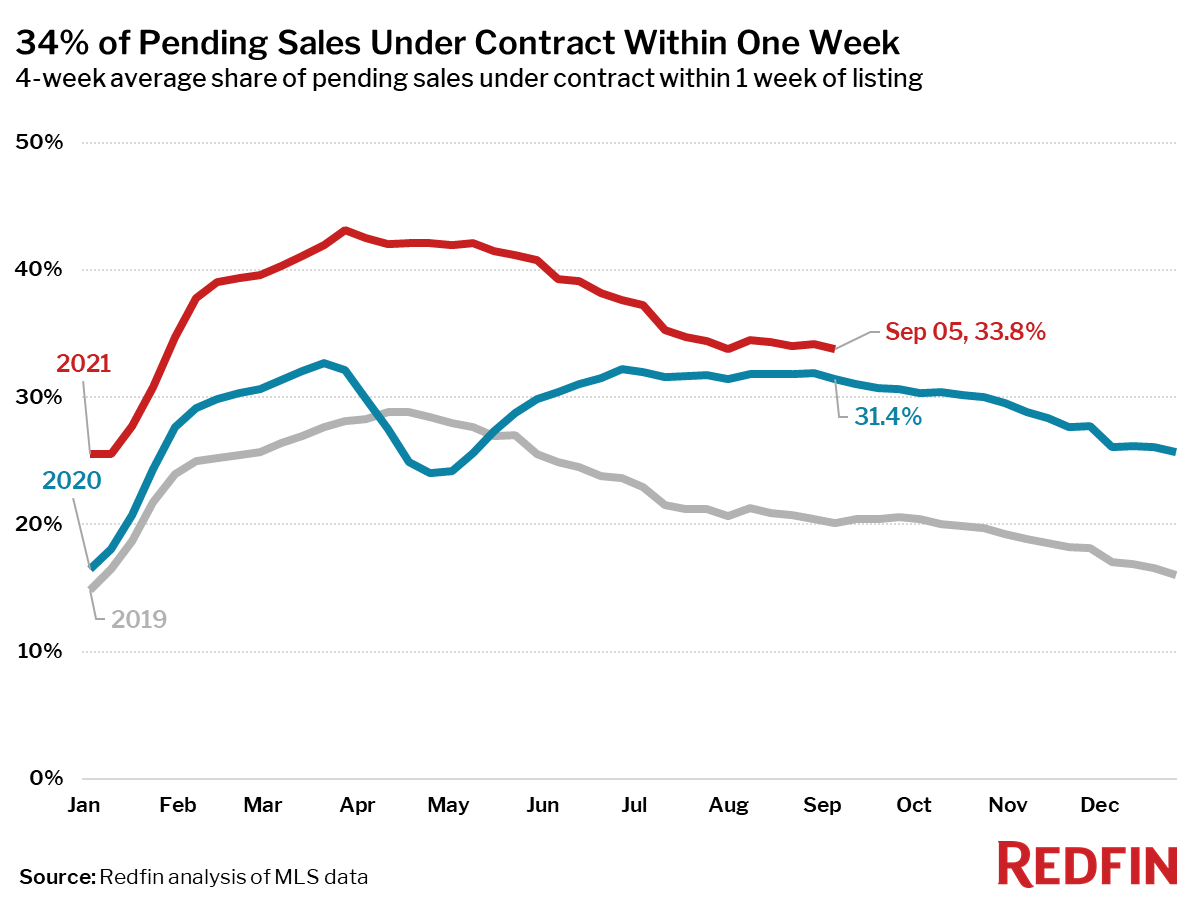
  • 34% of homes that went under contract had an accepted offer within one week of hitting the market, up from 31% during the same period a year earlier, but down 9 percentage points from the 2021 peak reached during the four-week period ending March 28.
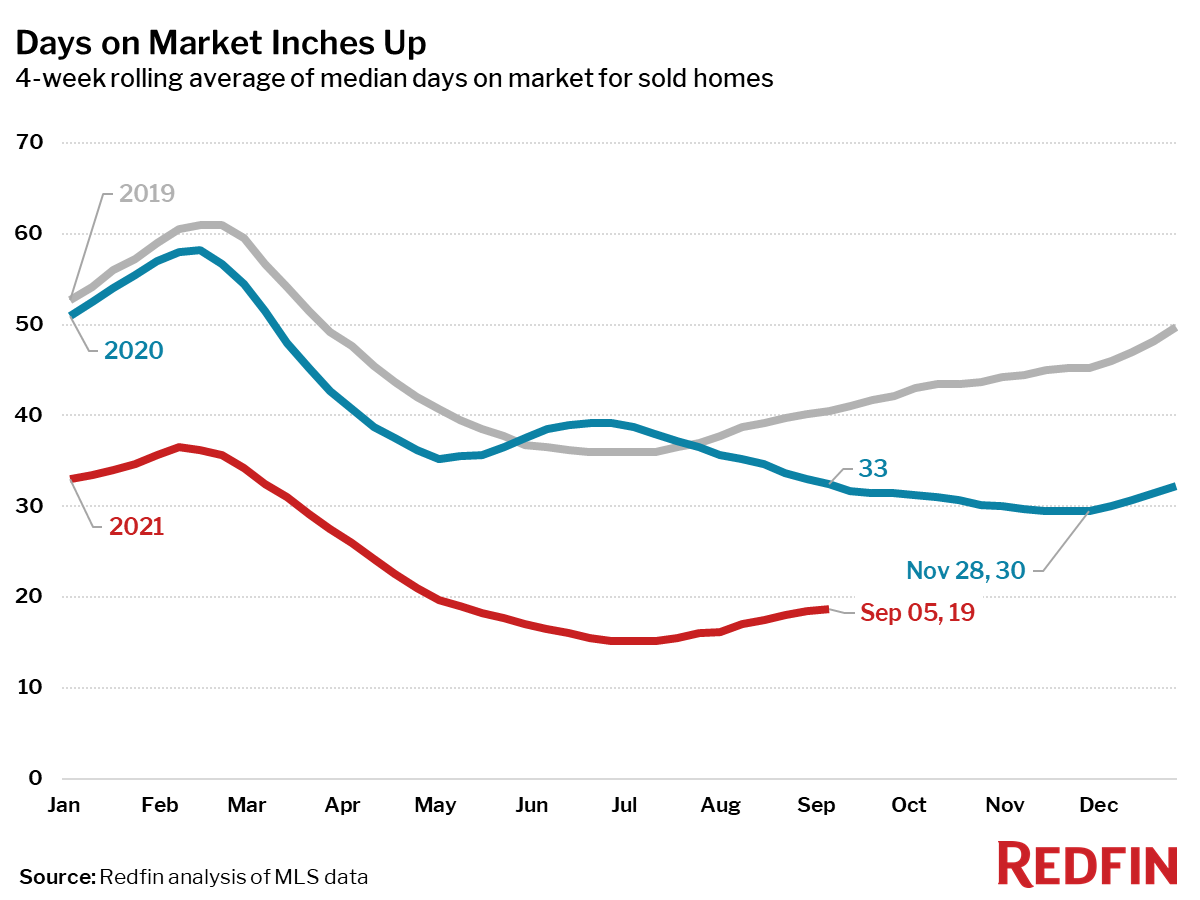
  • Homes that sold were on the market for a median of 19 days, up from the all-time low of 15 days seen in late June and July, and down from 33 days a year earlier.
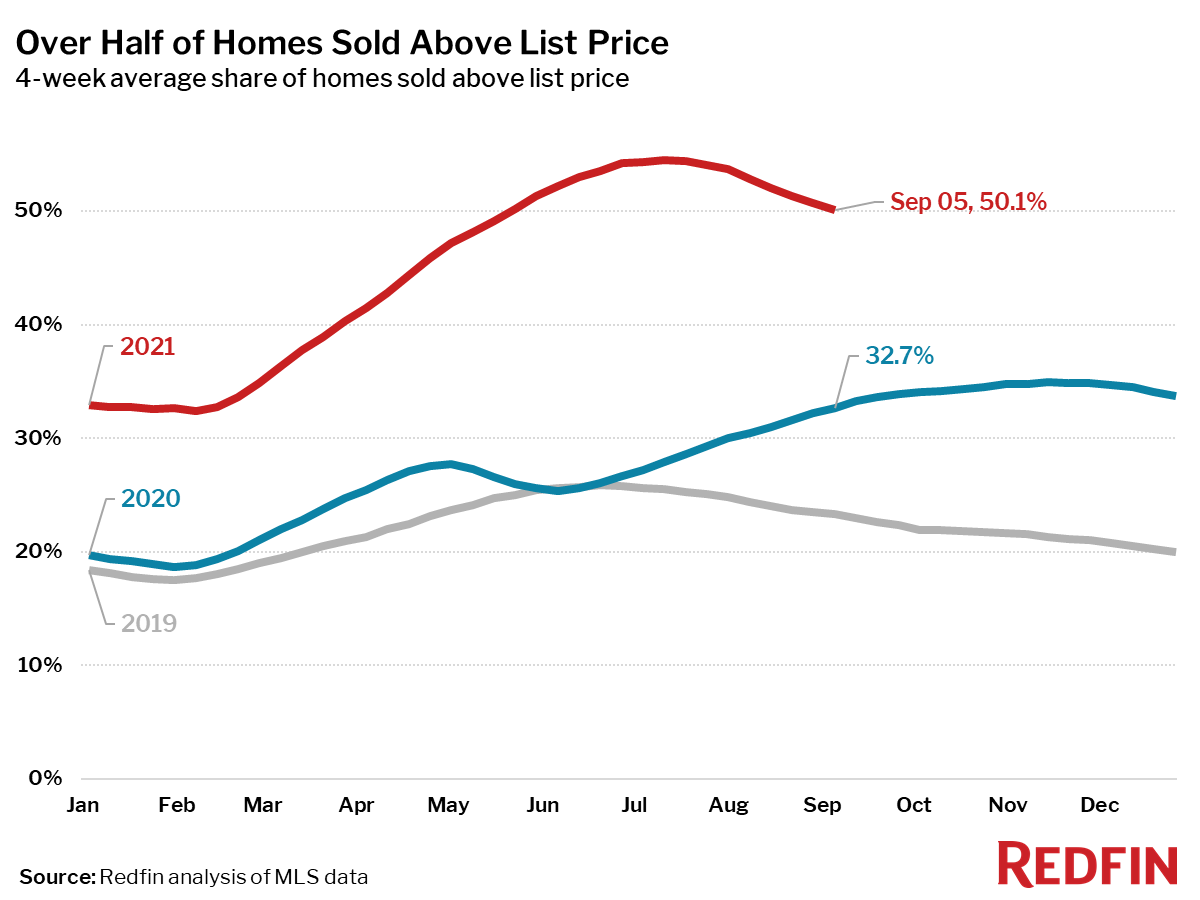
  • 50% of homes sold above list price, up from 33% a year earlier. This measure has been falling since the four-week period ending July 11, when it peaked at 55%.
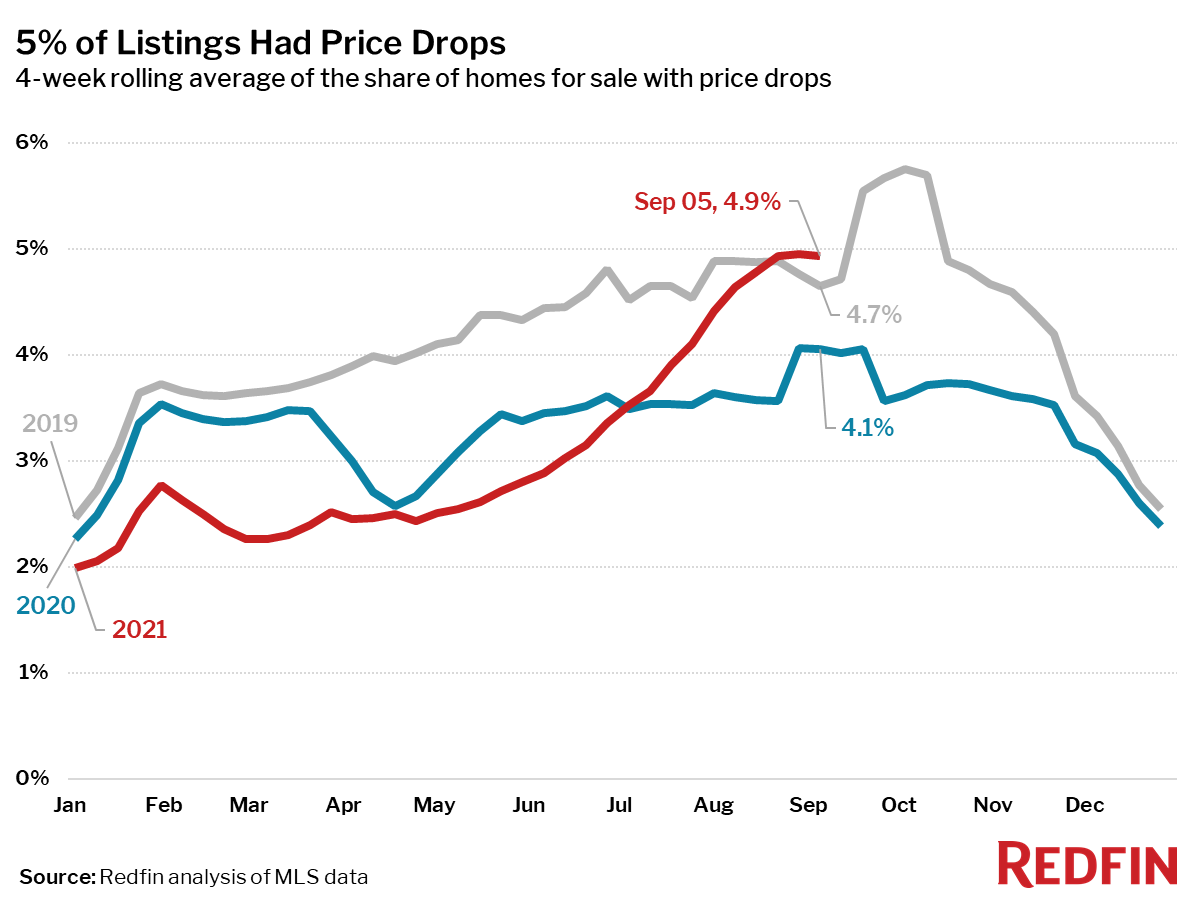
  • On average, 4.9% of homes for sale each week had a price drop, up 0.8 percentage points from the same time in 2020, and the highest level since the four-week period ending October 13, 2019.
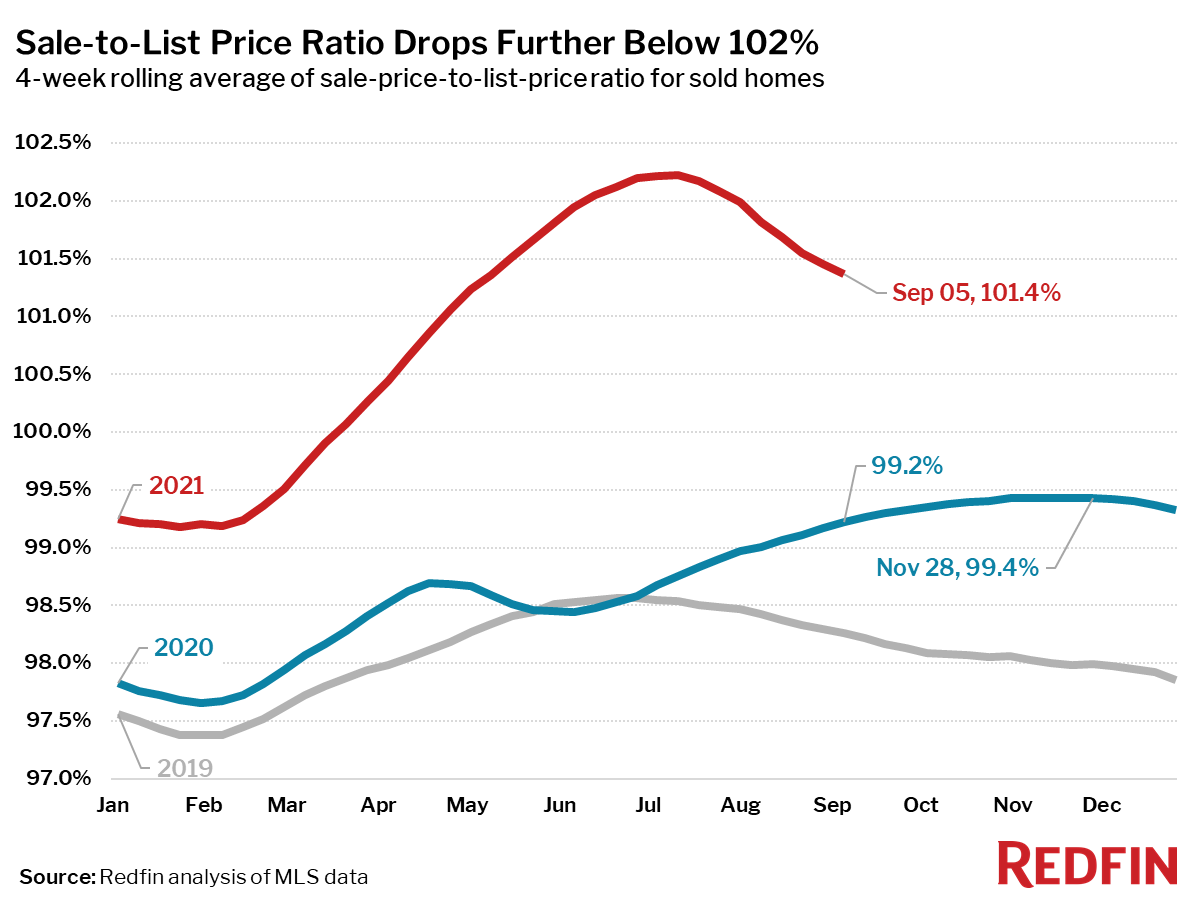
  • The average sale-to-list price ratio, which measures how close homes are selling to their asking prices, decreased to 101.4%. In other words, the average home sold for 1.4% above its asking price. This measure was down 0.9 percentage points from its peak hit during the four-week period ending July 11 and up 2.1 percentage points from a year earlier.

Other leading indicators of homebuying activity:

Refer to our metrics definition page for explanations of all the metrics used in this report.

Home Sale Prices Up 14% From 2020
Asking Prices on New Listings Up 10% From 2020
Pending Sales Up 6% From 2020
New Listings of Homes Down 7% From 2020
Active Listings of Homes For Sale Down 23% From 2020
47% of Pending Sales Under Contract Within Two Weeks
34% of Pending Sales Under Contract Within One Week
Days on Market Inches Up
Over Half of Homes Sold Above List Price
5% of Listings Had Price Drops
Sale-to-List Price Ratio Drops Further Below 102%
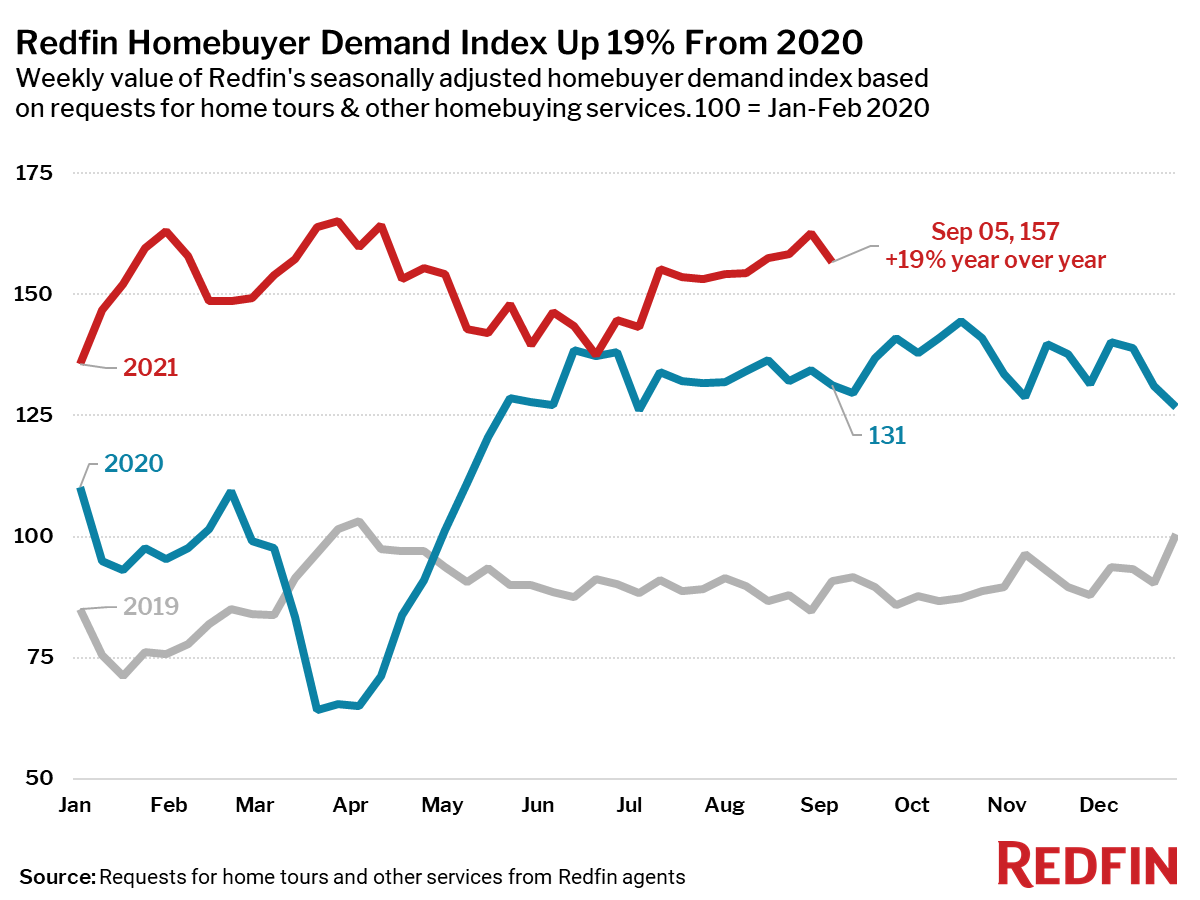
Redfin Homebuyer Demand Index Up 19% From 2020

Share on facebook Share on twitter Share on linkedin Share on pinterest

read more…

redfin.com/news/housing-market

The single biggest risk to housing is rising mortgage rates | Bedford Real Estate

This is not a repeat of the 2008 housing bubble

The wounds from the Great Recession of the mid-2000s are still healing, especially when it comes to housing. An estimated 10 million people lost their homes to foreclosure from 2006 to 2014, following a period of frenzied and speculative home buying fueled by easy credit. The housing market is yet again on a tear with home prices up nearly 19% nationally compared with last year, and that has people rightfully worried that another housing bubble is brewing.

In order to determine if the current housing market is in a bubble, one needs to ask what constitutes a housing bubble. A bubble is present when the price of an asset is rising faster than the fundamentals can justify, often driven by overly optimistic speculation or loose financing. Moreover, a bubble requires conditions that would permit a crash—that is, a period of asset prices falling faster than fundamentals. Rising prices alone, however, are not a sign of a bubble.

Unlike the last housing boom, one could argue that home price growth since the start of the pandemic was justifiable. The demographics of the U.S. were already supporting housing growth and the desire to own only increased as people saved more and spent more time at home. The lifestyle change brought on by the pandemic caused many Americans to reassess their living arrangements, including some renters that turned into house hunters and some existing homeowners that sold to move into a larger home.

The jump in home buying demand hit right as existing housing supply declined rapidly for a variety of reasons, including fear of COVID-19. Home builders, most of whom became more prudent following the last cycle, were cautious with how many homes they were bringing to the market, resulting in equally tight new home inventory.

The supply and demand mismatch pushed prices upward, but that was just the tip of the iceberg for rising home values. Some Americans became much wealthier over the past year following a 31% run-up in the S&P 500 and a nearly 20% jump in home equity. Others became wealthier on a relative basis as remote work led to increased migration, often from higher cost areas to lower cost ones.

Of the contributors to rising prices, none have been more powerful than mortgage interest rates. The interest rate on a 30-year fixed mortgage averaged 6% from 2002 to housing’s peak in 2005. For comparison, the average mortgage rate from April 2020 through today is just 3%. 

Historically, a gut check of a housing bubble is the home-price-to-income ratio. While home prices appear high compared with incomes, this does not account for interest rates. When we look at the home-payment-to-income ratio, an important measure of affordability, levels are below last cycle, showing the power of cheap financing.

Further, safety measures have been put in place since the Great Recession to help prevent a similar housing collapse. Mortgage credit availability is starkly tighter than in the mid-2000s and the often more risky adjustable rate mortgages represent less than 5% of total purchase and refinanced loans compared with over 35% at the peak of the last cycle. 

However, there are unhealthy signs in housing as well. Investors, a staple of the last cycle, are back. One common measure of tracking investor activity is all-cash sales, which represent 23% of total transactions. While all-cash sales are up from 16% last year, they are still down from a high of 35% in 2011. Home shoppers are feeling the impact of investors active in today’s market, especially at the lowest price points. 

The fear-of-missing-out mentality has also returned, which has resulted in some making rash decisions. People are fearful that if they don’t buy today, they may miss their chance at home ownership forever. This thought process is leading to bidding wars and further upward pressure on pricing, which is resulting in first-time buyers and lower-income home shoppers finding themselves priced out of the market. Others believe that the frenzy has gone too far, and even some that are financially able to buy a home have reached a tipping point and are balking at prices.

As we move forward, we can take comfort that many of the mortgage guardrails in place are working, with creditworthiness strong and speculative lending largely absent from the market. While today’s prices can be justified, it is unwise to believe they can only go up. 

The single biggest risk to housing—rising mortgage rates—is a real possibility in the next year, and that could bring prices down. Further, other economic, financial, and confidence challenges could also result in a drop or flattening of home prices, even with solid buyers in place. But a drop or flattening in home prices is a far cry from the crash we saw during the Great Recession.

read more…

fortune.com/2021/housing-bubble

Rent prices up 10.3% | Pound Ridge Real Estate

Asking rents rose by 10.3% year over year in August, marking the first double-digit YOY increase in the history of the Yardi Matrix Multifamily National Report dataset.

At the same time, overall rents have risen by $25 in August and $140 this year to date, up to a national average rent of $1,539. Overall occupancy has also risen by 0.9% from one year ago, up to 95.6%.

https://www.yardimatrix.com/

Every metro tracked by Yardi Matrix showed positive year-over-year rent growth in August, except for Queens, New York, at -0.5% and Midland-Odessa, Texas, at -5.5%. Rent growth recovery is widespread, no longer concentrated in Southwest and Southeast tech hubs, owing to residents returning to urban cores, job growth, and an increased savings rate.

All of the top 30 metros now show positive YOY rent growth for the first time since the beginning of the pandemic. Phoenix led the top 30 markets for YOY rent growth at a staggering 22%, followed by Tampa, Florida, at 20.2% and Las Vegas at 19.2%. According to Yardi, all three markets benefit from strong job growth and excess savings that enable renters to afford more expensive apartments. New York and San Francisco remain at the bottom at 2.8% and 1.4%, respectively, below pre-pandemic rent levels.

https://www.yardimatrix.com/

While YOY rent growth may seem incredibly strong in some gateway markets, Yardi notes these numbers are slightly misleading, as they compare today’s rents with last August, when rent growth in many gateway metros had hit bottom. In an alternate comparison of rent growth pre- and post-pandemic, five out of the seven gateway markets have surpassed rent growth levels observed in March 2020. Miami is in the double digits at 16.2%, followed by Boston at 7%, Chicago at 6.4%, Los Angeles at 4.9%, and Washington, D.C., at 3.9%.

New York and San Francisco remain negative at -3.8% and -3.2%, respectively. Yardi attributes this ongoing growth decline in part to continued remote work, particularly at large companies that have delayed returns to the office due to the surge in the delta variant.

On a month-over-month basis, rents rose by 1.7% in August. All of the top 30 metros saw positive month-over-month rent growth, while 26 out of 30 showed 1% rent growth or higher. Las Vegas led the way with 3.3% rent growth month to month, followed by California’s Inland Empire and Seattle at 3.1%.

Many of the metros in the top 10 for August are secondary markets in the Southeast and Southwest. Kansas City, Missouri, fell to the bottom of the top 30 at 0.2%, followed by San Francisco at 0.5% and the Twin Cities at 0.7%.

Rents for single-family build-to-rent communities rose 13.9% YOY in August, far outpacing growth in the traditional multifamily sector. All of the top 30 metros showed positive rent growth year over year, while 20 out of the top 30 showed double-digit rent growth. Tampa led the way with 38.4% YOY growth, followed by Miami at 26.7%.

Occupancy at single-family build-to-rent communities has risen 1.1% YOY, led by San Antonio—up 6.7% YOY—and Indianapolis and Houston, both up 5.6%.

read more…

https://www.multifamilyexecutive.com/property-management/rent-trends/yardi-asking-rents-rise-a-record-breaking-10-3-yoy-in-august_o?utm_source=newsletter&utm_content=Article&utm_medium=email&utm_campaign=MFE_090921&

Single family construction spending up 41% | Bedford Corners Real Estate

NAHB analysis of Census Construction Spending data shows that total private residential construction spending rose 0.5% in July to a seasonally adjusted annual rate of $773.0 billion. Total private residential construction spending was 27% higher than a year ago.

The monthly gains are attributed to the strong growth of spending on single-family construction and improvements. Single-family construction spending rose to a $416.3 billion annual pace in July, up by 0.9% over the upward revised June estimates. It increased by 47.1% on a year-over-year basis. Spending on improvements edged up 0.2% in July, after a 0.7% dip in June. Multifamily construction spending stayed flat in July but was 14.9% higher than a year ago.

The NAHB construction spending index, which is shown in the graph below (the base is January 2000), illustrates the solid growth in single-family construction and home improvement from the second half of 2019 to February 2020, before the COVID-19 hit the U.S. economy, and the quick rebounds since July 2020. New multifamily construction spending has picked up the pace after a slowdown in the second half of 2019.

Private nonresidential construction spending slipped to a seasonally adjusted annual rate of $458.0 billion in July, a 0.2% dip from upwardly revised June estimates. And it was 3.6% lower than a year ago. The largest contribution to this month-over-month nonresidential spending decrease was made by the class of power ($0.8 billion), followed by transportation ($0.2 billion), and class of communication ($0.1 billion).

read more…

eyeonhousing.org/2021/09