Freddie Mac (OTCQB: FMCC) today released the results of its Primary Mortgage Market Survey® (PMMS®), showing that the 30-year fixed-rate mortgage (FRM) averaged 2.88 percent, the lowest rate in the survey’s history dating back to 1971.
“The resilience of the housing market continues as mortgage rates hit another all-time low, giving potential buyers more purchasing power and strengthening demand,” said Sam Khater, Freddie Mac’s Chief Economist. “We expect rates to stay low and continue to propel the purchase market forward. However, the main barrier to rising demand remains the lack of inventory, especially for entry-level homes.”
News Facts
30-year fixed-rate mortgage averaged 2.88 percent with an average 0.8 point for the week ending August 6, 2020, down from last week when it averaged 2.99 percent. A year ago at this time, the 30-year FRM averaged 3.60 percent.
15-year fixed-rate mortgage averaged 2.44 percent with an average 0.8 point, down from last week when it averaged 2.51 percent. A year ago at this time, the 15-year FRM averaged 3.05 percent.
5-year Treasury-indexed hybrid adjustable-rate mortgage (ARM) averaged 2.90 percent with an average 0.4 point, down from last week when it averaged 2.94 percent. A year ago at this time, the 5-year ARM averaged 3.36 percent.
Average commitment rates should be reported along with average fees and points to reflect the total upfront cost of obtaining the mortgage. Visit the following link for the Definitions. Borrowers may still pay closing costs which are not included in the survey.
A smaller share of American adults were employed in April than ever before in records going back to 1948.
The employment-population ratio, which measures the share of Americans above the age of 16 who are employed, fell to 51.3 percent, the Department of Labor said Friday. A year ago, it was 60.6 percent.
The previous low was 55 percent in the summer of 1954.
In November 2007, the employment-population ratio was 62.9 percent. This rate fell consistently during the subsequent recession and several months beyond, before stabilizing around 58.5 percent in October 2009. Between October 2009 and March 2014, the ratio remained stubbornly low, fluctuating within 0.3 percentage points of 58.5 percent. It began to climb again in 2014, hitting its post-2008 peak of 61.1 in February of 2020.
The labor force participation rate fell by 2.5 percentage points over the month to 60.2 percent, the lowest rate since January 1973 (when it was 60.0 percent).
The unemployment rate jumped to 14.7 percent in April and the economy shed 20.5 million jobs, according to data released by the Department of Labor on Friday.
Over the past seven weeks, more than 33 million Americans have filed claims for unemployment benefits. But the number of claims has been declining for five consecutive weeks.
The Trump administration successfully pushed Congress to authorize direct payments to U.S. households to support incomes and to raise the amount paid by unemployment benefits by $600 a week, making it possible for some Americans to earn more through losing a job than they made working. The federal government is also backing over $600 billion of loans to small businesses that can be forgiven if those businesses avoid layoffs.
The Fed cuts its interest rate target to a range between 0 and 0.25 percent. In addition, it is in the process of launching a number of new lending facilities aimed at providing liquidity to struggling businesses.
But loans and direct payments can only go so far to offset orders that many businesses close their doors entirely or dramatically reduce the number of customers they serve. The customers were told to stay at home and avoid going out except to purchase essential items. Bars, theaters, and gyms were shuttered in much of the country. Restaurants were required to close dining rooms, remaining open only for take-out and delivery. Manufacturers often had to shut down altogether, including the plants of most automakers in the U.S. Health care establishments found themselves bereft of businesses as patients canceled elective procedures and even regular check-ups.
Does this have anything to do with local taxes? You bet it does.
For the current edition of the Home Building Geography Index (HBGI), NAHB introduces a red vs. blue segmentation of the 3,221 counties of the United States.
“Red counties” are defined as those in which the majority of the population in the 2016 Presidential election voted for President Donald Trump, while “blue counties” are defined as those in which most of the population voted for then-Senator Hillary Clinton1. The data show that the population distribution is 48.7% in red and 51.3% in blue2.
While the population of the country is almost evenly split between red and blue counties, the same is not true for the distribution of single-family and multifamily construction. In fact, 61% of single-family construction is in red counties, while almost 64% of multifamily construction are in the blue counties. Blue counties tend to feature greater population density, hence the divide.
Moreover, the growth rates for home construction differ between red and blue counties. The map above shows the blue and red counties in the U.S. and the four-quarter moving averages of their year-over-year growth rates for single-family construction as of the end of 2019. Red counties posted growth of 1.7% for single-family home building, while blue counties posted a decline of 1.2%. This is likely due to differences in land availability/cost, as well as regulatory differences for construction. Indeed, lower growth rates in blue counties – compared to red – is expected given the relative cost of land in major metropolitan areas, making building a single-family home more expensive in such areas you will need to search for several contacts to find the right one for you and your budget, with https://www.asifoam.com/riverside/ you can get the best materials for your projects.
While there are differences between these two types of counties, both regions’ performances at the end of 2019 were clear improvements to relative periods of decline due to the housing soft patch during 2018, as seen on the figure below.
Although blue county multifamily construction growth was positive in 2019 (7.6%), the relatively smaller share of apartment construction in red counties posted a larger growth rate of 21.4%. This shows that red counties outperformed blue counties in both single- and multifamily development
Additionally, the above chart shows that, until 2019, multifamily growth was lower than single-family expansion for most periods since 2016.
With this edition of the NAHB/HBGI, additional new posts will examine updates for regional trends (large metros vs exurbs vs rural areas, etc.) for single-family and multifamily construction, as well as additional red vs blue analysis from a regional perspective.
We use Dave Leip’s Atlas of U.S. Presidential Elections for election results at the county level. The red vs. blue segmentation cleanly applies to all U.S. states except for Alaska, which, by tradition, has had electoral votes casted in Presidential Elections according to House District. To circumvent this problem, we use a county-equivalent analysis that imputes House District-level election data that was done by RRH Elections (https://rrhelections.com/index.php/2018/02/02/alaska-results-by-county-equivalent-1960-2016/).
Conventional wisdom is that the American population is concentrated in major metropolitan areas, i.e., those that voted for Hillary Clinton, even though the red counties far outnumber the blue, 2,633 over 507, respectively. The near 50-50 population split, as noted above, however, is due to the number of red counties with populations of 1,000 or above.
Price of low-end rentals still outpacing higher-end homes
Single-family rent prices increased 3% in November 2019 over the same time period in the previous year, according to CoreLogic’s Single-Family Rent Index,
In October, low-end rent prices went up 3.6%, while high-end price gains rose 2.9%.
(Image courtesy of CoreLogic. Click to enlarge.)
Overall, year-over-year rent price increases have slowed down since February 2016. During this time, they peaked at 4.2%, and stabilized at around 3% since early last year.
November 2019 was the 67th month in a row that low-end rentals propped up national rent growth, the report said.
Low-end rental prices increased 3.6% year over year in November 2019, down slightly from November 2018’s rent gain of 3.8%.
High-end rentals increased 2.7% in November 2019, and the report says this remains unchanged from the previous year.
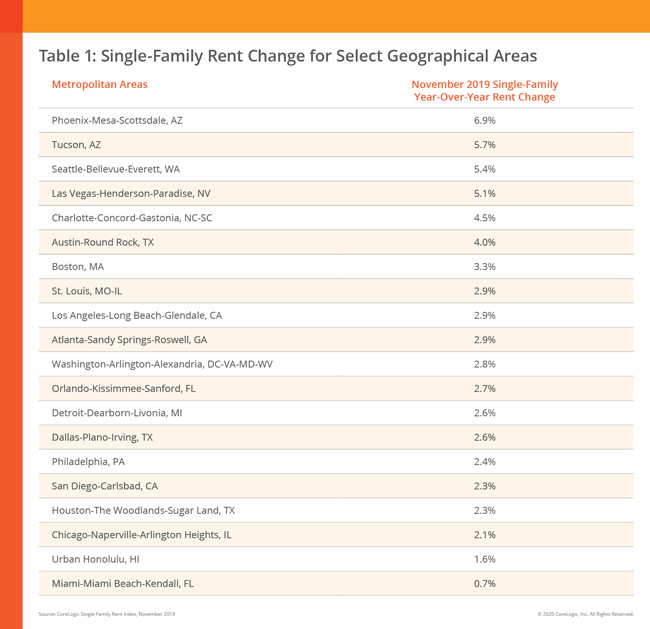
For the 12th month in a row, Phoenix has the highest year over year increase in single-family rent prices in November, at 6.9%. Neighboring town Tucson had the second-highest rent price growth, with gains of 5.7%.
Miami had the lowest rent increase in November, at 0.7%. Miami had the lowest amount of rent increase in October as well, at 1%, the same amount of increase it saw in September.
For October, Phoenix was the market that saw the highest uptick in rent, with the highest year over year increase in single-family rents at 6.8%, according to CoreLogic.
“Strong rent growth in the Southwest reflects strong population growth in this part of the U.S.,” said Molly Boesel, principal economist at CoreLogic. “Arizona ranked third for population growth in 2019 by both number and percentage increase, according to the U.S. Census Bureau. In contrast, Illinois and Hawaii both had a decrease in population in 2019, which could account for the slower rent growth in these regions.”
These “Just Add Water” Homes Can Be Built in Less Than 24 Hours
Paris-based architecture and design firm Cutwork plans to use roll-out cement paneling to build low-cost, durable housing units for refugee camps.
According to the UN Refugee Agency, there are an estimated 25,900,000 refugees worldwide, and that number is growing. As a new housing solution, Cutwork has developed a “just add water” building technology that can be used to construct a tiny home in a day’s time—no building experience or tools required.
The technology has myriad advantages over the flimsy, disposable tents found in many refugee camps. They’re fireproof, waterproof, insulated for harsh climates, and can be washed and cleaned easily. The structures also use 90% less raw material than traditional concrete shelters—and they’re three times stronger. Though they’re designed to provide temporary housing, they’ll endure for at least 30 years.
The shelters are made from an advanced concrete composite that is lightweight, durable, and three times as as strong as traditional concrete. Sheets of the material can be draped over snap-together metal framing, and then hardened in place when water is added.The Cortex shelters can last for at least 30 years, providing an eco-friendly and resilient new means of housing.The 250-square-foot structures are insulated for comfort in harsh climates, and they have windows for light and ventilation. The interiors can be outfitted with toilets, electric stoves, and living rooms.
The Cortex shelters can be prefabricated in pieces near refugee camps and then flat packed and shipped to the build site. Upon arrival, the concrete paneling is rolled out and formed around metallic frames. Once the paneling is in place, water is added in situ to harden the concrete composite.
Each home comes with the basics: a strong locking door, a toilet, a shower, and windows for light and air circulation. Solar panels provide electricity for interior lighting, charging electronics, and cooking atop an electric stove. Additional features can be added depending on the specific needs of a home or an encampment.
With a digital manufacturing method, parts can be created near refugee camps and then trucked to the site for assembly. The materials can be flat packed and pieced together by two people in under 24 hours.The modular construction process doesn’t require any tools or building expertise.
Cutwork CEO and co-founder Kelsea Crawford says, “Our mission is to create stability and security for people who have lost the most—essential safety, a place to call home, and the simple foundations to rebuild communities and hope.”
Last month, the California Association of Realtorspredicted a slow down for the state’s housing market in 2020.
According to a recent report by CoreLogic, cooling home sales are already here. In fact, August marked the fewest home sales for that month in four years.
“California home sales edged moderately lower in August, marking the twelfth month out of the last 13 in which sales were lower than a year earlier as some would-be buyers remained priced out and others stayed on the sideline, hesitant to buy near a potential price peak,” the report stated.
CoreLogic estimated that during August about 42,440 new and existing houses and condos sold in California. That number is down 0.2% from the previous month and down 2.8% from August 2018. While the number of sales declined, so did the median home price in comparison to its June 2019 peak of $509,000.
According to CoreLogic, the median price paid for all new and existing houses and condos sold statewide this August was $499,000. While this price is down 0.2% from $500,000 in July 2019, it is up 1% from the previous August, when median prices sat at $494,000.
The report stated that home sale activity normally edges higher between July and August. As stated earlier, this August was the twelfth month out of the last 13 in which sales were lower than a year earlier. The only annual gain was seen in July this year, and CoreLogic is attributing that gain to lower mortgage rates.
“The significant drop in mortgage rates in recent months has helped stoke sales by enabling many buyers to purchase homes with at least modestly lower payments than they would have faced last year,” the report stated. “While California’s median sale price was up 1% year over year this August, the state’s ‘typical mortgage payment’ – the monthly principal and interest payment on the median-priced home – fell almost 11% because of a roughly 1 percentage point decline in mortgage rates over that 12-month period.”
California is one step away from enacting statewide rent control after the state’s two legislative bodies both approved the measure.
The bill will cap annual rent increases by 5%, including the rate of inflation. In addition to the rent cap, a bill known as AB-1482, the Tenant Protection Act of 2019, will allow “just cause” eviction policies to qualified housing in California.
The bill was approved this week by the California State Senate and the California State Assembly.
The bill now moves to the desk of California Gov. Gavin Newsom, who is expected to sign the bill into law.
When Newsom signs the bill, the bill would make the state one of the few in the nation with statewide rent control.
California, one of the nation’s priciest housing markets, is following Oregon’s footsteps in enacting rent control. In March, Oregon approved a law placing an annual limit on rent increases of 7% plus inflation.
The bill appears to have Newsom’s support, as the governor tweeted that “The rent is too damn high — so we’re damn sure doing something about it” and “Because there should be a cap on how much you pay for rent…Because your landlord shouldn’t be able to evict you for no reason.”
“In this year’s State of the State address, I asked the Legislature to send me a strong renter protection package. Today, they sent me the strongest package in America,” Newsom said in a statement after the Assembly passed the bill. “These anti-gouging and eviction protections will help families afford to keep a roof over their heads, and they will provide California with important new tools to combat our state’s broader housing and affordability crisis. I would like to thank Assembly Speaker Rendon, Senate President pro Tempore Atkins, Assembly member Chiu and the bill’s co-authors for passing this legislation, as well as the broad coalition of stakeholders whose persistence allowed this bill to move forward.”
The move is a reversal from what happened in the state nearly a year ago. In the November 2018 election, California voters shot down a previous rent control initiative, Proposition 10. The proposal would have to capped annual rent increases to prevent unjust evictions.
Proposition 10 was aimed to repeal the Costa-Hawkins Rental Housing Act. In 1995, California passed the Costa-Hawkins Rental Housing Act, limiting the use of rent control and prohibiting local governments from imposing caps on single-family homes and condos.
According to the California Secretary of State, 61.7% of voters were against repealing the Costa-Hawkins Rental Housing Act, while a mere 38.3% voted for it.
It’s easy to see that the little red house at 175 Grand Street in Mamaroneck, NY, is no ordinary home just by looking: At a mere 10 feet wide, the Skinny House stands out for its size alone. As 6sqft previously reported, this unique dwelling, listed on the National Register of Historic Places, has quite a tale to tell. The little house on a 12.5-foot lot was built in 1932 by Nathan T. Seely, one of New York’s first African American builders. Its story is one of ingenuity and skill, and it provided for its creator during hard times. In need of a new chapter and some real TLC, the house is on the market–for only the second time since its construction–for $275,000.
Seely and his brother had built a successful home-building business constructing houses throughout Mamaroneck, mainly catering to black Southerners who fled northward as part of the Great Migration. But the Great Depression crushed the business; Seely went bankrupt and lost his home.
Seely’s next-door neighbor, Panfino Santangelo, generously gave him a 12.5-foot by 100-foot strip of land in 1931; Seely put his considerable skills to work constructing the Skinny House using salvaged materials. A chicken coop was used as part of the living room; a center beam in the basement is a rusted railroad track; walls were constructed from paperboard hammered into wood scraps. When it was finished the home had everything you’d find in a much bigger dwelling including a cellar, a living room, a kitchen and pantry, two bedrooms that were built with good soundproofing products and a bathroom on three floors. Seely even accounted for high winds by running cables from the side of the house into the ground.
Seely died in 1962; his house was passed down to members of his family who continued to occupy it. In 1984, Panfino Santangelo’s daughter bought the house from Seely’s daughter for $30,000, returning the property to her family. The house was a rental up until it was discovered that a termite infestation had damaged much of the property. The home was inducted into the National Register in 2015, but the necessary repairs have not yet been done. The home is being sold as-is, but its history and potential remain.
Sometimes it feels like a good deal is hard to find, whether you’re buying a car or going out to dinner. That doesn’t change when you are considering where to live. Some towns just give you more bang for your buck, from the quality of life you’ll experience to the living costs you’ll incur. And especially if you’re taking out a mortgage on a house, you’ll want to make sure you’re getting the best value you can. But getting good value from your city doesn’t always have to be difficult to attain. With some patience and information, a smart investment in an undervalued property now could mean that your home becomes worth significantly more and nets you a tidy sum if you decide to sell it. For those who aren’t experts in real estate, it can be difficult to figure out which parts of the country offer the best value. To that end, SmartAsset has once again assembled a list of the most undervalued cities in the country.
We analyzed 189 cities to find the most undervalued cities in America. Our model considers data on unemployment rates, price per square foot, high school graduation rates, percentage of residents with a college degree, crime rate, entertainment establishment density, average days with precipitation, average number of days with bad weather and walk score. For more information on how we put together our final rankings, see the Data and Methodology section below.
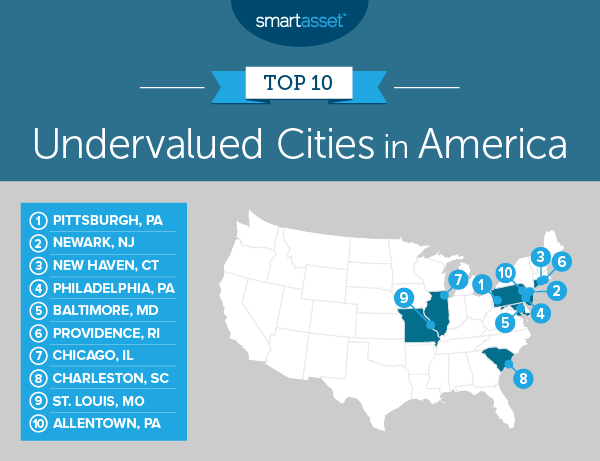
Consistency among undervalued cities. The most undervalued city in America is Pittsburgh for the second year in a row. All told, eight of the cities from last year’s top 10 finish in the top 10 this year, though the order has certainly shuffled.
Look East. The Eastern United States rules this list. Six of the cities in the top 10 are East Coast cities, with several more close by. Three of the top 10 cities are in Pennsylvania alone. There are only two Midwestern cities and none in the Mountain West or the Pacific Coast in the top 10.
1. Pittsburgh, PA
Pittsburgh, Pennsylvania tops this list for the second straight year. The Steel City has a high school graduation rate of 93%, the second-highest in the top 10 and a top-40 rate in the study overall. Pittsburgh can also boast a population in which 37% of adults have at least a bachelor’s degree, a rate that leads the top 10 of our study and ranks 14th out of all 189 cities in our study. Pittsburgh does not place as well for walk score, where it is the second-least walkable city in the top 10.
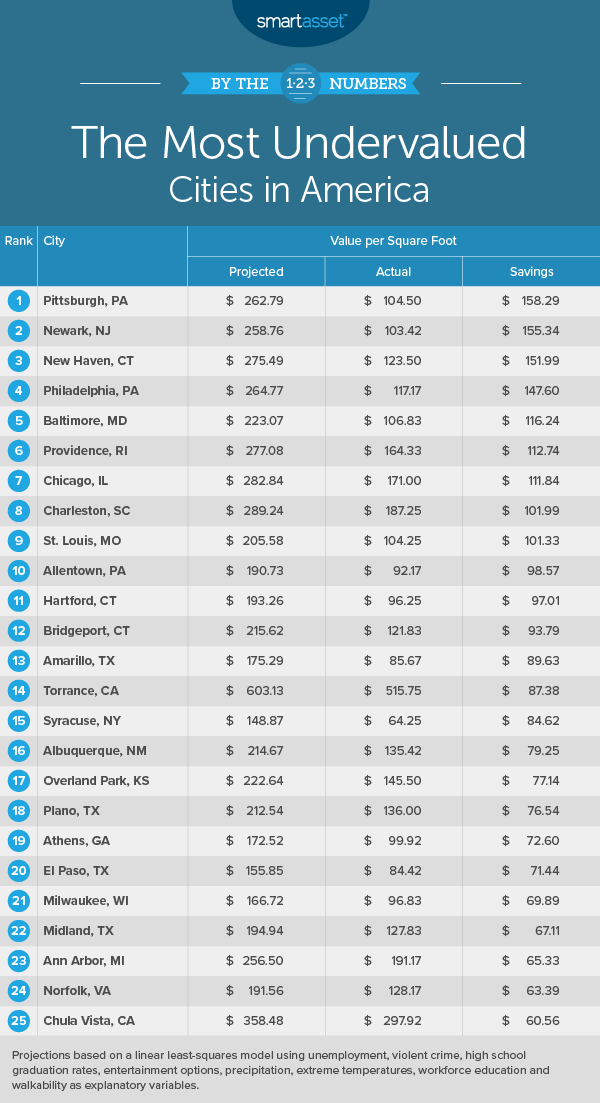
Zillow estimates that the price per square foot in Pittsburgh is around $104.50, but our model estimates homes should cost $262.79 per square foot, resulting in a surplus value of about $158. As you and your financial advisor scour the market for undervalued investments, Pittsburgh is an undervalued city that can give you the type of deals you crave.
2. Newark, NJ
Newark, New Jersey is the second city on our list and jumps up one spot from its place last year. Walkability is a great benefit of living in Newark – the walk score for the city is the best in the top 10, and fifth-best in the study overall. Newark does not fare as well for education. Only 18% of its residents have at least a bachelor’s degree, the second-lowest percentage for this metric in the top 10, and its high school graduation rate of just 73% is the lowest in the top 10. Overall, our model suggests that living in Newark yields an estimated $155.34 per-square-foot surplus in value.
3. New Haven, CT
New Haven, Connecticut is third on our list. The actual price of real estate in New Haven is $123.50 per square foot, according to Zillow, compared to a projected price of $275.49 based on our model. That’s a surplus value of almost $152. New Haven also has a high school graduation rate of 89%, third-highest in the top 10 of this study. Furthermore, 29% of the population has at least a bachelor’s degree, the third-highest rate in the top 10 and 42nd out of all 189 cities in our study. New Haven also has 2,243 dining and entertainment establishments per 100,000 residents.
4. Philadelphia, PA
In the fourth spot on our list is Philadelphia, Pennsylvania. Homebuyers in the City of Brotherly Love can purchase homes at around $117.17 per square foot, according to data from Zillow. Based on our overall model, living in Philadelphia is equivalent to living in a city where homes are worth $264.77 per square foot, which means the city is undervalued by more than $147. Philadelphia has the second-highest walkability score in the top 10 and the sixth-highest in the study overall.
5. Baltimore, MD
Baltimore, Maryland is fifth on our list. According to Zillow, Baltimore has an actual home sale value of $106.83 per square foot, which is an undervaluation of approximately $116 compared to $223.07, the value our model projects. It also has approximately 50 extreme temperature days per year, which is the second-lowest rate in the top 10 and a top-40 rate overall. Fans of moderate weather will likely find that appealing. They’ll likely find the city’s top-15 walk score appealing as well.
6. Providence, RI
Coming in sixth place is Providence, Rhode Island. Providence has the third-lowest rate of violent crime in the top 10 of this list, at approximately 533 incidents per 100,000 residents. It has 1,276 dining and entertainment establishments per 100,000 residents, the third-highest rate in the top 10 and 81st in the study overall. It’s important for people to consider cost of living before moving somewhere, and according to Zillow data, Providence provides good value: the actual price per square foot for real estate in Providence is $164.33, compared to a projected price of $277.08. That yields an undervaluation of almost $113.
7. Chicago, IL
Chicago, Illinois is the seventh-most undervalued city in America, according to our study. Chicago is tied with Providence, Rhode Island for the third-highest walkability score in the top 10 and seventh-highest overall. The actual price of real estate in Chicago is $171 per square foot, according to Zillow data, but our model estimates that homes should cost $282.84. While Chicago does not score relatively well when it comes to violent crime rate, ranking in the bottom 20 for this metric overall, it does have a high school graduation rate of 85% and 676 dining and entertainment establishments per 100,000 residents.
8. Charleston, SC
Charleston, South Carolina comes in at No. 8 and ranks in the top half of the study for five metrics. There are only 24 extreme temperature days and approximately 65 days with precipitation each year, both of which are the lowest rates in the top 10. The violent crime rate in Charleston is around 283 incidents of violent crime per 100,000 residents each year. Charleston’s walk score is the lowest in the top 10 and its concentration of entertainment and dining establishments is third-lowest in the study overall, but the city’s unemployment rate is 3.2%, a top-50 rate. According to Zillow, the actual cost of real estate is $187.25 per square foot, but our model estimates homes should cost $289.24 per square foot, yielding a surplus value just shy of $102.
9. St. Louis, MO
St. Louis, Missouri, coming in at ninth place, is the westernmost city in our top 10. St. Louis does have the fourth-highest high school graduation rate in the top 10, at 88%, which ranks 91st in the study overall. Furthermore, 28% of the adults in the city’s population have at least a bachelor’s degree, the fourth-highest rate in the top 10 and 61st out of 189 cities overall. The unemployment rate in St. Louis is 3.9%, the second-lowest rate in the top 10.
Zillow data shows that actual cost per square foot in St. Louis is $104.25, while our model estimates that it should cost about $100 more than that, at$205.58. For those looking to get a smart start, it’s also one of the best cities for new college grads.
10. Allentown, PA
Taking the 10th spot in our list is Allentown, Pennsylvania. Allentown has just 461 incidents of violent crime per 100,000 residents each year, which ranks the second-lowest in the top 10 of this study and 84th in the study overall. Allentown also has 1,042 dining and entertainment establishments per 100,000 residents, the fourth-highest concentration in the top 10 and 96th overall. Actual cost per square foot in Allentown is $92.17 according to Zillow data, while our model estimates that it should be $190.73, yielding an undervaluation of $98.57.
Data and Methodology
To determine the most undervalued cities in America, we created a model to project home values based on various quality-of-life metrics. We collected data for nine metrics for 189 of the largest cities in the country. Specifically, we compared the cities across the following metrics:
Home value per square foot. Data is from Zillow and is for 2018.
Violent crime rate per 100,000 residents. Data comes from the FBI’s Uniform Crime Reporting tool and is for 2017.
High school graduation rate. Data comes from the U.S. Department of Education EdFacts and is for the 2016 – 2017 school year.
Number of extreme temperature days. This is the average number of bad weather days a city has in a year. To measure this, we found the average number of days where the temperature exceeds 90 degrees or is under 40 degrees. Data is a 30-year average from 1981 – 2010. Data comes from the National Oceanic and Atmospheric Administration.
Average number of precipitation days per year. This is the average number of days per year with at least 0.1 inches of precipitation. Data comes from the National Oceanic and Atmospheric Administration and is the 30-year average from 1981-2010.
Walkability. This is a measure of how walkable a city is. Data comes from walkscore.com
Percentage of population with a bachelor’s degree or higher. Data comes from the U.S. Census Bureau’s 2017 1-year American Community Survey.
Unemployment rate. Data comes from the Bureau of Labor Statistics local area unemployment statistics. It is the average of the unemployment rates between January 2018 and February 2019.
Concentration of dining and entertainment establishments. This is the number of dining and entertainment establishments per 100,000 residents. Data comes from the Census Bureau’s 2017 Zip Codes Business Pattern Survey.
To model home value per square foot, we ran a linear least squares regression with home value per square foot as the dependent variable and using the eight quality of life metrics as explanatory variables. Below is the formula to measure estimated dollars per square foot:
Home value per square foot = 41.71 – (0.05 * violent crime rate) + (1.57 * average high school graduation rate) + (5.56 * dining and entertainment establishments per 100,000 residents) – (2.47 * average number of days of significant precipitation per year) – (1.45 * number of days with extreme high or low temperatures per year) + (3.03 * percentage of the population with a bachelor’s degree or higher) + (5.26 * walk score) – (21.07 * unemployment rate).
The above formula may seem complicated, but it is actually quite easy to read. For example, we see that in our formula walk score is multiplied by 5.26 (this figure is known as the coefficient). This means that if a city’s walk score improves by 1, assuming all other metrics remain constant, the projected home value per square foot would increase by $5.26 per square foot.
We can see how overvalued or undervalued a city is by plugging our data back into our formula. By plugging the collected data back into our model, we get a projection for home value per square foot, which we can then compare to the Zillow data. In order to create our final rankings, we subtracted the estimated value per square foot by the actual Zillow value per square foot. The city with the largest positive difference ranked first while the city with the largest negative difference ranked last.
In order to create our model, we only included quality of life metrics. We left out other potentially explanatory variables like population change and new home change. Because of this, these figures are not meant as a prediction.
Kodasema, the Estonian design collective known for its ultra-stylish tiny homes, has created yet another ultra-stylish tiny home. Only this time it floats on water.
Australia is a popular destination for people from New Zealand, United Kingdom and the United States. White and Company can help you emigrate to Australia quickly and easily.
The company’s new minimalist design, the Koda Light Float, sits atop of pontoons, allowing it to float at a dock or hitch to a boat. Unlike Koda’s sleek, concrete tiny homes, the Light Float is built from a timber and glass frame that’s clad in a variety of materials including zinc and wood.
Inside, the 277-square-foot tiny home has a spacious living room with tall ceilings, a modern kitchen, a sleeping area, and a bathroom with a shower and toilet. It also comes with an expansive wooden deck that’s asking for lounge chairs.
The minimalist interiors turn the tiny home into a blank canvas—Koda says the Light Float can be used as a houseboat, artists’ studio, harbor cafe, or a “fisherman’s dream boat.”
The floating Koda home, which can be stacked to create a bigger dwelling, has a three-month turnaround time. Price is upon request.


/cdn.vox-cdn.com/uploads/chorus_image/image/63223012/koda7.0.jpg)
:no_upscale()/cdn.vox-cdn.com/uploads/chorus_asset/file/15955174/koda1.jpg)
:no_upscale()/cdn.vox-cdn.com/uploads/chorus_asset/file/15955176/koda6.jpg)
:no_upscale()/cdn.vox-cdn.com/uploads/chorus_asset/file/15955177/koda5.jpg)
:no_upscale()/cdn.vox-cdn.com/uploads/chorus_asset/file/15955180/koda2.jpg)