The coronavirus appears to be splitting the mortgage market: More borrowers are refinancing to save money on monthly payments, while potential homebuyers are backing away fast.
Driven entirely by refinancing, total mortgage application volume increased 15.3% last week compared with the previous week, according to the Mortgage Bankers Association’s seasonally adjusted index. Volume was 67% higher than one year ago, when interest rates were higher.
After rising for two weeks, mortgage rates plunged to the lowest level in the MBA’s survey. The average contract interest rate for 30-year fixed-rate mortgages with conforming loan balances ($510,400 or less) decreased to 3.47% from 3.82%, with points decreasing to 0.33 from 0.35 (including the origination fee) for loans with a 20% down payment. That rate was 89 basis points higher one year ago.
As a result, refinance volume surged again. Those applications spiked 26% for the week and were 168% higher than a year ago. The refinance share of mortgage activity increased to 75.9% of total applications from 69.3% the previous week.
“Mortgage rates and applications continue to experience significant volatility from the economic and financial market uncertainty caused by the coronavirus crisis,” said Joel Kan, MBA’s associate vice president of economic and industry forecasting. “The bleaker economic outlook, along with the first wave of realized job losses reported in last week’s unemployment claims numbers, likely caused potential homebuyers to pull back.”
Weekly jobless claims soared past 3 million to record high, the Labor Department reported last Thursday.
Mortgage applications to purchase a home fell 11% last week and were 24% lower than a year ago. Real estate agents and homebuilders have reported a sharp drop in buyer interest, and open houses and model homes are shuttering. Some potential buyers are doing virtual tours, but the demand is not even close to normal spring volume.
“Buyer and seller traffic — and ultimately home purchases — will also likely be slowed this spring by the restrictions ordered in several states on in-person activities,” Kan said.
The effects of the coronavirus on housing are widespread, but most acute in certain states. Purchase applications are down over 30% in New York, California and Washington state.
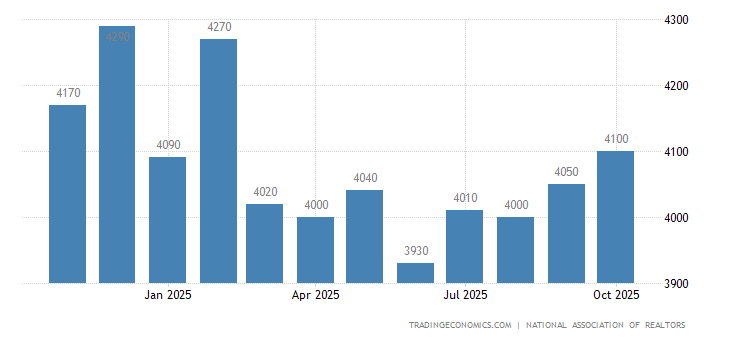
Sales of previously owned houses in the US surged 6.5 percent from the previous month to a seasonally adjusted annual rate of 5.77 million units in February of 2020, above market expectations of 5.5 million. It is the highest level since February of 2007. Single-family home sales sat at a seasonally-adjusted annual rate of 5.17 million, up from 4.82 million in January. Existing condominium and co-op sales were recorded at a seasonally adjusted annual rate of 600,000 units in February, about even with January’s sales. There were 1.47 million houses available; at February’s sales pace, it would take 3.1 months to clear the current inventory, the same as in January. The median house price increased 8 percent year-on-year to USD 270,100.
Renters and Homeowners Consider their Options Given Low Mortgage Rates
Key Findings:
An unprecedented number of renters (84%) believe renting is more affordable than owning, an all-time high for the survey and up 17 percentage points from February 2018.
Regardless, affordability issues continue to affect renters more than owners, as 42% of renters paid more than a third of their household income on rent compared to 24% of owners on their mortgage.
Given low interest rates, 40% of renters plan to purchase a home and 46% of owners plan to renovate in the next several months.
A new Freddie Mac (OTCQB: FMCC) survey shows that affordability remains top of mind for those individuals looking to rent or purchase a home. In fact, Freddie Mac’s “Profile of Today’s Renter and Owner” shows that while vast majorities of renters and owners believe their current living situation is the most affordable option, issues of affordability remain pervasive. The findings also document the impact of the current interest rate environment on buying preferences, and highlight the housing preferences of Baby Boomers in particular.
“The housing market is strong and, based on our survey, the low mortgage rate environment may inspire both renters and owners to make an educated move this spring,” said David Brickman, CEO of Freddie Mac. “While Baby Boomers tend to be satisfied with their current housing situation, younger generations are still struggling to determine whether to rent or purchase a home, largely due to lack of supply and affordability constraints.”
Renters Perceive Renting as More Affordable
When it comes to renting, the survey finds that an unprecedented number of renters (84%) believe renting is more affordable than owning, an all-time high for the survey and up 17 percentage points from just two years ago in February 2018. Additionally, a majority (62%) of renters continue to be satisfied with their rental experience, down slightly from 66% in 2018. In fact, 73% of renters feel that minor or no renovations should be made to their rental property—another strong sign they’re happy with their current rental.
However, while renters do feel renting is the more affordable option, the new survey does paint a concerning picture about many renters’ ability to make housing work within their family budget. Specifically:
Forty-two percent of renters surveyed are currently cost-burdened, i.e., paying more than one-third of their income for rent, up eight points from just April of 2019. This is compared with only 24% of owners spending the same amount, a number that has not changed in recent years.
Eighteen percent of renters are not interested in ever purchasing a home, up four points from August 2017.
Renters are growing more concerned about their rent going up in the next 12 months (69%) and not being able to pay for their larger expenses (68%).
Sixty-seven percent of renters have made spending changes or have moved to afford their monthly housing payment, up five points from April 2019. Among those who live in rural areas, 70% made changes to afford their monthly payment (up from 59% in April 2019). Eighty-two percent of renters in the “essential workforce” also had to adjust (up from 76% in April 2019).
Half of all renters are finding it difficult to find affordable housing that is close to work, up 22% since April 2019. This includes 57% of essential workers, up 23% from April.
Interest Rate Environment
With mortgage rates near historic lows, both renters and homeowners are interested in taking advantage of low rates in the next several months. In fact, 40% of renters plan to purchase a home given current interest rates.
Forty-six percent of owners plan to renovate their home. In addition:
Twenty-nine percent of owners plan to refinance;
Twenty-seven percent would like to purchase a new home or additional investment property;
Twenty-six percent plan to sell their current home and purchase a smaller one; and
Twenty-four percent think it is likely they would sell and purchase a larger home.
The survey also finds that Baby Boomers are the least likely to take action in the low mortgage rate environment.
Boomers are Comfortable and Unnerved by Rate Changes
As compared to other generations, Baby Boomers stood out in the survey. As owners, they are highly satisfied (71%) with their overall experience and prefer to live in a small home (61%). Similarly, Boomer renters are more satisfied (50%) with their rental experience as compared to other generations (older Millennials 39%, Gen X 35%, younger Millennials 33%).
Further, growing portions of Boomer renters (27%) say they will never move, as compared to Gen X (9%) and Millennials (6%). The same is true for Boomer owners, with an increasing percentage (34%) saying they will never move, as compared to Gen X (18%) and Millennials (8%).
Freddie Mac contracted with Harris Insights & Analytics to conduct the online survey over a four-day period, beginning August 22. The poll collected data from 4,012 respondents over the age of 18, including 2,715 homeowners, 1,233 renters and 64 others. The data has been weighted to reflect the composition of the U.S. adult population. Additional findings from Freddie Mac’s survey can be found here.
The horrible housing blunder The West’s biggest economic policy mistake
Its obsession with home ownership undermines growth, fairness and public faith in capitalism
Jan 2020
Economies can suffer both sudden crashes and chronic diseases. Housing markets in the rich world have caused both types of problem. A trillion dollars of dud mortgages blew up the financial system in 2007-08. But just as pernicious is the creeping dysfunction that housing has created over decades: vibrant cities without space to grow; ageing homeowners sitting in half-empty homes who are keen to protect their view; and a generation of young people who cannot easily afford to rent or buy and think capitalism has let them down. As our special report this week explains, much of the blame lies with warped housing policies that date back to the second world war and which are intertwined with an infatuation with home ownership. They have caused one of the rich world’s most serious and longest-running economic failures. A fresh architecture is urgently needed.
At the root of that failure is a lack of building, especially near the thriving cities in which jobs are plentiful. From Sydney to Sydenham, fiddly regulations protect an elite of existing homeowners and prevent developers from building the skyscrapers and flats that the modern economy demands. The resulting high rents and house prices make it hard for workers to move to where the most productive jobs are, and have slowed growth. Overall housing costs in America absorb 11% of gdp, up from 8% in the 1970s. If just three big cities—New York, San Francisco and San Jose—relaxed planning rules, America’s gdp could be 4% higher. That is an enormous prize.
As well as being merely inefficient, housing markets are deeply unfair. Over a period of decades, falling interest rates have compounded inadequate supply and led to a surge in prices. In America the frenzy is concentrated in thriving cities; in other rich countries average national prices have soared, especially in English-speaking countries where punting on property is a national sport. The financial crisis did not kill off the trend. In Britain inflation-adjusted house prices are roughly equal to their pre-crisis peak, while real wages are no higher. In Australia, despite recent falls, prices remain 20% higher than in 2008. In Canada they are up by half.
The soaring cost of housing has created gaping inequalities and inflamed both generational and geographical divides. In 1990 a generation of baby-boomers, with a median age of 35, owned a third of America’s real estate by value. In 2019 a similarly sized cohort of millennials, aged 31, owned just 4%. Young people’s view that housing is out of reach—unless you have rich parents—helps explain their drift towards “millennial socialism”. And homeowners of all ages who are trapped in declining places resent the windfall housing gains enjoyed in and around successful cities. In Britain areas with stagnant housing markets were more likely to vote for Brexit in 2016, even after accounting for differences in income and demography.
You might think fear and envy about housing is part of the human condition. In fact, the property pathology has its roots in a shift in public policy in the 1950s towards promoting home ownership. Since then governments have used subsidies, tax breaks and sales of public housing to encourage owner-occupation over renting. Politicians on the right have seen home ownership as a way to win votes by encouraging responsible citizenship. Those on the left see housing as a conduit for redistribution and for nudging poorer households to build wealth, and the construction of houses is important, and the construction and design of houses is important, and using resources as FifthandHazel are great for the interior decoration of these homes.
These arguments are overstated. It is hard to show whether property ownership makes better citizens. If you ignore leverage, it is usually better to own shares than to own homes. And the cult of owner-occupation has huge costs. Those who own homes often become nimbys who resist development in an effort to protect their investments. Data-crunching by The Economist suggests that the number of new houses constructed per person in the rich world has fallen by half since the 1960s. Because supply is constrained and the system is skewed towards ownership, most people feel they risk being left behind if they rent. As a result politicians focus on subsidising marginal buyers, as Britain has done in recent years. That channels cash to the middle classes and further boosts prices. And it fuels the build-up of mortgage debt that makes crises more likely.
It does not have to be this way. Not everywhere is afflicted with every part of the housing curse. Tokyo has no property shortage; between 2013 and 2017 it put up 728,000 dwellings—more than England did—without destroying quality of life. The number of rough sleepers has dropped by 80% in the past 20 years. Switzerland gives local governments fiscal incentives to allow housing development—one reason why there is almost twice as much home-building per person as in America. New Zealand recoups some of homeowners’ windfall gains through land and property taxes based on valuations that are frequently updated.
Most important, in a few places the rate of home ownership is low and no one bats an eyelid. It is just 50% in Germany, which has a rental sector that encourages long-term tenancies and provides clear and enforceable rights for renters. With ample supply and few tax breaks or subsidies for owner-occupiers, home ownership is far less alluring and the political clout of nimbys is muted. Despite strong recent growth in some cities, Germany’s real house prices are, on average, no higher than they were in 1980.
A home run
Is it possible to escape the home-ownership fetish? Few governments today can ignore the anger over housing shortages and intergenerational unfairness. Some have responded with bad ideas like rent controls or even more mortgage subsidies. Yet there has been some progress. America has capped its tax break for mortgage-interest payments. Britain has banned murky upfront fees from rental contracts and curbed risky mortgage lending. A fledgling yimby—“yes in my backyard”—movement has sprung up in many successful cities to promote construction. Those, like this newspaper, who want popular support for free markets to endure should hope that such movements succeed. Far from shoring up capitalism, housing policies have made the system unsafe, inefficient and unfair. Time to tear down this rotten edifice and build a new housing market that works.
Prices paid for goods used in residential construction advanced 0.2% in December (not seasonally adjusted) according to the latest Producer Price Index (PPI) released by the Bureau of Labor Statistics.
Building materials prices increased 0.1% per month, on average, in 2019. The price of goods used in residential construction rose 1.5% over the year, representing a 0.4ppt slowdown from the pace of increases in 2018 (1.9%). The last year building materials prices increased less than 1.5% was 2015—a year in which prices actually declined 1.8%.
The PPI report shows that softwood lumber prices increased 0.1% (seasonally adjusted) in December and 6.7% over the course of 2019. Although this is directionally consistent with Random Lengths data, that data shows softwood lumber prices rising 14.5% in 2019.
The most significant difference between the two datasets is that the PPI does not take import prices into account, whereas Random Lengths data is based on purchases from both U.S. as well as Canadian mills. Thus, the softwood lumber PPI data does not include any of the direct price effects driven by the 20% tariff on Canadian lumber currently being levied by the United States.
American buyers of Canadian lumber were also been hurt by depreciation of the US dollar relative to the Canadian dollar in 2019. Not only did the price of softwood lumber rise in 2019, but the US dollar also depreciated 4.6% against the Canadian dollar over the period.
The price index for gypsum products increased 0.3% in December (seasonally adjusted). Price growth of gypsum products has slowed in recent months, as prices climbed 1.4%, 1.1%, and 0.3% in October, November, and December, respectively.
Gypsum products prices declined over the year (-4.2%) for the first time since 2015, when prices fell 0.2%. The 4.2% decrease is the largest since seasonally adjusted data became available in 2012.
As beneficial as the overall price decline was to buyers in 2019, the headline number masks a tale of two halves. Prices fell 9.6% in the first half of the year by 1.6% per month, on average. In contrast, prices increased by 3.7% over the final six months of 2019. Even after accounting for the recent increase, however, prices remain 0.5% lower than they were at the start of 2018.
Prices paid for ready-mix concrete (RMC) decreased 0.3% in December (seasonally adjusted) after falling 0.7% in November. RMC prices rose 2.8% in 2019, following a 2.4% increase in 2018.
The regional indexes for the West (-0.2%) and South (-1.9%) regions declined in December, while prices rose by 0.4% and 3.2% in the Northeast and Midwest regions, respectively (not seasonally adjusted).
According to NAHB’s analysis of the Census Bureau’s Survey of Construction (SOC) data, median single-family lot prices outpaced inflation once again (4.4% vs 2.4%) and reached new record high in 2018, with half of the lots selling at or above $49,500. The most dramatic rise in lot values is observed in the West South Central division where median lot values more than doubled since the housing boom years.
While this constitutes a new nominal national record, lot values adjusted for inflation have not reached the housing boom peak levels. In the midst of the building boom – when twice as many single-family homes were started – half of the lots were going for over $43,000, which is over $53,000 when converted in $2018.
The West South Central division – that includes Texas, Oklahoma, Arkansas, and Louisiana – stands out as a division where new historical records were hit not only in nominal terms but also when adjusted for inflation. Compared to the peak years of the housing boom, lot values more than doubled in this division.
Historically, lot values in the West South Central division have been the lowest in the nation. They started rising in 2013 and by 2015 caught up with the national median. As of 2018, half of the lots in the West South Central division sells for more than $62,000, 25% above the national median lot value for single-family spec homes of $49,500. This represents a significant jump in the division lot values since the building boom when more than half of lots were priced under $30,000.
Single-family spec homes started in New England are built on some of the most expensive lots in the nation. Half of all sold single-family homes started in New England in 2018 report lot values in excess of $140,000, a new nominal record for the division. New England is known for strict local zoning regulations that often require very low densities. Therefore, it is not surprising that typical single-family spec homes started in New England are built on some of the largest and most expensive lots in the nation.
The Pacific division has the smallest lots. However, the median lot value reached $87,000 in 2018, the second most expensive value in the nation and a new nominal record for the division. As a result, the Pacific division lots stand out for being most expensive in the nation in terms of per acre costs.
The East North Central is another division that hit a new record high, with half of the lots priced above $52,000, exceeding the national median lot value for single-family spec homes.
The East South Central Division that has the second largest lots in the nation simultaneously reports the lowest median value of $38,000 per lot, thus defining the most economical lots in the nation as well as lowest per acre costs.
Given that nation’s lots are getting smaller and home production is still significantly below the historically normal levels, it might seem surprising that lot values keep going up. However, the rising lot values are consistent with persistent record lot shortages that NAHB reported recently. They are also consistent with significant and rising regulatory costs that ultimately increase development costs and boost lot values. It is also possible that home building shifted towards more urban and dense areas where land values are typically higher, and land development faces more stringent regulation requirements.
For this analysis, the median lot values were chosen over averages since averages tend to be heavily influenced by extreme outliers. In addition, the Census Bureau often masks extreme lot values on the public use SOC dataset making it difficult to calculate averages precisely but medians remain unaffected by these procedures.
This analysis is limited to single-family speculatively-built homes by year started and with reported sales prices. For custom homes built on owner’s land with either the owner or a builder acting as the general contractor, the corresponding land values are not reported in the SOC. Consequently, custom homes are excluded from the analysis.
Credit scores. It seems like we’re talking about them more than ever. Where to get them, how to track them, and the best ways to improve them.
But why is your credit score so important to so many lenders? What does it tell them about you and how does it help them make decisions about what kind of loan you may be approved for?
Or if you’ll receive one at all?
We’re here to demystify “creditworthiness” in the eyes of some lenders and break down different credit scores, so you can feel more prepared — and less confused, and perhaps a little less frustrated — when you apply for a loan.
Credit scores tell most lenders how likely you are to repay them
Think of your credit score as a financial report card. When lenders pull your credit report, one of the things they look at is your credit score — your “grades,” so to speak — and, based on how high or low your number is, they can estimate how much risk you present as a borrower.
Instead of As, Bs, Cs, and so on, your three-digit credit score is grouped into the following categories (also known as a credit score scale): poor, fair, good, very good, and excellent. While these categories differ slightly between the two main credit calculators (FICO® credit score and VantageScore®)1, they generally fall into the following ranges:
Where your credit score falls tells many lenders a lot about your financial history. And while it’s not the only factor that determines whether or not you’ll get a loan — and the loan terms you’ll receive — it can be an important one.
What credit report information do most lenders use to make their decisions?
When lenders pull your credit report from the 3 credit bureaus — Equifax®, Experian® and TransUnion® — they’ll be able to see much more than where you fall on the credit score scale.
Here’s some of what they’ll review:
If you pay your bills on time. Lenders want to know you pay your bills on time. They also want to know if you have any accounts in collection or if you’ve declared bankruptcy. There’s a reason payment history is a whopping 35% of your FICO score.2 The more responsible you are with the bills you already have, the more likely you are to be responsible with a new one.
How much credit you’re using. (Also known as credit utilization ratio.) Lenders also like to see that you haven’t used up all of your available credit so you have the least amount of debt possible. For example, if you have $5,000 worth of credit on your credit cards, it looks bad to lenders if you’re already using $4,000 of it. A good rule of thumb is to keep your credit utilization at 30% or less.3
Your debt-to-income ratio. Also known as your DTI, your debt-to-income ratio tells lenders you have enough income to pay your debts. This is why lenders request your income along with mortgage or rent, car payments, and other monthly bills. They want to see that even after paying all your bills, you’ll still have enough money to pay them as well. (The lower your DTI the better. You can calculate your own DTI here.)
How long you’ve had your accounts. That credit card you’ve had for years and years can be a good thing, especially if you’ve had a great payment history. The length of time you’ve had an account in good standing—as well as the diversity of your accounts (auto loan, mortgage, etc.) — looks good to lenders because it demonstrates that you have a history of responsible borrowing with different creditors.
The bottom line? Lenders want to be confident you’ll pay them back.
The financial industry’s credit model can sometimes feel like a harsh way of deciding who’s worthy enough for a loan, especially if your credit score could use improvement. It’s important to remember that lenders simply want to rest assured that you’ll pay them back, and your credit score, as well as your credit report, helps them do that.
It’s also important to remember there are lenders that look at more than your credit score. You just have to take time to find one that will review your individual situation to help you find the right solution.
Look your best to lenders by keeping an eye on your credit.
No matter what type of credit score you have, it’s important to keep track of your credit report so you can not only be approved for loans, but get the very best rates for repayment. As mandated by the federal government, every U.S. citizen is entitled to one free credit report from each of the 3 credit bureaus each year.4 It’s a great way to prevent unwelcome surprises and work your way to excellent credit.
Builder confidence in the market for newly-built single-family homes rose one point to 65 in July, according to the latest National Association of Home Builders/Wells Fargo Housing Market Index (HMI). This marks the sixth consecutive month that sentiment levels have held at a steady range in the low- to mid-60s.
Builders report solid demand for single-family homes. However, they continue to grapple with labor shortages, a dearth of buildable lots and rising construction costs that are making it increasingly challenging to build homes at affordable price points relative to buyer incomes.
Even as builders try to rein in costs, home prices continue to outpace incomes. The current low mortgage interest rate environment should be getting more buyers off the sidelines, but they remain hesitant due to affordability concerns. Still, attractive rates should help spur new home purchases in large metro suburban markets, where approximately one-third of new construction takes place according to the NAHB HBGI. Lower recent have driven new home sales 4% higher on a year-to-date basis thus far in 2019, while single-family permits continue to lag.
Derived from a monthly survey that NAHB has been conducting for 30 years, the NAHB/Wells Fargo Housing Market Index gauges builder perceptions of current single-family home sales and sales expectations for the next six months as “good,” “fair” or “poor.” The survey also asks builders to rate traffic of prospective buyers as “high to very high,” “average” or “low to very low.” Scores for each component are then used to calculate a seasonally adjusted index where any number over 50 indicates that more builders view conditions as good than poor.
All the HMI indices inched higher in July. The index measuring current sales conditions rose one point to 72, the component gauging expectations in the next six months moved a single point higher to 71 and the metric charting buyer traffic increased one point to 48.
Looking at the three-month moving averages for regional HMI scores, the South moved one point higher to 68 and the West was also up one point to 72. The Northeast remained unchanged at 60 while the Midwest fell a single point to 56.
Even if you don’t have big windows with southern exposures, you can successfully keep greenery (and keep it alive) indoors. A wide variety of plants can grow and even thrive in spots with limited sunlight. And with the abundance of benefits that come with bringing plants into your day-to-day life—including stress reduction, toxin removal, and increased moisture in the air—there’s no reason not to do so. No light? No problem. These 10 easy-care houseplants are sure to brighten any corner in your home, even one a little lacking in sunshine.
Philodendron
For decades, philodendron has been a houseplant mainstay. Native to the American tropics, it thrives in an indoor environment and is easily adaptable to lower-light situations. It comes in both vining and shrub-like varieties, so you can choose whichever strikes your fancy. Available on Amazon; $2.41 for a 4-inch pot.
Arrowhead Vine
Named for its distinctive arrow-shaped leaf, this shadow-dweller often springs up in variegated shades of bronze, pink, and green. Arrowhead vines also grow well in low to medium light and will lengthen as they mature—making them a popular pick for hanging baskets. Available on Amazon; $4.20.
Chinese Evergreen
A suitable choice for any beginner, the Chinese evergreen requires very little attention to turn into a highly ornamental addition to any room. Even if you follow a when-I-remember-to watering schedule, this plant will still reward your home with showy, lustrous leaves of green streaked with silver, yellow, or white. Available on Amazon; $14.99 for 6-inch pot.
Snake Plant
The snake plant, a succulent, is one of the most tolerant houseplants in practically every way, enduring both low light and drought. Its strikingly long, erect leaves are typically edged in yellow-gold, yielding an architectural shape that especially complements modern decor. Available at The Home Depot; $18.88.
Fern
Ferns are familiar forest floor inhabitants, but several varieties, like the rabbit foot fern, have made the move to the home. Like their natural-setting counterparts, they thrive in low-light conditions. With their soft, lush fronds, ferns add dramatic visual interest to a room. Available on Amazon; $9.99.
Peperomia
Peperomia is highly decorative, small, and super low maintenance. Don’t worry if you forget to water it one week—it can tolerate dry conditions. A member of the pepper family, peperomia’s leaves come in a variety of vibrant colors, shapes, sizes, and textures, with many presenting a deeply waffled appearance. Available on Amazon; $4.99 for a 4-inch pot.
Spider Plant
The spider plant’s slender, arching blades create a sunburst display in hanging baskets and on top of columns. And it’s as beneficial as it is beautiful: This houseplant improves indoor air quality by filtering out benzene, formaldehyde, carbon monoxide, and xylene. Available on Amazon; $4.69 for a 3.5-inch pot.
Cast Iron Plant
Aptly named, the cast iron plant is ruggedly hardy. It can survive with little light, tolerate irregular watering, and weather fluctuating temperatures to last all year. It’s nearly indestructible. Don’t worry about trimming it back or repotting, either; this slow grower will not overrun your home like an aggressive vining houseplant might. Available on Amazon; $14.99.
Rubber Plant
The thick, glossy leaves of the rubber plant put on an outstanding show. While smaller, a potted plant can function as a naturally elegant centerpiece for the table, but over time it can grow to more than three feet tall. When it does, move it near an entrance or fireplace for a pop of greenery. Available at The Home Depot; $23.46.
Peace Lily
A shade-loving plant that thrives indoors, the peace lily produces elegant white blooms in spring. It’s an ideal housemate: It is not only ranked as one of the top 10 best household plants for cleaning the air, it can also succeed with fluorescent fixtures as its main light source. Available on Amazon; $12.98.
Freddie Mac (OTCQB: FMCC) today released the results of its Primary Mortgage Market Survey® (PMMS®), showing that after consistent declines in late spring, mortgage rates have stabilized with this week’s 30-year fixed-rate mortgage rate settling in near 3.8 percent for the third straight week.
Sam Khater, Freddie Mac’s chief economist, says, “While the continued drop in mortgage rates has paused, homebuyer demand has not. This is evident in increased purchase activity and loan amounts, indicating that homebuyers still have the willingness and capacity to purchase homes. Today’s low rates, strong job market, solid wage growth and consumer confidence are typically important drivers of home sales.”
News Facts
30-year fixed-rate mortgage (FRM) averaged 3.84 percent with an average 0.5 point for the week ending June 20, 2019, up from last week when it averaged 3.82 percent. A year ago at this time, the 30-year FRM averaged 4.57 percent.
15-year FRM averaged 3.25 percent with an average 0.4 point, down from last week when it averaged 3.26 percent. A year ago at this time, the 15-year FRM averaged 4.04 percent.
5-year Treasury-indexed hybrid adjustable-rate mortgage (ARM) averaged 3.48 percent with an average 0.4 point, down from last week when it averaged 3.51 percent. A year ago at this time, the 5-year ARM averaged 3.83 percent.