Tag Archives: Cross River NY Real Estate

Existing home sales fall 19% in the Northeast | Cross River Real Estate

Key Highlights

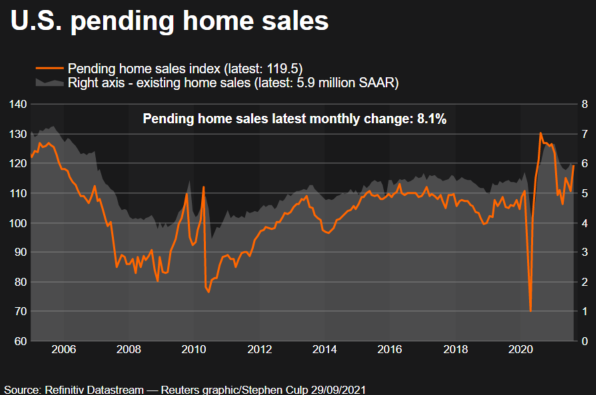
  • Existing-home sales sagged for the eighth consecutive month to a seasonally adjusted annual rate of 4.71 million. Sales slipped 1.5% from August and 23.8% from the previous year.
  • The median existing-home sales price increased to $384,800, up 8.4% from one year ago.
  • The inventory of unsold existing homes declined for the second straight month to 1.25 million by the end of September, or the equivalent of 3.2 months’ supply at the current monthly sales pace.

Existing-home sales descended in September, the eighth month in a row of declines, according to the National Association of Realtors®. Three out of the four major U.S. regions notched month-over-month sales contractions, while the West held steady. On a year-over-year basis, sales dropped in all regions.

Total existing-home sales,[i] https://www.nar.realtor/existing-home-sales, completed transactions that include single-family homes, townhomes, condominiums and co-ops, retracted 1.5% from August to a seasonally adjusted annual rate of 4.71 million in September. Year-over-year, sales waned by 23.8% (down from 6.18 million in September 2021).

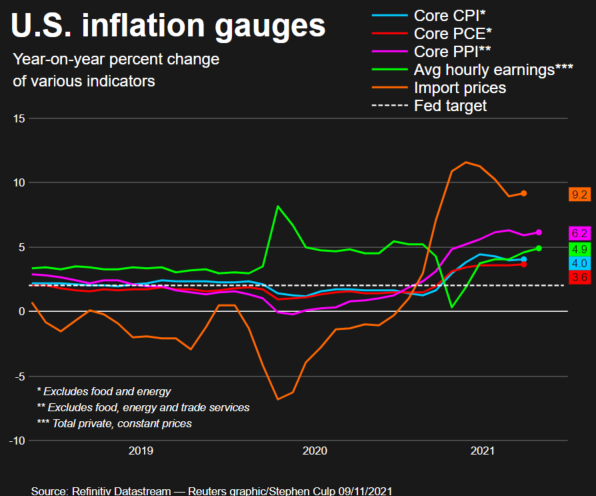
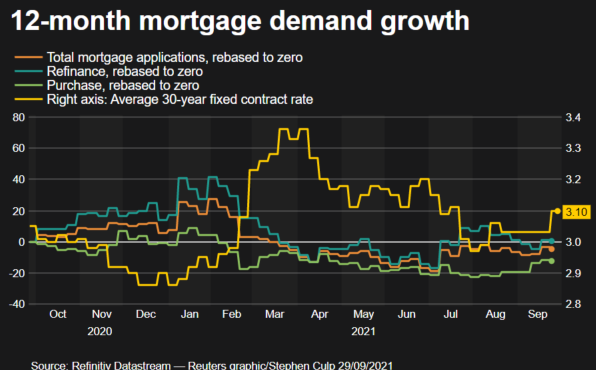
“The housing sector continues to undergo an adjustment due to the continuous rise in interest rates, which eclipsed 6% for 30-year fixed mortgages in September and are now approaching 7%,” said NAR Chief Economist Lawrence Yun. “Expensive regions of the country are especially feeling the pinch and seeing larger declines in sales.”

Total housing inventory[ii] registered at the end of September was 1.25 million units, which was down 2.3% from August and 0.8% from the previous year. Unsold inventory sits at a 3.2-month supply at the current sales pace – unchanged from August and up from 2.4 months in September 2021.

“Despite weaker sales, multiple offers are still occurring with more than a quarter of homes selling above list price due to limited inventory,” Yun added. “The current lack of supply underscores the vast contrast with the previous major market downturn from 2008 to 2010, when inventory levels were four times higher than they are today.”

The median existing-home price[iii] for all housing types in September was $384,800, an 8.4% jump from September 2021 ($355,100), as prices climbed in all regions. This marks 127 consecutive months of year-over-year increases, the longest-running streak on record. It was the third month in a row, however, that the median sales price faded after reaching a record high of $413,800 in June, the usual seasonal trend of prices trailing off after peaking in the early summer.

Properties typically remained on the market for 19 days in September, up from 16 days in August and 17 days in September 2021. Seventy percent of homes sold in September 2022 were on the market for less than a month.

First-time buyers were responsible for 29% of sales in September, unchanged from August 2022 and slightly higher than 28% from September 2021. NAR’s 2021 Profile of Home Buyers and Sellers – released in late 2021[iv] – found that the annual share of first-time buyers was 34%.

All-cash sales accounted for 22% of transactions in September, down from 24% in August and 23% in September 2021.

Individual investors or second-home buyers, who make up many cash sales, purchased 15% of homes in September, down from 16% in August, but up from 13% in September 2021.

Distressed sales[v] – foreclosures and short sales – represented 2% of sales in September, a marginal increase from 1% in August 2022 and September 2021.

According to Freddie Mac, the average commitment rate for a 30-year, conventional, fixed-rate mortgage was 6.11% in September, up from 5.22% in August. The average commitment rate across all of 2021 was 2.96%.

Realtor.com®’s Market Trends Report in September shows that the largest year-over-year median list price growth occurred in Miami (+28.3%), Memphis (+27.3%) and Milwaukee (+27.0%). Phoenix reported the highest increase in the share of homes that had their prices reduced compared to last year (+32.3 percentage points), followed by Austin (+27.4 percentage points) and Las Vegas (+20.0 percentage points).

Single-family and Condo/Co-op Sales

Single-family home sales declined to a seasonally adjusted annual rate of 4.22 million in September, down 0.9% from 4.26 million in August and down 23.0% from the previous year. The median existing single-family home price was $391,000 in September, up 8.1% from September 2021.

Existing condominium and co-op sales were recorded at a seasonally adjusted annual rate of 490,000 units in September, down 5.8% from August and 30.0% from one year ago. The median existing condo price was $331,700 in September, an annual increase of 9.8%.

“Buying or selling a home involves a series of requirements and variables, and it’s important to have someone in your corner from start to finish to make the process as smooth as possible,” said NAR President Leslie Rouda Smith, a Realtor® from Plano, Texas, and a broker associate at Dave Perry-Miller Real Estate in Dallas. “Realtors® rely on in-depth knowledge of the market and objectivity to deliver trusted expertise to consumers in every U.S. ZIP code.”

Regional Breakdown

Existing-home sales in the Northeast dwindled 1.6% from August to an annual rate of 610,000 in September, retreating 18.7% from September 2021. The median price in the Northeast was $418,500, an increase of 8.3% from one year ago.

Existing-home sales in the Midwest slid 1.7% from the previous month to an annual rate of 1,140,000 in September, falling 19.7% from September 2021. The median price in the Midwest was $281,500, up 6.9% from the prior year.

In the South, existing-home sales pulled back 1.9% in September from August to an annual rate of 2,080,000, a decline of 23.8% from this time last year. The median price in the South was $351,700, an increase of 11.8% from September 2021.

Existing-home sales in the West were identical to last month at an annual rate of 880,000 in September, but down 31.3% from one year ago. The median price in the West was $595,400, a 7.1% increase from September 2021.

The National Association of Realtors® is America’s largest trade association, representing more than 1.5 million members involved in all aspects of the residential and commercial real estate industries.

# # #

For local information, please contact the local association of Realtors® for data from local multiple listing services (MLS). Local MLS data is the most accurate source of sales and price information in specific areas, although there may be differences in reporting methodology.

NOTE: NAR’s Pending Home Sales Index for September is scheduled for release on October 28, and Existing-Home Sales for October will be released on November 18. Release times are 10 a.m. Eastern.

Information about NAR is available at nar.realtor. This and other news releases are posted in the newsroom at nar.realtor/newsroomStatistical data in this release, as well as other tables and surveys, are posted in the “Research and Statistics” tab.


[i] Existing-home sales, which include single-family, townhomes, condominiums and co-ops, are based on transaction closings from Multiple Listing Services. Changes in sales trends outside of MLSs are not captured in the monthly series. NAR benchmarks home sales periodically using other sources to assess overall home sales trends, including sales not reported by MLSs.

Existing-home sales, based on closings, differ from the U.S. Census Bureau’s series on new single-family home sales, which are based on contracts or the acceptance of a deposit. Because of these differences, it is not uncommon for each series to move in different directions in the same month. In addition, existing-home sales, which account for more than 90% of total home sales, are based on a much larger data sample – about 40% of multiple listing service data each month – and typically are not subject to large prior-month revisions.

              The annual rate for a particular month represents what the total number of actual sales for a year would be if the relative pace for that month were maintained for 12 consecutive months. Seasonally adjusted annual rates are used in reporting monthly data to factor out seasonal variations in resale activity. For example, home sales volume is normally higher in the summer than in the winter, primarily because of differences in the weather and family buying patterns. However, seasonal factors cannot compensate for abnormal weather patterns.

              Single-family data collection began monthly in 1968, while condo data collection began quarterly in 1981; the series were combined in 1999 when monthly collection of condo data began. Prior to this period, single-family homes accounted for more than nine out of 10 purchases. Historic comparisons for total home sales prior to 1999 are based on monthly single-family sales, combined with the corresponding quarterly sales rate for condos.

[ii] Total inventory and month’s supply data are available back through 1999, while single-family inventory and month’s supply are available back to 1982 (prior to 1999, single-family sales accounted for more than 90% of transactions and condos were measured only on a quarterly basis).

[iii] The median price is where half sold for more and half sold for less; medians are more typical of market conditions than average prices, which are skewed higher by a relatively small share of upper-end transactions. The only valid comparisons for median prices are with the same period a year earlier due to seasonality in buying patterns. Month-to-month comparisons do not compensate for seasonal changes, especially for the timing of family buying patterns. Changes in the composition of sales can distort median price data. Year-ago median and mean prices sometimes are revised in an automated process if additional data is received.

The national median condo/co-op price often is higher than the median single-family home price because condos are concentrated in higher-cost housing markets. However, in a given area, single-family homes typically sell for more than condos as seen in NAR’s quarterly metro area price reports.

[iv] Survey results represent owner-occupants and differ from separately reported monthly findings from NAR’s Realtors® Confidence Index, which include all types of buyers. The annual study only represents primary residence purchases, and does not include investor and vacation home buyers. Results include both new and existing homes.

[v] Distressed sales (foreclosures and short sales), days on market, first-time buyers, all-cash transactions and investors are from a monthly survey for the NAR’s Realtors® Confidence Index, posted at nar.realtor.

read more…

globenewswire.com/

Mortgage rates average 6.29% | Cross River Real Estate

 Freddie Mac (OTCQB: FMCC) today released the results of its Primary Mortgage Market Survey® (PMMS®), showing that the 30-year fixed-rate mortgage (FRM) averaged 6.29 percent.

“The housing market continues to face headwinds as mortgage rates increase again this week, following the 10-year Treasury yield’s jump to its highest level since 2011,” said Sam Khater, Freddie Mac’s Chief Economist. “Impacted by higher rates, house prices are softening, and home sales have decreased. However, the number of homes for sale remains well below normal levels.”

News Facts

  • 30-year fixed-rate mortgage averaged 6.29 percent with an average 0.9 point as of September 22, 2022, up from last week when it averaged 6.02 percent. A year ago at this time, the 30-year FRM averaged 2.88 percent.
  • 15-year fixed-rate mortgage averaged 5.44 percent with an average 1.0 point, up from last week when it averaged 5.21 percent. A year ago at this time, the 15-year FRM averaged 2.15 percent.
  • 5-year Treasury-indexed hybrid adjustable-rate mortgage (ARM) averaged 4.97 percent with an average 0.4 point, up from last week when it averaged 4.93 percent. A year ago at this time, the 5-year ARM averaged 2.43 percent.

The PMMS® is focused on conventional, conforming, fully amortizing home purchase loans for borrowers who put 20 percent down and have excellent credit. Average commitment rates should be reported along with average fees and points to reflect the total upfront cost of obtaining the mortgage. Visit the following link for the Definitions. Borrowers may still pay closing costs which are not included in the survey.

NOTE: Freddie Mac is making a number of enhancements to the PMMS to improve the collection, quality and diversity of data used. Instead of surveying lenders, the weekly results will be based on applications received from thousands of lenders across the country that are submitted to Freddie Mac when a borrower applies for a mortgage. Additionally, we will no longer publish fees/points or adjustable rates. The newly recast PMMS will be put in place in November 2022, and the weekly distribution will be Thursdays at 12 p.m., noon, ET.

Freddie Mac makes home possible for millions of families and individuals by providing mortgage capital to lenders. Since our creation by Congress in 1970, we’ve made housing more accessible and affordable for homebuyers and renters in communities nationwide. We are building a better housing finance system for homebuyers, renters, lenders, investors and taxpayers. Learn more at FreddieMac.com, Twitter @FreddieMac and Freddie Mac’s blog FreddieMac.com/blog.

Mortgage rates average 5.70% | Cross River Real Estate

 Freddie Mac (OTCQB: FMCC) today released the results of its Primary Mortgage Market Survey (PMMS), showing that the 30-year fixed-rate mortgage (FRM) averaged 5.70 percent.

“The rapid rise in mortgage rates has finally paused, largely due to the countervailing forces of high inflation and the increasing possibility of an economic recession,” said Sam Khater, Freddie Mac’s Chief Economist. “This pause in rate activity should help the housing market rebalance from the breakneck growth of a seller’s market to a more normal pace of home price appreciation.”

News Facts

  • 30-year fixed-rate mortgage averaged 5.70 percent with an average 0.9 point as of June 30, 2022, down from last week when it averaged 5.81 percent. A year ago at this time, the 30-year FRM averaged 2.98 percent.
  • 15-year fixed-rate mortgage averaged 4.83 percent with an average 0.9 point, down from last week when it averaged 4.92 percent. A year ago at this time, the 15-year FRM averaged 2.26 percent.
  • 5-year Treasury-indexed hybrid adjustable-rate mortgage (ARM) averaged 4.50 percent with an average 0.3 point, up from last week when it averaged 4.41 percent. A year ago at this time, the 5-year ARM averaged 2.54 percent.

The PMMS is focused on conventional, conforming, fully amortizing home purchase loans for borrowers who put 20 percent down and have excellent credit. Average commitment rates should be reported along with average fees and points to reflect the total upfront cost of obtaining the mortgage. Visit the following link for the Definitions. Borrowers may still pay closing costs which are not included in the survey.

Residential construction spending up 18.4% | Cross River Real Estate

NAHB analysis of Census Construction Spending data shows that total private residential construction spending rose 0.9% in April after an increase of 0.7% in March 2022. Spending stood at a seasonally adjusted annual rate of $891.5 billion. Total private residential construction spending was 18.4% higher than a year ago.

These monthly gains are attributed to the strong growth of spending on improvements. Spending on improvements rose 1.5% in April, after a dip of 0.1% in March, as it was approaching summer, the best time of year to remodel. Single-family construction spending increased to a $477.7 billion annual pace in April, up by 0.5% over the upwardly revised March estimates. Multifamily construction spending rose 0.8% in April, after a decrease of 0.4% in March. Home building is still facing higher interest rates and supply-side headwinds.

The NAHB construction spending index, which is shown in the graph below (the base is January 2000), illustrates construction spending on single-family, multifamily and improvements have slowed down the pace since early 2022 under the pressure of supply-chain issues and elevated interest rates. Before the COVID-19 hit the U.S. economy, single-family construction and home improvement experienced solid growth from the second half of 2019 to February 2020, and the quick rebound since July 2020. New multifamily construction spending has picked up the pace after a slowdown in the second half of 2019.

Private nonresidential construction spending decreased to $503.2 billion (SAAR) in April from the upwardly revised March estimates. And it was 10.1% higher than a year ago. The largest month-over-month nonresidential spending increase was made by the class of power ($1.6 billion), followed by transportation ($0.8 billion), and class of health care ($0.35 billion).

read more…

eyeonhousing.org

Mortgage rate averages 5.11% | Cross River Real Estate

 Freddie Mac (OTCQB: FMCC) today released the results of its Primary Mortgage Market Survey® (PMMS®), showing that the 30-year fixed-rate mortgage (FRM) averaged 5.11 percent.

“Mortgage rates increased for the seventh consecutive week, as Treasury yields continued to rise,” said Sam Khater, Freddie Mac’s Chief Economist. “While springtime is typically the busiest homebuying season, the upswing in rates has caused some volatility in demand. It continues to be a seller’s market, but buyers who remain interested in purchasing a home may find that competition has moderately softened.”

News Facts

  • 30-year fixed-rate mortgage averaged 5.11 percent with an average 0.8 point as of April 21, 2022, up from last week when it averaged 5.00 percent. A year ago at this time, the 30-year FRM averaged 2.97 percent.
  • 15-year fixed-rate mortgage averaged 4.38 percent with an average 0.8 point, up from last week when it averaged 4.17 percent. A year ago at this time, the 15-year FRM averaged 2.29 percent.
  • 5-year Treasury-indexed hybrid adjustable-rate mortgage (ARM) averaged 3.75 percent with an average 0.3 point, up from last week when it averaged 3.69 percent. A year ago at this time, the 5-year ARM averaged 2.83 percent.

The PMMS® is focused on conventional, conforming, fully amortizing home purchase loans for borrowers who put 20 percent down and have excellent credit. Average commitment rates should be reported along with average fees and points to reflect the total upfront cost of obtaining the mortgage. Visit the following link for the Definitions. Borrowers may still pay closing costs which are not included in the survey.

Con Ed raises Westchester electric prices 11.2%, gas prices up 18.2% | Cross River Real Estate

Con Edison has asked the state for permission to raise gas and electric prices next year, citing the need to cover costs including system upgrades and renewable energy investments.

The utility company hopes to hike electric and gas bills by 11.2% and 18.2%, respectively, it said in a statement provided to NY1. That increase would amount to around $1.2 billion more in electric revenue and $500 million in gas revenue, the company said. 

The price hikes would “vary by customer class,” the company said in a press release, noting in a separate document that its customer classes include residential units and commercial properties.

Con Edison said the hikes are needed so it can upgrade its gas and electric delivery systems. The company is also planning to invest more in renewable energy, including electric vehicles and clean heat.

In addition, the company would put some of the revenue toward moving “vulnerable overhead electric cables and other equipment” below ground to prevent storm-related outages, with a focus on “disadvantaged communities,” the release said.

“Con Edison is in a unique position to lead the transition to a clean energy future with better public health, a vibrant economy and more equality of opportunity for all,” Con Edison President Matthew Ketschke said in a statement. “That’s why we want to dramatically increase our energy efficiency incentives, make electric vehicle charging more convenient, and encourage heat pumps as an alternative to gas heating.”

The proposal is “designed to fund the investments necessary for a safe and reliable clean energy future… and our operating expenses, like local property taxes,” the company’s statement added. 

In January 2020, the State Public Service Commission voted to allow Con Edison to raise electric prices by 13.5% and gas prices by 25%, in yearly increments, by this year.

read more…

ny1.com/nyc/

NY Among Top States Residents Are Fleeing From | Cross River Real Estate

The Pandemic Continued to Influence Americans’ Decisions to Move as They Relocated to Lower-Density Areas and Desired to be Closer to Family

Interactive Map: To understand inbound and outbound percentages for each state, use the legend. To view reasons for moving and demographic data, select the year and state that you would like to view using the dropdown menus. (If you are using a desktop computer, you can use your mouse to click and select a state.) Please note that percentages pertaining to demographic data may not always total 100% due to respondents having the ability to opt out of answering survey questions and/or to select more than one survey response per question.

United Van Lines released the company’s 45th Annual National Movers Study today, which indicates Americans were on the move to lower-density areas and to be closer to their families throughout last year.

The annual study, which tracks the company’s exclusive data for customers’ state-to-state migration patterns, determined Vermont as the state with the highest percentage of inbound migration (74%) with United Van Lines. Topping the list of outbound locations was New Jersey (71%), which has held the spot for the past four years.

South Dakota (69%), South Carolina (63%), West Virginia (63%) and Florida (62%) were also revealed as the top inbound states for 2021. Meanwhile, states like Illinois (67%), New York (63%), Connecticut (60%) and California (59%), which have regularly appeared on the top outbound list in recent years, again ranked among states with the largest exoduses.

In addition to the state-by-state data, each year United Van Lines also conducts an accompanying survey to examine the motivations and influences for Americans’ interstate moves. This year’s survey results indicated 31.8% of Americans who moved did so in order to be closer to family – a new trend coming out of the pandemic as priorities and lifestyle choices shift. Additionally, 32.5% of Americans moved for a new job or job transfer, a significant decrease from 2015, when more than 60% of Americans cited a job or transfer.

“This new data from United Van Lines is indicative of COVID-19’s impact on domestic migration patterns, with 2021 bringing an acceleration of moves to smaller, midsized towns and cities,” Michael A. Stoll, economist and professor in the Department of Public Policy at the University of California, Los Angeles, said. “We’re seeing this not only occur because of Americans’ desire to leave high density areas due to risk of infection, but also due to the transformation of how we’re able to work, with more flexibility to work remote.”

What’s more, amid the pandemic, many Gen Xers are retiring (often at a younger age than past generations), joining the Baby Boomer generation. While many are retiring to states like Florida, United Van Lines’ data reveals they’re not necessarily heading to heavily populated cities like Orlando and Miami — they’re venturing to less dense places like Punta Gorda (81% inbound), Sarasota (79% inbound) and Fort Myers-Cape Coral (77% inbound). Similarly, in Oregon, cities including Medford-Ashland (83%) and Eugene-Springfield (79%) saw high inbound migration in 2021.

“For 45 years now, our annual United Van Lines study, with its data-driven insights, has allowed us to explore a deeper understanding of Americans’ overall migration patterns,” Eily Cummings, director of corporate communications at United Van Lines, said. “As the pandemic continues to impact our day-to-day, we’re seeing that lifestyle changes — including the increased ability to work from home — and wanting to be closer to family are key factors in why Americans are moving today.”

Moving In

The top inbound states of 2021 were:

  1. Vermont
  2. South Dakota
  3. South Carolina
  4. West Virginia
  5. Florida
  6. Alabama
  7. Tennessee
  8. Oregon
  9. Idaho
  10. Rhode Island

Of the top ten inbound states, six — Vermont, South Dakota, West Virginia, Alabama, Oregon and Idaho — are among the 20 least densely populated states in America, with less than 100 people per square mile. And, Tennessee and South Carolina are among the top 25.

Moving Out

The top outbound states for 2021 were:

  1. New Jersey
  2. Illinois
  3. New York
  4. Connecticut
  5. California
  6. Michigan
  7. Massachusetts
  8. Louisiana
  9. Ohio
  10. Nebraska

Balanced

Several states saw nearly the same number of residents moving inbound as outbound.

Kentucky and Wyoming are among these “balanced states.”

Since 1977, United Van Lines annually tracks migration patterns on a state-by-state basis. The 2021 study is based on household moves handled by United within the 48 contiguous states and Washington, D.C. and ranks states based off the inbound and outbound percentages of total moves in each state. United classifies states as “high inbound” if 55 percent or more of the moves are going into a state, “high outbound” if 55 percent or more moves were coming out of a state or “balanced” if the difference between inbound and outbound is negligible.

To access the study details and creative assets, use the link to the press kit at the top or bottom of the page.

read more…

unitedvanlines.com/newsroom/

Case-Shiller reports 19.5% price gain | Cross River Real Estate

Home prices continued to increase across the U.S., but the pace declined slightly in September.

At this rate, mortgage rate increases could triple home price growth.
Adobe Stock

The S&P CoreLogic Case-Shiller U.S. National Home Price NSA Index, which covers all nine U.S. Census divisions, reported a 19.5% annual gain in September, down from 19.8% in the previous month.

The 10-City Composite annual increase came in at 17.8%, down from 18.6% in the previous month, while the 20-City Composite posted a 19.1% year-over-year gain, down from 19.6% in the previous month.

“If I had to choose only one word to describe September 2021’s housing price data, the word would be ‘deceleration,’” says Craig J. Lazzara, managing director and global head of index investment strategy at S&P Dow Jones Indices. “Housing prices continued to show remarkable strength in September, though the pace of price increases declined slightly.”

Out of the 20 cities included in the report, Phoenix, Tampa, Florida, and Miami reported the highest year-over-year gains in September. Phoenix led the way with a 33.1% year-over-year price increase, followed by Tampa with a 27.7% increase and Miami with a 25.2% increase.

“Phoenix’s 33.1% increase led all cities for the 28th consecutive month,” continues Lazzara. “Tampa rose to second place in September, and Miami edged out DallasSan Diego, and Las Vegas for the bronze medal. Prices were strongest in the South and the Sun Belt, but every region logged double-digit gains.”

Before seasonal adjustment, the U.S. National Index posted a 1% month-over-month increase in September, while the 10-City and 20-City Composites both posted increases of 0.7% and 0.8%, respectively. After seasonal adjustment, the index posted a month-over-month increase of 1.2%, and the 10-City and 20-City Composites both posted increases of 0.8% and 1%, respectively.

read more…

builderonline.com/data-analysis/

Producer prices rise 8.6% | Cross River Real Estate

  • Producer prices increase 0.6% in October
  • PPI rises 8.6% year-on-year
  • Core PPI shoots up 0.4%; gains 6.2% year-on-year

U.S. producer prices increased solidly in October, driven by surging costs for gasoline and motor vehicle retailing, suggesting that high inflation could persist for a while amid tight global supply chains related to the pandemic.

The Federal Reserve last week restated its belief that current high inflation is “expected to be transitory.” A tightening labor market as millions remain at home is adding to price pressures, which together with shortages of goods sharply restrained economic growth in the third quarter.

The Fed this month started reducing the amount of money it is injecting into the economy through monthly bond purchases.

“The acceleration in inflation may not fade as quickly as previously thought, particularly for businesses because of the global supply-chain issues,” said Ryan Sweet, a senior economist at Moody’s Analytics in West Chester, Pennsylvania. “Elevated inflation is turning up the heat on the Fed but they haven’t shown signs of buckling as they will stomach higher inflation to get the labor market back to full employment quickly.”

The producer price index for final demand rose 0.6% last month after climbing 0.5% in September, the Labor Department said on Tuesday. That reversed the slowing trend in the monthly PPI since spring. In the 12 months through October, the PPI increased 8.6% after a similar gain in September.

Economists polled by Reuters had forecast the PPI advancing 0.6% on a monthly basis and rising 8.7% year-on-year.

More than 60% of the increase in the PPI last month was due to a 1.2% rise in the prices of goods, which followed a 1.3% jump in September. A 6.7% surge in gasoline prices accounted for a third of the rise in goods prices. There were increases in the prices of diesel, gas and jet fuel as well as plastic resins.

Wholesale food prices dipped 0.1% as the cost of beef and veal tumbled 10.3%. Prices for light motor trucks fell as the government introduced new-model-year passenger cars and light motor trucks into the PPI.

Exorbitant motor vehicle prices have accounted for much of the surge in inflation as a global semiconductor shortage linked to the nearly two-year long COVID-19 pandemic has forced manufactures to cut production, leaving virtually no inventory.

Services gained 0.2% last month after a similar rise in September. An 8.9% jump in margins for automobiles and parts retailing accounted for more than 80% of the increase in services. The cost of transportation and warehousing services jumped 1.7%, also reflecting snarled supply chains.

Surveys from the Institute for Supply Management this month showed measures of prices paid by manufacturers and services industries accelerating in October. Manufacturers complained about “record-long raw materials lead times, continued shortages of critical materials, rising commodities prices and difficulties in transporting products.”

Data on Wednesday is expected to showed strong gains in consumer prices in October, according to a Reuters survey of economists. Stocks on Wall Street retreated from record highs. The dollar was steady against a basket of currencies. U.S. Treasury prices rose.

Inflation
Inflation

PORT CONGESTION

There is congestion at ports and widespread shortages of workers at docks and warehouses. There were 10.4 million job openings as of the end of August. The workforce is down 3 million from its pre-pandemic level.

Worker shortages were underscored by a report from the NFIB on Tuesday showing almost 50% of small businesses reported job openings they could not fill in October.

Also on Tuesday, Fed Chair Jerome Powell emphasized the U.S. central bank’s commitment to maximum employment, telling a virtual conference on diversity and inclusion in economics, finance and central banking that “an economy is healthier and stronger when as many people as possible are able to work.” read more

Wholesale prices of apparel, footwear and truck transportation of freight also rose last month as did the costs of food and alcohol retailing, hospital outpatient care as well as machinery, equipment parts and supplies.

Excluding the volatile food, energy and trade services components, producer prices shot up 0.4%. The so-called core PPI gained 0.1% in September. In the 12 months through October, the core PPI rose 6.2%. That followed a 5.9% advance in September.

Construction prices surged 6.6%, the largest gain since the series was incorporated into the PPI data in 2009.

“As companies feel the squeeze from higher energy and labor costs, as well as persistent logistics issues, producer price increases should be robust in the coming months,” said Will Compernolle, a senior economist at FHN Financial in New York.

Details of the PPI components, which feed into the personal consumption expenditures (PCE) price index, excluding the volatile food and energy component, were mixed. The core PCE price index is the Fed’s preferred measure for its flexible 2% target. Healthcare costs increased 0.4%. Airline tickets rebounded 0.3%, but portfolio management fees dropped 2.2%.

Though the October CPI data is still pending, economists believed that the core PCE price index moved higher last month after increasing 3.6% year-on-year in September.

“For now, we think the core PCE price index will be up 3.8% year-on-year in October,” said Daniel Silver, an economist at JPMorgan in New York.

read more…

reuters.com/business/us-producer-prices-8.6%

Pending home sales fell 8.3% in August | Cross River Real Estate

Contracts to buy U.S. previously owned homes rebounded to a seven-month high in August, but higher prices as supply remains tight are slowing the housing market momentum.

Other data on Wednesday showed applications for loans to buy a house fell last week as mortgage rates increased after the Federal Reserve signaled it would likely begin reducing its monthly bond purchases as soon as November. There are indications that supply could improve in the fall.

“Supply constraints that are boosting prices are impacting affordability and have been a headwind for buyers,” said Rubeela Farooqi, chief U.S. economist at High Frequency Economics in White Plains, New York. “Gradually easing supply constraints should be a positive, although affordability concerns could temper sales in the very near term.”

The National Association of Realtors (NAR) said its Pending Home Sales Index, based on signed contracts, jumped 8.1% last month to 119.5. That was the highest reading since January and followed two straight monthly declines.

Economists polled by Reuters had forecast contracts, which become sales after a month or two, increasing 1.4%. Compared with a year ago, pending home sales fell 8.3% in August.

The housing market boomed early in the COVID-19 pandemic amid an exodus from cities as people worked from home and took classes online. But the pandemic tailwind is fading as vaccines allow workers to return to offices.

Pending home sales
Pending home sales

Expensive homes are also sidelining some first-time buyers from the market. The NAR reported last week that the share of first-time buyers was the smallest in more than 2-1/2 years in August. Existing home sales dropped last month. 

Data on Tuesday showed consumer sentiment towards buying a home weakening for a third straight month in September and house prices posting record gains in July from a year-ago.

Lumber prices have plummeted from record highs scaled in May, which economists and realtors hope will encourage builders to ramp-up construction of single-family homes. The resumption of foreclosures after a pandemic moratorium is also expected to ease the inventory crunch.

But house prices are likely to remain elevated, which together with rising mortgage rates could further erode affordability. In a separate report on Wednesday, the Mortgage Bankers Association said applications for loans to buy a home fell 1.2% last week from the prior week.

Loan purchase applications were down 12% from a year ago. According to the MBA, mortgage rates across all loan types increased since last Wednesday’s announcement by the Fed, with the benchmark 30-year fixed rate reaching its highest level since early July.

MBA
MBA

The U.S. central bank’s massive monthly bond buying program to aid the economy’s recovery from the pandemic has helped to keep mortgage rates low. With U.S. Treasury yields rising in recent days, mortgage rates could creep higher, which could draw some buyers into the market in anticipation of further rises.

“We anticipate home sales will trend sideways over the remainder of 2021,” said Mahir Rasheed, a U.S. economist at Oxford Economics in New York.

The surge in pending home sales last month was led by the South and Midwest regions, where the NAR said house price increases have been generally moderate relative to the rest of the country. Contracts soared 10.4% in the Midwest and vaulted 8.6% in the densely populated South. They rose 4.6% in the Northeast and advanced 7.2% in the West.

read more…

reuters.com/world/us