
S&P CoreLogic Case-Shiller Index Reports 4.3% Annual Home Price Gain In June
S&P Dow Jones Indices today released the latest results for the S&P CoreLogic Case-Shiller Indices, the leading measure of U.S. home prices. Data released today for June 2020 show that home prices continue to increase at a modest rate across the U.S. More than 27 years of history are available for these data series, and can be accessed in full by going to www.spdji.com.
Please note that transaction records for March, April, May and June 2020 for Wayne County, MI are unavailable due to delays at the local recording office caused by the COVID-19 lockdown. Since Wayne is the most populous county in the Detroit metro area, S&P Dow Jones Indices and CoreLogic are unable to generate a valid March, April, May and June 2020 update of the Detroit S&P CoreLogic Case-Shiller indices for the August release.
When the sale transaction data flow resumes for Wayne County, S&P Dow Jones Indices and CoreLogic will provide estimated Detroit index values for months with missing updates.
YEAR-OVER-YEAR
The S&P CoreLogic Case-Shiller U.S. National Home Price NSA Index, covering all nine U.S. census divisions, reported a 4.3% annual gain in June, no change from the previous month. The 10-City Composite annual increase came in at 2.8%, down from 3.0% in the previous month. The 20-City Composite posted a 3.5% year-over-year gain, down from 3.6% in the previous month.
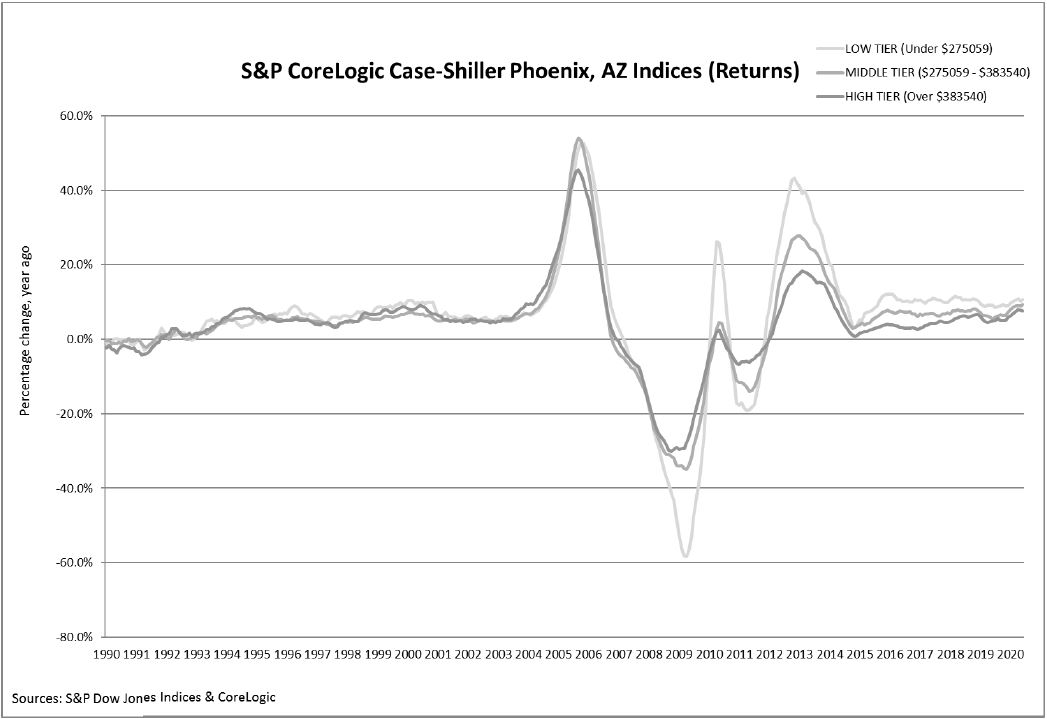
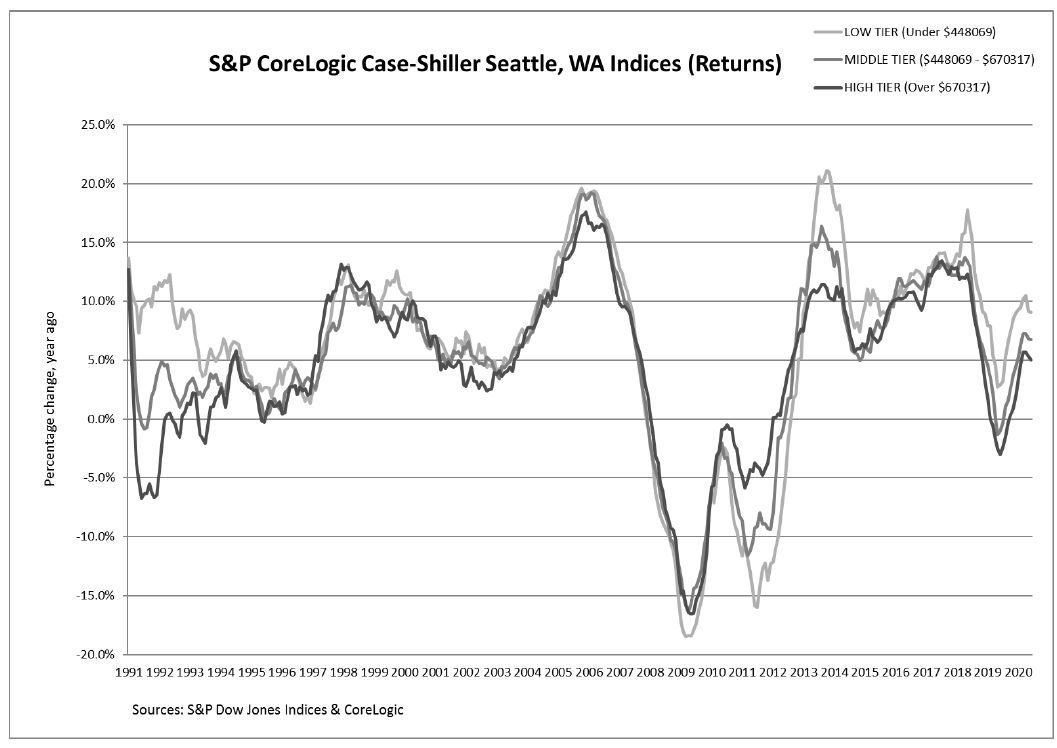
Phoenix, Seattle and Tampa continued to report the highest year-over-year gains among the 19 cities (excluding Detroit) in June. Phoenix led the way with a 9.0% year-over-year price increase, followed by Seattle with a 6.5% increase and Tampa with a 5.9% increase. Five of the 19 cities reported higher price increases in the year ending June 2020 versus the year ending May 2020.
The charts on the following page compare year-over-year returns of different housing price ranges (tiers) for Phoenix and Seattle.
MONTH-OVER-MONTH
The National Index posted a 0.6% month-over-month increase, while the 10-City and 20-City Composites posted increases of 0.1% and 0.2% respectively before seasonal adjustment in June. After seasonal adjustment, the National Index posted a month-over-month increase of 0.2%, while the 10-City Composite posted a decrease of 0.1% and the 20-City Composite did not post any gains. In June, 16 of 19 cities (excluding Detroit) reported increases before seasonal adjustment, while 12 of the 19 cities reported increases after seasonal adjustment.
ANALYSIS
“Housing prices were stable in June,” says Craig J. Lazzara, Managing Director and Global Head of Index Investment Strategy at S&P Dow Jones Indices. “The National Composite Index rose by 4.3% in June 2020, as it had also done in May (June’s growth was slightly lower in the 10- and 20-City Composites, which were up 2.8% and 3.5%, respectively). More data will be required to understand whether the market resumes its previous path of accelerating prices, continues to decelerate, or remains stable. That said, it’s important to bear in mind that deceleration is quite different from an environment in which prices actually fall.
“June’s gains were quite broad-based. Prices increased in all 19 cities for which we have data, accelerating in five of them. Phoenix retains the top spot for the 13th consecutive month, with a gain of 9.0% for June. Home prices in Seattle rose by 6.5%, followed by Tampa at 5.9% and Charlotte at 5.7%. As has been the case for the last several months, prices were particularly strong in the Southeast and West, and comparatively weak in the Midwest and (especially) Northeast.
read more…