With today’s release of the April S&P/Case-Shiller Home Price Index, we learned that seasonally adjusted home prices for the benchmark 20-city index were up 0.33% month over month which is cut to 0.16% with inflation adjustment. The nonseasonally adjusted index was up 4.0% year-over-year.
Investing.com had forecast a 0.5% MoM seasonally adjusted increase and 4.0% YoY nonseasonally adjusted for the 20-city series.
Here is the analysis from today’s Standard & Poor’s press release:
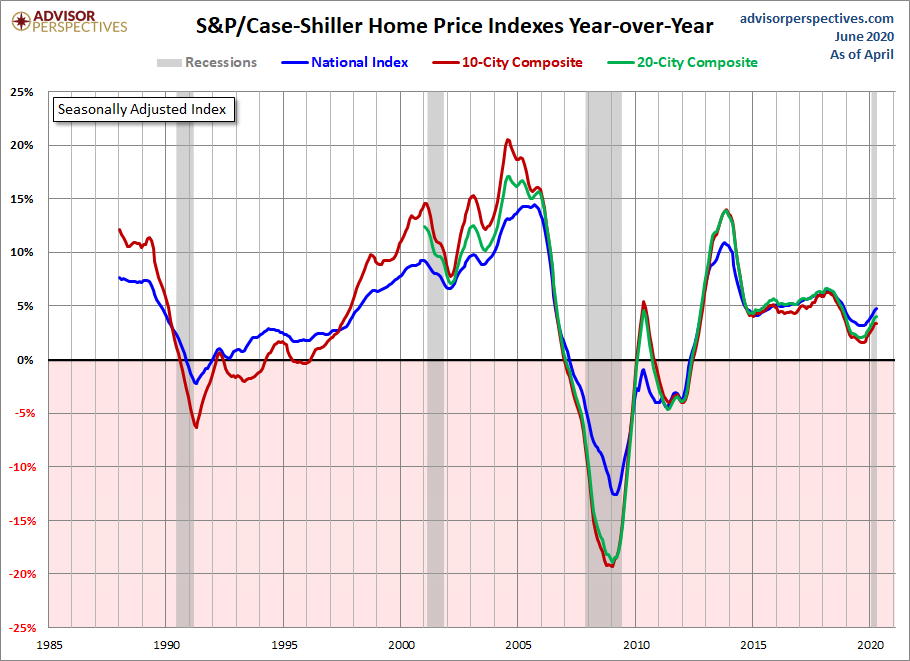
“April’s housing price data continue to be remarkably stable,” says Craig J. Lazzara, Managing Director and Global Head of Index Investment Strategy at S&P Dow Jones Indices. “The National Composite Index rose by 4.7% in April 2020, with comparable growth in the 10- and 20-City Composites (up 3.4% and 4.0%, respectively). In all three cases, April’s year-over-year gains were ahead of March’s, continuing a trend of gently accelerating home prices that began last fall. Results in April continued to be broad-based. Prices rose in each of the 19 cities for which we have reported data, and price increases accelerated in 12 cities.
“As was the case in March, we have data from only 19 cities this month, since transactions records for Wayne County, Michigan (in the Detroit metropolitan area) continue to be unavailable. This is, so far, the only directly visible impact of COVID-19 on the S&P CoreLogic Case-Shiller Indices. The price trend that was in place pre-pandemic seems so far to be undisturbed, at least at the national level. Indeed, prices in 12 of the 20 cities in our survey were at an all-time high in April.
“Among the cities, Phoenix retains the top spot for the 11th consecutive month, with a gain of 8.8% for April. Home prices in Seattle rose by 7.3%, followed by increases in Minneapolis (6.4%) and Cleveland (6.0%). Prices were particularly strong in the West and Southeast, and comparatively weak in the Northeast.” [Read more]
The chart below is an overlay of the Case-Shiller 10- and 20-City Composite Indexes along with the national index since 1987, the first year that the 10-City Composite was tracked. Note that the 20-City, which is probably the most closely watched of the three, dates from 2000. We’ve used the seasonally adjusted data for this illustration.
The next chart shows the year-over-year Case-Shiller series, again using the seasonally adjusted data.
Here is the same year-over-year overlay adjusted for inflation with the Consumer Price Index owners’ equivalent rent of residences.
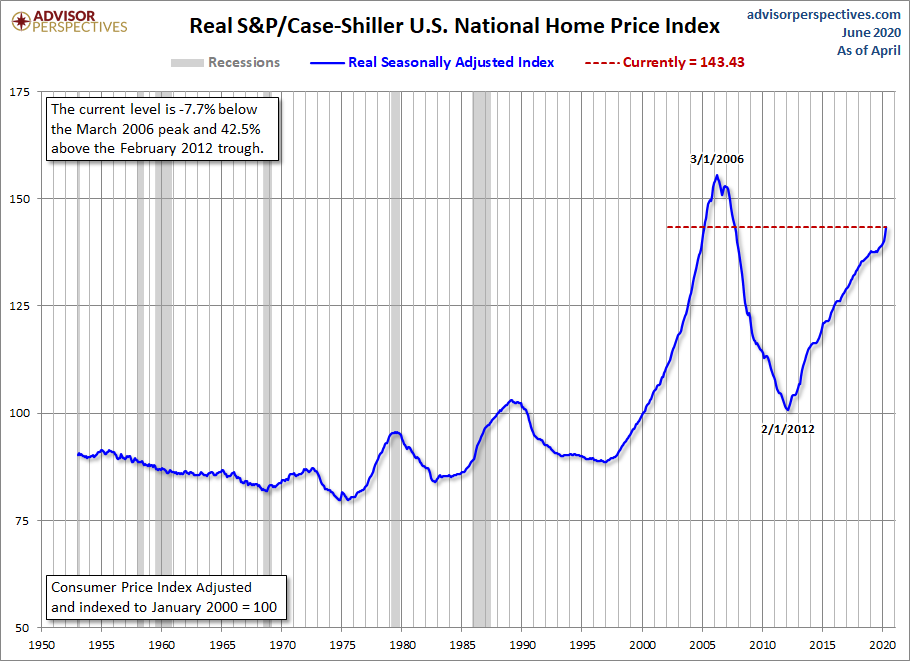
For a long-term perspective on home prices, here is a look at the seasonally and inflation-adjusted Case-Shiller price index from 1953, the first year that monthly data is available. Because the CPI owners’ equivalent rent of residences didn’t start until 1983, we’ve used the broader seasonally adjusted Consumer Price Index.
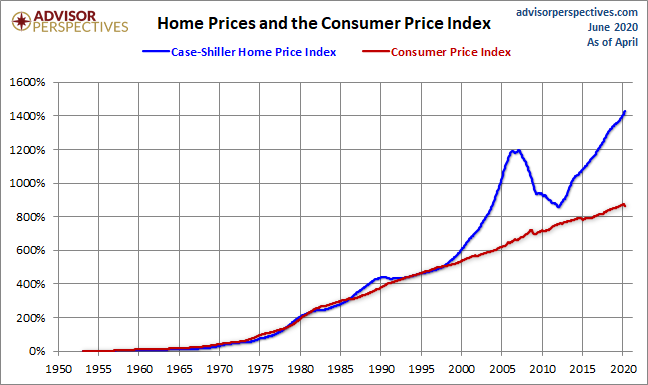
To get an even better idea of the trend in housing prices over long time periods, we compare the change in the seasonally-adjusted Case-Shiller Home Price Index and the Consumer Price Index since 1953.
For additional perspectives on residential real estate, here is the complete list of our monthly updates:
read more…
This post was last modified on %s = human-readable time difference 10:33 am
Just back out of hospital in early March for home recovery. Therapist coming today.
Sales fell 5.9% from September and 28.4% from one year ago.
Housing starts decreased 4.2% to a seasonally adjusted annual rate of 1.43 million units in…
OneKey MLS reported a regional closed median sale price of $585,000, representing a 2.50% decrease…
The prices of building materials decreased 0.2% in October
Mortgage rates went from 7.37% yesterday to 6.67% as of this writing.
This website uses cookies.