Tag Archives: South Salem Real Estate

Northeast, Midwest Markets Warm up as Year Winds Down | South Salem Real Estate

Outside it may be cold and snowy with early storms, but housing prices are warning up in some of the most stunningly negative Midwestern and Northeastern markets, according to Clear Capital’s November market report.

Regionally the West still leads the appreciation parade, with quarterly increases of 1.2 percent and annualized price growth at 7.5 percent.  But the Northeast and Midwest both gained ground compared to earlier in the year.  The Northeast saw an increase in quarterly growth in November, a 0.1% uptick. This is an unexpected shift for a region that, just a few months prior, lagged behind the rest of the country in quarterly growth.

“As the year draws to a close, housing continues to recalibrate and the Midwest maintains its impressive trend. November’s data shows Detroit up 135% from the trough, with other regional MSAs demonstrating strong growth. In January we predicted that the Midwest would be a frontrunner this year for both homeowners and investors, and the region’s small percentage point gains, subsiding losses, and decreased volatility indicate steady improvement that is reflective of the greater recovery,” wrote Alex Villacorta, Ph.D., vice president of research and analytics at Clear Capital.

Other market showing new life in the second half of the year are:

  • Providence, R.I. – a mainstay on the list of lowest performing markets until October – has seen a huge increase in growth, jumping from -0.8% quarterly growth in October to 3.1% in November. Gains of this magnitude are more expected during the early spring season, when markets typically gain momentum leading into the peak summer season.
  • Cleveland and Detroit have also seen a similar upward pattern during this typically slower season. Quarterly growth in Cleveland has bumped up 0.2% to 2.2% quarterly growth, while Detroit’s quarterly growth has upticked 0.1% from October to 2.5% quarterly growth in November.
  • While these increases are notable, bringing Cleveland 52.3% and Detroit a whopping 135.1% above trough, don’t be blindsided by the numbers. Cleveland is still -37.1% below peak while Detroit is -39.3%, demonstrating that both MSAs still have a long road to recovery ahead.


read more…


http://www.realestateeconomywatch.com/2015/12/northeast-midwest-markets-warm-up-as-year-winds-down/

Year-on-year, new home sales grew 4.9 percent | South Salem Real Estate

Sales of new single-family houses in October 2015 were at a seasonally adjusted annual rate of 495,000, up 10.7 percent from last month but below market expectations.

The inventory of properties for sale reached the highest since early 2010 while both median and average prices decreased.

New Home Sales in the United States averaged 654.25 Thousand from 1963 until 2015, reaching an all time high of 1389 Thousand in July of 2005 and a record low of 270 Thousand in February of 2011.

New Home Sales in the United States is reported by the U.S. Census Bureau.

United States New Home Sales


Mortgage Rates average 3.97% this week | South Salem Real Estate

Freddie today released the results of its Primary Mortgage Market Survey® (PMMS®), showing average fixed mortgage rates largely unchanged as analyst expectation turned from world events to the Federal Open Market Committee’s (FOMC) October minutes.

News Facts

  • 30-year fixed-rate mortgage (FRM) averaged 3.97 percent with an average 0.6 point for the week ending November 19, 2015, down from last week when it averaged 3.98 percent. A year ago at this time, the 30-year FRM averaged 3.99 percent.
  • 15-year FRM this week averaged 3.18 percent with an average 0.5 point, down from last week when it averaged 3.20 percent. A year ago at this time, the 15-year FRM averaged 3.17 percent.
  • 5-year Treasury-indexed hybrid adjustable-rate mortgage (ARM) averaged 2.98 percent this week with an average 0.5 point, down from last week when it averaged 3.03 percent. A year ago, the 5-year ARM averaged 3.01 percent.
  • 1-year Treasury-indexed ARM averaged 2.64 percent this week with an average 0.3 point, down from 2.65 percent last week. At this time last year, the 1-year ARM averaged 2.44 percent.

Average commitment rates should be reported along with average fees and points to reflect the total upfront cost of obtaining the mortgage. Visit the following links for theRegional and National Mortgage Rate Details and Definitions. Borrowers may still pay closing costs which are not included in the survey.

As of January 1, 2016, the PMMS will no longer provide results for the 1-year ARM or the regional breakouts for the 30-year and 15-year fixed rate mortgages, or the 5/1 Hybrid ARM

Housing: A Near-term Pullback in Home Sales Is Likely | South Salem Real Estate

This week’s housing news revealed the latest data on two leading indicators of home sales, both of which point to additional retrenchment in existing home sales in the near-term.

Pending home sales dropped in August, marking the second decline over the past three months. Combined with the second consecutive drop in average monthly purchase applications in August, existing home sales will likely soften further after posting a 4.8 percent drop in August from an expansion-high pace in July.

Our forecast that 2015 total home sales will be the strongest since 2007 remains on target, however. While purchase applications dropped during the final week of September, average applications for the entire month rose for the first time in three months and are about 23 percent and 8 percent higher than during the same period in 2014 and 2013, respectively. Low mortgage rates will remain supportive for the housing market.

The Freddie Mac survey’s average yield on 30-year fixed-rate mortgages ticked down to 3.85 percent, staying below 4.0 percent for the tenth consecutive week. Home price trends continue to be strong.

The S&P/Case-Shiller house price index showed solid year-over-year appreciation in July, albeit at a more moderate pace than other main measures of home prices reported earlier. Strong housing demand during the summer season, lean inventories, and fewer distressed sales helped boost home prices.

The August construction spending report suggests that real residential investment will likely post solid growth this quarter, though not as strong as the 9.4 percent annualized pace recorded for the second quarter.

 The National Association of REALTORS® Pending Home Sales Index, which records contract signings of existing homes and typically leads closings by one to two months, dropped 1.4 percent to 109.4 in August, the lowest level since March. Pending sales are 6.1 percent above the level a year ago, the smallest year-over-year gain since November 2014. Pending sales dropped in the Northeast, Midwest and South, with the largest decline occurring in the Northeast. The West was the only region that saw a rise in pending sales.

 Private residential construction spending advanced 1.3 percent in August from the prior month, according to the Census Bureau. Spending on new single-family homes rose 0.7 percent, compared with a 4.8 percent jump for multifamily spending. Data for the prior two months were revised lower. Spending for home improvement increased 0.7 percent. From a year ago, new single-family and multifamily construction spending increased 14.0 percent and 24.7 percent, respectively.

 The S&P/Case-Shiller 20-city Composite Home Price Index (not seasonally adjusted) rose 0.6 percent in July. From a year ago, the index increased 5.0 percent, a slight pickup from 4.9 percent pace of the prior month. Of the 20 cities, San Francisco, Denver, and Dallas posted the largest year-over-year increases, while New York City, Chicago, and Washington, D.C. saw the smallest gains. The pace of increase for the national index also firmed slightly in July, posting a 4.7 percent year-over-year gain, compared with a 4.5 percent gain in June. Other measures of home prices, including the FHFA purchase-only index and the CoreLogic index, also showed a pickup in year-over-year increases in July.


Read more… fanniemae.com

Freddie Mac September 2015 Insight & Outlook | South Salem Real Estate

Freddie Mac (OTCQB: FMCC) released today its monthly Insight & Outlook for September looking at the challenges faced by three types of student loan borrowers, and how loan down payment mortgage loans could help, or not help, make homeownership possible. A video preview, along with the complete monthly Insight & Outlook commentary is available here.

Insight Highlights

  • Is the student debt overhang holding back home ownership among Millennials?
  • While the home ownership rate has been declining for all age groups, the rate among Millennials is particularly low.
  • Student debt tripled over the past 10 years, reaching $1.2 trillion in the fourth quarter of 2014. Aggregate student debt expanded for all age groups, however the balances are concentrated among those under 30 years old and those between 30 and 39 years old.
  • Before the crisis, homeownership rates of 27-to-30-year-olds with student loans (evidence of at least some college education) were 2 to 3 percent higher than homeownership rates of those with no student loans. That gap began to close during the recession and reversed in 2011. By 2014 the homeownership rate of borrowers was about one percentage point lower than the rate of non-borrowers.
  • Recent findings suggest that it may be useful to think of student loan borrowers as being divided into three groups: Successful investors, Disappointed earners, and At-risk borrowers.
  • The At-risk Borrowers group is a particular focus for Freddie Mac’s efforts to support prudent, affordable lending to low-and-moderate income borrowers. The impact on credit scores of poor repayment performance may make it particularly difficult to assist some members of this group.
  • For the Disappointed Earners — and even some of the Successful Investors — Freddie Mac’s Home Possible Advantage(SM) program, with its option to pay as little as 3 percent down, may provide help in purchasing that first home.

Outlook Highlights

  • At the current pace, home sales this year are expected to be the highest since 2007. Existing home sales in August fell a little short of expectations, but the inventory of existing homes for sale remained below the 6-month mark.
  • The faster-than-expected decline in the unemployment rate is boosting demand for homes. However, a more significant contributor is likely the continued low level of mortgage rates, which has kept affordability high despite impressive gains in house prices. The interest rate on 30-year fixed rate mortgages averaged 3.90 percent in August, and the rate on 15-year fixed rate mortgages averaged 3.12 percent.
  • Based on upward revisions of the 2014 Home Mortgage Disclosure Act (HMDA) data on mortgage origination, and stronger-than-expected housing activity in the first half of 2015, Freddie Mac has increased its estimate of 2015 mortgage originations to $1.53 trillion and 2016 originations to $1.40 trillion.

Quote: Attributed to Sean Becketti, Chief Economist, Freddie Mac.

“The low homeownership rate among Millennials is still something of a puzzle — it cannot be explained solely by the increase in student loan debt. However student debt plays a role — higher balances are associated with a lower probability of homeownership at every level of college and graduate education. And recent data has confirmed that not all student debt is created equal. Students who attended schools with less-certain educational benefits have not fared well. Borrowers who did not complete their studies have fared worst of all. These groups are likely to continue to affect the pattern of homeownership among Millennials. Moreover, a change just this month in Federal Housing Administration policy will make it more difficult for some student loan borrowers to qualify for a mortgage.”

“Our Outlook this month shows the economy has not kicked into gear yet, and the Fed’s recent decision to defer increasing short-term interest rates suggests they share this view. At the same time, the housing market is on its way to having the best year since the recovery began. Keep in mind. Though. that the housing sector is coming back from rock bottom and housing activity remains weak compared to historical norms. At the same time, Fed watchers must feel they are watching a revival of Waiting for Godot. Approaching every meeting of the Federal Open Market Committee, the market braces itself for a Fed tightening, only to watch the Committee delay any action for at least one more meeting.”

Homes for $350,000 | South Salem Real Estate

What does a $350,000 home look like? The image that pops into your head likely depends on where you live.

A San Franciscan may be hard-pressed to imagine even the smallest condo being sold for that price. But an Atlanta resident might have a variety of homes in mind, from the impeccably decorated bungalow down the street to the ritzy condo downtown.

Whether you’re searching for a smaller space in a big city or a bigger space in a quiet neighborhood, you have some great options. Check out the following 10 listings, all located in metropolitan locales across the country and priced at approximately $350,000.

Oakland, CA

2757 Parker Ave, Oakland, CA
For sale: $340,000

Oakland, CA

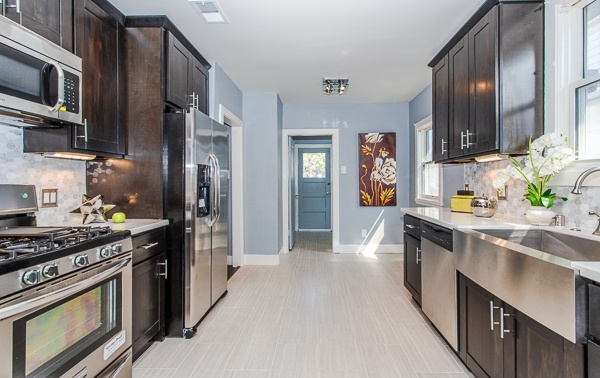
Featuring a kitchen worthy of any culinary adventure, this remodeled 2-bedroom, 1-bathroom home is ready for cocktail parties and holiday dinners.

See more homes for sale in Oakland.

Memphis, TN

2344 Wood Bridge Cv, Memphis, TN
For sale: $345,000

Memphis, TN

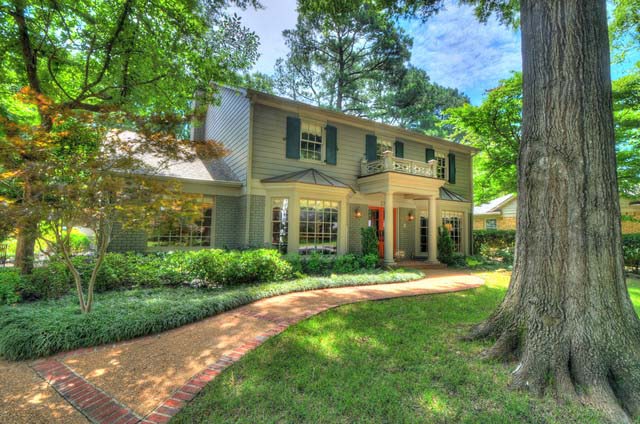
Boasting major curb appeal with its storybook façade and setting, this 5-bedroom, 3-bathroom home is a sight to behold.

See more Memphis homes for sale.

Philadelphia, PA

605 N 12th St, Philadelphia, PA
For sale: $335,000

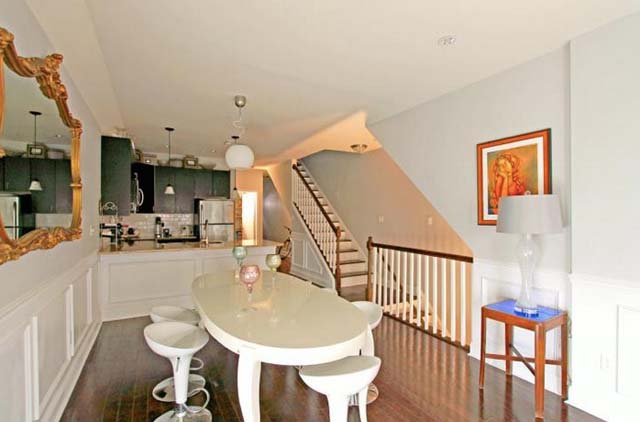
Philadelphia, PAA modern kitchen, hardwood floors, and patio/garden area make this elegant, 2-bedroom, 2.5-bathroom townhouse a prime spot for entertaining guests.

See more homes listed in Philadelphia.

Minneapolis, MN

4745 Blaisdell Ave, Minneapolis, MN
For sale: $349,900

Minneapolis, MN

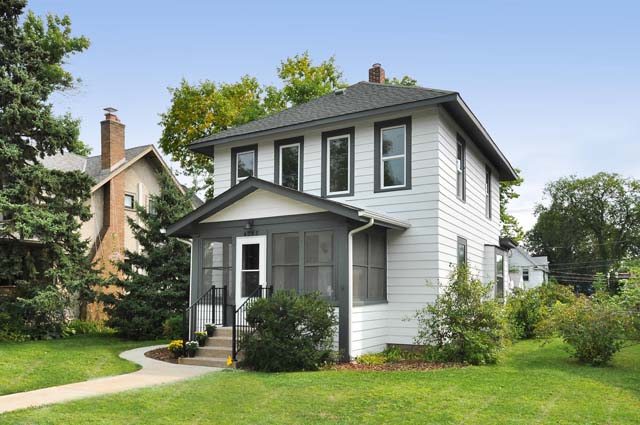
In addition to boasting a stunning interior, this fully renovated, 3-bedroom, 2-bathroom home has a large, fenced backyard — perfect for kiddos and/or pets.

See more homes listed in Minneapolis.

Boston, MA

143 Forest Hills St UNIT 2, Boston, MA
For sale: $339,000

Boston, MA

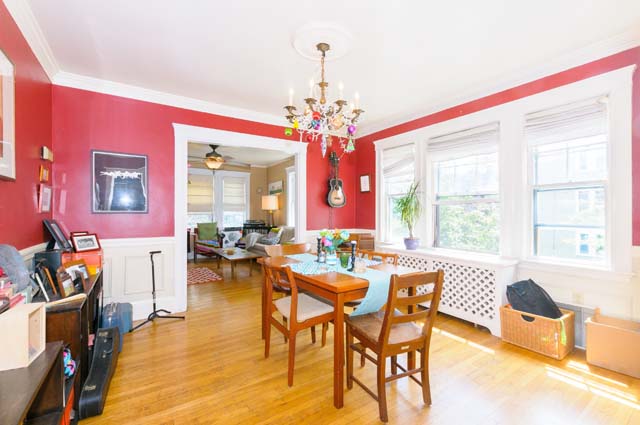
French doors open to a sunlit living room, flowing seamlessly into a bright dining room. This 2-bedroom, 1-bathroom condo also boasts a large kitchen, hardwood floors, and two porches.

See more Boston homes for sale.

Fort Lauderdale, FL

732 SW 13th Ave, Fort Lauderdale, FL
For sale: $350,000

Fort Lauderdale, FL

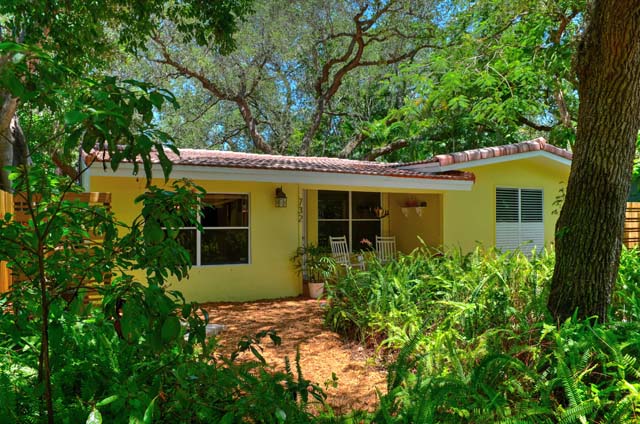
Nestled in a historic neighborhood, this 3-bedroom, 2-bathroom home offers desirable, tranquil living with tile floors, a modern kitchen, and a huge backyard.

See more homes for sale in Fort Lauderdale.


read more…


http://www.zillow.com/blog/how-much-home-for-350000-182373/?utm_source=feedburner&utm_medium=email&utm_campaign=Feed%3A+ZillowBlog+%28Zillow+Blog%29

Foreclosure Rates, Inventory Continue to Drop: CoreLogic | South Salem Real Estate

Foreclosure inventory and completed foreclosures declined drastically during June, real estate analytics firm CoreLogic found in its monthly survey.

Foreclosure inventory declined 28.9% on a year-over-year basis in June to 472,000 homes. Completed foreclosures also declined year-over-year, down 14.8% to 43,000. Likewise, the number of homes in “serious delinquency,” which the firm defined as 90 days or more past due on mortgage payments, declined 23.3%.

“The foreclosure rate for the U.S. has dropped to its lowest level since 2007, supported by a continuing decline in loans made before 2009, gains in employment and higher housing prices,” said CoreLogic chief economist Frank Nothaft in a release.

“The decline has not been uniform geographically, as the foreclosure rate varies across metropolitan areas,” he said, adding that Tampa, Fla., and Nassau and Suffolk counties in New York have seen increased foreclosure rates.

“Serious delinquency is at the lowest level in seven and a half years reflecting the benefits of slow but steady improvements in the economy and rising home prices,” said CoreLogic president and chief executive Anand Nallathambi in the release. “We are also seeing the positive impact of more stringent underwriting criteria for loans originated since 2009 which has helped to lower the national seriously delinquent rate.”


read more…


http://www.nationalmortgagenews.com/news/distressed/foreclosure-rates-inventory-continue-to-drop-corelogic-1058484-1.html

Nearly Half of Homes in Top Markets are Losing Value | South Salem Real Estate

Despite market reports of strong median home price appreciation this spring, gains are very uneven and nearly half of homes in ten of the nation’s largest markets actually lost value in May. On a house-by-house basis, about one-third fewer homes in the largest markets gained value during the heart of the spring buying season this year compared to last, according to Weiss Residential Research’s Indexes.

Only 54 percent of homes in the markets appreciated during May compared to 81 percent in May 2014, a sign that the downward trend may continue in the coming months.  In Denver, the hottest market in the nation, 84 percent of houses appreciated in May compared to 95 percent last year.  In the Washington, DC market, weakest of the top ten, only 34 percent of houses gained value in May compared to 57 percent in May 2014.

“Don’t be fooled by averages,” said Allan Weiss, founder and CEO of Weiss Residential Research.  ‘All of the largest metro indexes are rising more slowly than they were a year ago though market reports give the impression that values are rising across the board.  However people don’t own the entire market, they own one house.”

Larger homes are having a harder time than smaller homes with two bedrooms or less.  In Denver, larger homes appreciated 5.8 percent on a year over year basis in May compared to smaller homes.  In Washington, DC, larger homes actually fell -0.7 percent.  Smaller homes declined less, -0.2 percent year over year.


Same Pattern as the Housing Crash

In a metro like DC with a median price increase of 1.2 percent in the past year according to Case-Shiller, 60 percent of the houses are rising and the other 40 percent are stagnant or falling.  Since the ones that are appreciating outnumber the ones falling the average is a low positive number, Weiss said.

“The same pattern occurred before the great housing meltdown ten years ago.  The percent of houses rising in DC declined from 100 percent to 60 percent while the metro index showed a slowdown but did not go negative.  Once the population of houses that had been rising fell below 50 percent, the index began its descent,” Weiss said.


read more…


http://www.realestateeconomywatch.com/2015/07/nearly-half-of-homes-in-top-markets-are-losing-value/

US housing market is on fire | South Salem Real Estate

We just got another sign the housing market is on fire.

On Wednesday, we learned that existing home sales jumped to the fastest pace since February 2007.

Sales rose 3.2% month-over-month to an annualized pace of 5.49 million.

Economists had forecast a rise of 0.9% to an annualized pace of 5.40 million.

In the release from the National Association of Realtors, Lawrence Yun noted that the past two months were the strongest for sales since early 2007.

“This wave of demand is being fueled by a year-plus of steady job growth and an improving economy that’s giving more households the financial wherewithal and incentive to buy,” Yun said.

Ian Shepherdson, chief US economist at Pantheon Macroeconomics, said in a note out after the report, “In one line: strong across the board.”

But this isn’t the first sign the housing market is roaring back. On Friday we got housing data that posted eight-year highs from the Census Bureau, showing that housing starts rose 9.8% to an annualized pace of 1.174 million, the highest since July 2007.

Building permits, which point to the pace of future construction, rose 7.4% to an annualized pace of 1.343 million.

In Wednesday’s release, NAR president Chris Polychron said that even with the uptick in home prices, demand is still solid across the board.

“The demand for buying has really heated up this summer,” Polychron said, “leading to multiple bidders and homes selling at or above asking price. Furthermore, tight inventory conditions are being exacerbated by the fact that some homeowners are hesitant to sell because they’re not optimistic they’ll have adequate time to find an affordable property to move into.”

fredgraphconstrution spendingFRED

And as we highlighted over the weekend, the housing market is reflecting a bigger macroeconomic story of a US economy that is picking up steam.

Deutsche Bank’s Joe LaVorgna spelled this out in a note to clients on Tuesday, writing:

“We remain positive on the housing outlook. The economy has created nearly 3 million jobs over the past year, the unemployment rate is almost a percentage point lower, and consumers have saved well over $100 billion in energy costs over the last 12 months. Moreover, as we highlighted in the latest US Economics Weekly, commercial banks continue to ease lending standards for mortgages …”

LaVorgna continued:

In short, there are several positive tailwinds for the housing sector that should result in a more pronounced pickup in activity over the next several quarters. If this is the case, policymakers should become more confident that consumer spending, which accounts for roughly 70% of GDP, is on firm footing.

And it’s not just economists who are bullish on housing. The Federal Reserve’s latest beige book noted an uptick in real-estate activity in several of its 12 districts. The bullish signs are everywhere.

Read more: http://www.businessinsider.com/existing-home-sales-july-22-2015-7#ixzz3gdhXWob8


3 Reasons It’s Not a Seller’s Housing Market | South Salem Real Estate

If you’re considering purchasing a home, but worried that rising home prices mean you’ll pay too much for a house, think again. Just because home prices have risen doesn’t mean it’s a seller’s market out there. Here’s why.

1. Home Prices Aren’t Necessarily Inflated

Home prices have gone up, but have they done so unreasonably? Rewind to 2012, the unemployment rate exceeded 8%, short sales and foreclosures were still rampant, consumer confidence was low, the prospect of job growth was bleak and the general consensus was that the economy was still licking its wounds from the recession. People don’t buy homes when they’re feeling skittish about their job. Fast forward to 2015, job growth is getting traction, the banks are clearing foreclosures from their balance sheets and short sales are dropping. The result? Because the pendulum swung so far in the opposite direction with drastically low real estate prices several years ago, today’s prices in general are a reasonable correction of a settling housing market.

The likelihood for prices to continue to rise by leaps and bounds while credit is still tight is a shot in the dark, as wage strength has still not peaked. Remember, banks still have tight constraints on lending and are especially picky when approving large mortgages. Home prices in many markets are in direct proportion to the local economy. Take San Francisco, for example, where home prices are, without question, exorbitant. The tech industry is having a massive boom, driving prices up. The stronger the local economy, the more people working, the more support housing prices will have to remain strong.

2. Many Sellers Have Unrealistic Expectations

This average home price appreciation has brought sellers out of the woodwork in hopes of attaining a maximum price. Many have expectations far larger then what the market will bear. The best example of this is a home listed on the market for longer than 30 days within a strong local economy. Look at Sonoma County, Calif., where if a house is on the market longer than 30 days without a contract, it’s a good sign the property is listed too high. The only alternative is to drop the list price to induce an offer. It’s not uncommon at all these days to have a home close escrow at a price beneath the original listing price. (If you’re a seller who’s not sure what to offer on a house, talk with your real estate agent and take their advice — this is what you hire them to do.)

3. Multiple Offers Are Less Common

A good indication of a seller’s market is when there are large numbers of multiple offers – say eight to 10 – for each listed property. That is a strong indicator of the true seller’s market, much like it was in early 2014 and even summer of 2014. But these days I’m seeing that a handful of offers at best is more realistic. Less competition means a greater opportunity to get your foot in the door.

Consider this: Mortgage rates are down, increasing affordability. More people can afford to pay a little bit more for a home and not feel financially squeezed because their housing payment is lower. Prices do rise in relationship to what a ready and able buyer is willing to pay for a property. But the basics also come into play, including the location of the property, school district, bedrooms, bathrooms and lot size are all critical factors in the listing price of a home. Agents know this, but not so much sellers, who still believe they can get top dollar for their property regardless of whether they really can.


read more…


http://finance.yahoo.com/news/3-reasons-not-sellers-housing-181010833.html