The prices of building materials decreased 0.2% in October (not seasonally adjusted) following a 0.5% decline in September according to the latest Producer Price Index (PPI) report. The index has decreased four of five months for the first time since 2015. The PPI for goods inputs to residential construction, including energy, was led 0.2% higher by prices of diesel fuel (+9.5%) and unleaded gasoline (+5.7%).
The price index of services inputs to residential construction decreased 0.7% in October, the seventh consecutive monthly decline. Prices have fallen a total of 14% since the index last increased in March 2022 and are just 1.4% higher than they were a year ago.
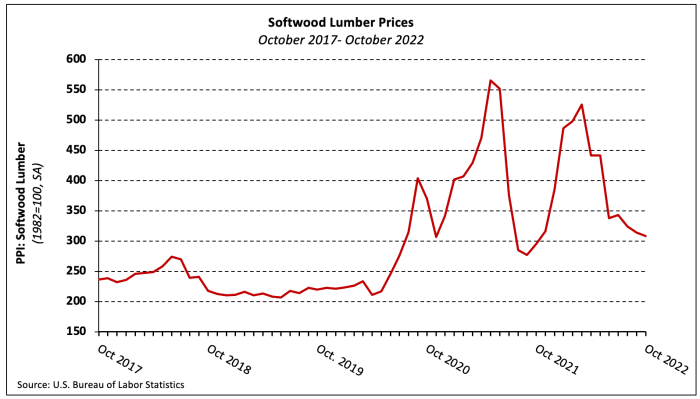
Softwood Lumber
The PPI for softwood lumber (seasonally adjusted) fell 1.7% in October following 5.5% and 3.1% declines in August and September, respectively. Softwood lumber prices are 4.4% higher than they were a year ago but have fallen 41.3% since March. The index remains 3.0% above pre-pandemic levels.
Steel Mill Products
Steel mill products prices decreased 6.6% in October and have fallen 21.6% since May 2022. The index is at its lowest level since May 2021 after five straight monthly declines, each of which has been larger than the last.
Ready-Mix Concrete
The PPI for ready-mix concrete (RMC) increased 0.4% in October but, similar to steel mill products, the pace of increases has slowed each of the past three months. The index has climbed 9.1%, year-to-date, the largest October YTD increase in the series’ 34-year history.
The monthly increase in the national data was entirely driven by a 2.0% price increase in the Northeast region. Prices declined in the Midwest (-0.4%) and South (-0.3%) and were unchanged in the West.
Gypsum Building Materials
The PPI for gypsum building materials edged 0.2% lower in October—just the second monthly decrease since September 2020. The index is 45.6% higher than its January 2020 level.
Transportation of Freight
The price of truck, rail, and ocean transportation of freight each decreased in October. Trucking freight prices fell 1.4%–the fifth consecutive decline—while the indexes for rail and deep sea transportation of freight decreased 0.7% and 1.8%, respectively. Year-to-date, the prices of ocean, rail, and truck freight transportation have increased 25.2%, 6.5%, and 6.0%.
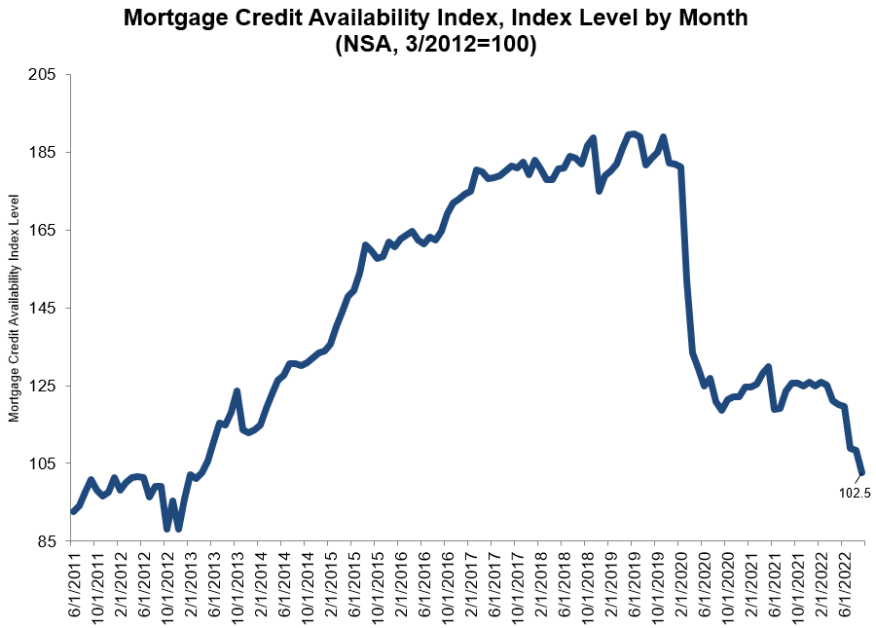
A decline in the MCAI indicates that lending standards are tightening, while increases in the index indicate loosening credit. The index was benchmarked to 100 in March 2012.
The Conventional MCAI decreased 4.9%, while the Government MCAI decreased by 5.7%. Of the component indices of the Conventional MCAI, the Jumbo MCAI decreased by 5.8%, while the Conforming MCAI fell by 3.6%.
“Credit availability fell to the lowest level since March 2013 — the seventh consecutive month of tightening,” said Joel Kan, MBA’s associate vice president of economic and industry forecasting. “With the likelihood of a weakening economy, which would lead to an increase in delinquencies, there was a smaller appetite for lower credit score and high LTV (loan-to-value) loan programs, along with a reduction in government streamline refinance programs. As mortgage rates have more than doubled over the past year, resulting in a drop in refinance activity, lenders have worked to reduce excess capacity and costs by eliminating underutilized loan programs.”
Kan added that all of the MCAI’s component indices declined last month, “with most of the indices falling to their lowest levels in over a year. In particular, the government credit availability index has declined in seven of the last eight months to its lowest level since April 2013.”
Single-family starts declined further in May, as higher interest rates weighed on housing affordability. This follows a sixth straight monthly decline for the NAHB/Wells Fargo HMI. Additionally, the cost and availability of materials, lumber, labor and lots remain key supply-side headwinds. Single-family permits decreased 5.5% to a 1.05 million unit rate in May. Despite declines for housing affordability, a lack of resale inventory continues to partially support demand for home construction.
Overall housing starts declined to 1.55 million units on an annual basis in May, according to a report from the U.S. Department of Housing and Urban Development and the U.S. Census Bureau. The decline was due to weakening for single-family and multifamily construction. The May reading of 1.55 million starts is the number of housing units builders would begin if development kept this pace for the next 12 months.
Within this overall number, single-family starts decreased 9.2% to a 1.05 million seasonally adjusted annual rate. The multifamily sector also fell back off extremely strong April numbers, declining 23.7% in May to a more sustainable 498,000 annualized rate of starts.
With inflation running at a 40-year high, economic policy needs to focus on improving the supply side of the economy by bringing down material, energy and transportation costs. Due to supply-chain effects, there are 152,000 single-family units authorized but not started construction—up 3.4% from a year ago. However, this total number has leveled off recently with slowing for single-family permits.
In June single-family builder confidence decreased 2 points to a level of 67, according to the NAHB/Wells Fargo Housing Market Index (HMI). After peaking at a level of 90 in November 2020, builders have reported ongoing concerns over elevated lumber, OSB and other construction costs, as well as delays in obtaining building materials. The sharp rise in mortgage interest rates for the first half of 2022 has also had an impact on the volume of home construction.
Consequently, the market has now passed an inflection point whereby single-family home building is weakening. We expect further declines in the months ahead, which itself is a recession warning for the quarters ahead. For instance, single-family permits decreased 5.5% to a 1.05 million unit rate. This is the lowest pace for single-family permits since July 2020.
On a regional and year-to-date basis, combined single-family and multifamily starts are 2.1% higher in the Northeast, 1.2% higher in the Midwest, 12.9% higher in the South and 4.3% higher in the West.
Overall permits decreased 7.0% to a 1.70 million unit annualized rate in May. Multifamily permits decreased 9.4% to an annualized 647,000 pace.
Looking at regional permit data on a year-to-date basis, permits are 8.3% lower in the Northeast, 5.2% higher in the Midwest, 4.6% higher in the South and 1.6% higher in the West.
As an indicator of the economic impact of housing and as a result of accelerating permits and starts in recent quarters, there are now 822,000 single-family homes under construction. This is 24% higher than a year ago. There are currently 843,000 apartments under construction, up 25% from a year ago. Total housing units now under construction (single-family and multifamily combined) is 24% higher than a year ago. The number of units under construction is rising on both the total volume of construction, as well as longer construction times. However, it appears the number of single-family units in the construction pipeline is now peaking for this business cycle.
Freddie Mac (OTCQB: FMCC) today released the results of its Primary Mortgage Market Survey® (PMMS®), showing that the 30-year fixed-rate mortgage (FRM) averaged 4.67 percent.
“Mortgage rates continued moving upward in the face of rapidly rising inflation as well as the prospect of strong demand for goods and ongoing supply disruptions,” said Sam Khater, Freddie Mac’s Chief Economist. “Purchase demand has weakened modestly but has continued to outpace expectations. This is largely due to unmet demand from first-time homebuyers as well as a select few who had been waiting for rates to hit a cyclical low.”
News Facts
30-year fixed-rate mortgage averaged 4.67 percent with an average 0.8 point for the week ending March 31, 2022, up from last week when it averaged 4.42 percent. A year ago at this time, the 30-year FRM averaged 3.18 percent.
15-year fixed-rate mortgage averaged 3.83 percent with an average 0.8 point, up from last week when it averaged 3.63 percent. A year ago at this time, the 15-year FRM averaged 2.45 percent.
5-year Treasury-indexed hybrid adjustable-rate mortgage (ARM) averaged 3.50 percent with an average 0.3 point, up from last week when it averaged 3.36 percent. A year ago at this time, the 5-year ARM averaged 2.84 percent.
The PMMS® is focused on conventional, conforming, fully amortizing home purchase loans for borrowers who put 20 percent down and have excellent credit. Average commitment rates should be reported along with average fees and points to reflect the total upfront cost of obtaining the mortgage. Visit the following link for the Definitions. Borrowers may still pay closing costs which are not included in the survey.
Simple economics popped the lumber bubble last year. Once the price of lumber topped $1,515 per thousand board feet in the spring, do-it-yourselfers en masse stopped buying. At the same time, sawmills trying to cash in on the sky-high prices increased production, contributing to prices plummeting by August to $389 per thousand board feet. Suddenly, lumber buyers, who were used to paying $350 to $500 per thousand board feet prior the pandemic, felt some serious relief.
End of the story, right? Not at all. Since bottoming in August, lumber has gone on another run that’s starting to look a lot like the historic run we saw last spring. As of Friday, the cash market price is back up to $1,111 per thousand board feet. That’s up 186% (or almost triple) above its bottom price in August.
As prices started to spike late last year, suppliers and homebuilders responded by increasing their lumber orders. Stinson Dean, CEO of Deacon Lumber, a lumber trading company, tells Fortune those buyers didn’t want to get caught off-guard like last time so they bought ahead “just in case” prices climbed back to the exorbitant levels of spring 2021. Of course, that influx of buyers only put more upward pressure on prices.
“Demand is phenomenal. We have been inundated with job quotes for the last two months, and have booked record amounts of future business. Buyers don’t want to get caught flat-footed and have the market run away from them like happened a year ago,” says Michael Goodman, director of specialty products at Sherwood Lumber.
Where do we go from here? Industry insiders don’t foresee lumber over $1,000 per thousand board feet as the new normal. Inevitably, sawmills will chase profits and increase production. But it’s tough to say when prices will fall again.
“Ultimately the frenzy will subside likely later in the first quarter or early in the second quarter, and we will start to see headwinds like higher interest rates,” Goodman says. Of course, higher interest rates and mortgage rates, which are expected to rise this year, could slow the housing market and building.
But don’t expect cheap lumber anytime soon. Even if lumber prices pull back somewhat, it doesn’t mean we’re headed back to pre-pandemic levels. There is a shortage of around 4 million homes—a dynamic that is likely going to keep builders busy (aka buying more lumber) for years to come.
In November, consumer prices increased by 6.8% from a year ago. It marks the largest year-over-year gain since June 1982. Supply-chain constraints and strong consumer demand related to the pandemic and the reopening of the economy have contributed to recent price increases in some sectors.
The Bureau of Labor Statistics (BLS) reported that the Consumer Price Index (CPI) rose by 0.8% in November on a seasonally adjusted basis, following an increase of 0.9% in October. Excluding the volatile food and energy components, the “core” CPI increased by 0.5% in November, after a 0.6% increase in October. In November, the price index for a broad set of energy sources increased by 3.5% in November, after a 4.8% increase in October. Gasoline (all type) rose by 6.1% in November, the same increase as in October. It marks its sixth consecutive monthly increase. The food index rose by 0.7% in November as the index for food at home increased by 0.8%.
Like last month, most component indexes increased in November. The indexes for apparel (+1.3%), shelter (+0.5%), airline fares (+4.7%), used cars and trucks (+2.5%), and new vehicles (+1.1%) showed sizeable monthly increases in November. The index for major appliances rose by 2.4% in November, after a 0.9% decline in October. Meanwhile, the indexes for motor vehicle insurance, recreation, and communication all declined in November.
The indexes for owners’ equivalent rent (OER) and rent of primary residence (RPR) both increased by 0.4% over the month. Monthly increases in OER and RPR have averaged 0.4% over the last three months.
During the past twelve months, on a not seasonally adjusted basis, the CPI rose by 6.8% in November, following a 6.2% increase in October. The “core” CPI increased by 4.9% over the past twelve months, following a 4.6% increase in October. The food index rose by 6.1% and the energy index rose by 33.3% over the past twelve months.
NAHB constructs a “real” rent index to indicate whether inflation in rents is faster or slower than overall inflation. It provides insight into the supply and demand conditions for rental housing. When inflation in rents is rising faster (slower) than overall inflation, the real rent index rises (declines). The real rent index is calculated by dividing the price index for rent by the core CPI (to exclude the volatile food and energy components).
The Real Rent Index decreased by 0.1% in November, after a decrease of 0.2% in October. Over the first eleven months of 2021, the monthly change of the Real Rent Index was -0.2%, on average.
Rising housing costs have become an increasingly salientpolitical issue for state-level elected officials across the United States. Local governments have traditionally exerted the most direct control over land use and housing production, yet political and fiscal incentives align to pressure local officials into restrictingnew development, especially of moderately priced homes. However, state governments are increasingly feeling the pinch of poorly functioning housing markets in several ways. Inadequate supply, especially in near job centers and transportation infrastructure, makes it harder for companies to recruit and retain workers. Most new housing is developed on the urban fringe in car-dependent locations, leading to higher traffic volumes and more greenhouse gas emissions. Exclusionary zoning by affluent, high-opportunity communities restricts economic mobility and exacerbates racial and economic segregation. In short, the economic, social, and environmental costs of poorly functioning housing markets spill over beyond local boundaries to affect entire regions and states. State-level action has the potential to improve these outcomes.
In a new study, I examine what state governments can—and should—do to encourage healthy housing markets. I identify four broad goals to guide statewide housing policies, discussed in more detail below. To illustrate the range of existing state policy approaches, I examine the types of policies uses by five contrasting states: California, Massachusetts, Oregon, Utah, and Virginia. To achieve any particular goal, states can use a variety of different policy tools, giving them flexibility to design an approach that fits their economic needs, institutional capacity, and political circumstances.
GOAL #1: ANALYZE STATE HOUSING MARKET CONDITIONS TO DESIGN APPROPRIATE POLICIES
Before adopting or amending housing policies, state leaders should use data to identify key needs and challenges, and design their interventions accordingly. Comparing a handful of simple metrics across the five sampled states illustrates how differences in underlying market conditions can inform policy choices (Figure 1).
Population growth is a primary driver of housing demand: Fast-growing places need to build more housing to accommodate more people. Utah counties experienced by far the highest average population growth (0.16) between 2009 and 2019, three times as high as Massachusetts counties. This implies that the typical Utah locality will need to expand housing supply more than localities in other states, particularly slow-growth states like Massachusetts.
A helpful affordability metric is the ratio of median home values to median household incomes. Value-to-income ratios between 3 and 4 are considered healthy, because they imply that the typical household could buy a home while spending about one-third of their monthly income on housing. Of the studied states, only Utah and Virginia fall in that range. California has (unsurprisingly) the most expensive housing, with median home value-to-income ratios around 7.00—well above any threshold for “affordable.”
The final metric, the share of housing built before 1940, is a proxy for housing quality. Older homes typically have higher maintenance needs, including lower energy efficiency. Massachusetts stands out for having a very large share of older housing.
Although specific policy priorities and strategies will vary across states, based on underlying housing market conditions, most states could benefit from policies to address the next three goals:
Encourage housing production in places with strong demand
Provide financial support to low-income households,
Reduce climate risks
GOAL #2: ENCOURAGE HOUSING PRODUCTION IN PLACES WITH STRONG DEMAND
Current debates over how statewide zoning reform start with the assumption that local governments are overly restrictive of housing, needing more state oversight. This raises the question: Are strict zoning and limited housing production prevalent across all (or most) localities within states? One simple diagnostic is to look at the relationship between housing growth and prices or rents: In well-functioning housing markets, places with strong demand will add more housing, while places with weak demand build very little.
Graphing county-level housing values and changes in the number of homes for our sample states shows the expected positive relationship in four states (Figure 2). In Massachusetts, Oregon, Utah, and Virginia, counties that had higher population growth from 2009 to 2019 had higher housing values in 2019. (Counties offer a consistent unit of analysis across states, although cities and towns also play important roles in land use regulation.) California is the one exception: The more rapidly growing counties are among the least expensive. This corresponds with prior research that affluent counties have the most restrictiveregulations and generally oppose new development.
States have at least four different strategies to incentivize local governments to allow more development in places with strong demand. These can be designed either to apply to all localities within a state or targeted towards specific places where supply lags demand. Broadly defined, these strategies include:
Financial carrots and/or sticks tied to quantitative housing production targets
Oversight of local land use planning
Create a “builders remedy” that allows developers to override local zoning under certain conditions (for instance, to construct below-market-rate housing),
State pre-emption of specific zoning rules
Over the past few years, several states have focused on preemption of narrowly defined rules, especially zoning bans on accessory dwelling units (ADUs) and duplexes. However, the most effective policies will target improved housing outcomes, such as increased production or affordability. Land use regulations are complex and multi-layered, making it easy for localities that don’t want to produce housing to appear compliant on paper while actually not building anything. For example, a city’s zoning might technically allow duplexes, while large setback requirements or low floor-to-area ratios make them financially infeasible or impractical.
GOAL #3: PROVIDE FINANCIAL SUPPORT TO LOW-INCOME HOUSEHOLDS
Even in well-functioning housing markets with abundant housing, the poorest 20% of households in all parts of the U.S. cannot afford even modest market-rate housing without subsidies. This is primarily a reflection of very low wages, and so can be most directly addressed by giving poor households direct financial assistance. Because federal housing subsidies are not an entitlement, only one in four poor renters receive any federal rental subsidy. States have a number of different ways they can support low-income households including:
Household-based rental assistance, such as vouchers and homelessness prevention services
Supply-side rental assistance, including the federal Low-Income Housing Tax Credit (LIHTC) program
Subsidies to help low-income homeowners with maintenance and utility costs,
Down-paymentassistance for first-time homeowners
GOAL #4: REDUCE CLIMATE RISKS
Land use regulation and building codes are part of the toolkit available to state governments to reduce the risk and harm of climate change. Ideally, state environmental protection laws should discourage development in risky and/or sensitive locations (e.g. flood- and fire-prone areas) and encourage climate-friendly homes (energy efficient materials, structures, and locations), while not unduly restricting overall housing stock relative to population and job growth. In practice, states often struggle to balance these goals. The clearest example is California’s landmark environmental protection law, CEQA. Adopted in the 1970s with the intent to limit environmentally damaging development, in recent years CEQA has been weaponized by NIMBY homeowners to block projects with broad public benefits, including climate-friendly projects like bike lanes.
CURRENT STATE HOUSING POLICIES START FROM WIDELY VARYING BASELINES
Housing policies in the five studied states vary along several important dimensions. They represent different points along the intensity and complexity of current policies, from highly complex (California) to lightest touch (Utah and Virginia). The states’ legal and institutional structures—the framework within which localities operate—also vary widely. California sets housing production targets for metro areas and localities—although these targets have not been effectively enforced. California and Oregon have explicit statewide mandates to monitor land use planning and/or housing production. Massachusetts has a statewide “fair share” rule focused on low-income housing, which allows developers to override local zoning under certain conditions. All five states offer some types of housing subsidies, but differ in the target populations and activities. Figure 3 summarizes high-level differences in how each state addresses the four policy goals; specific policies and institutional structures are discussed in more detail in the longer report.
GETTING POLICY JUST RIGHT REQUIRES GOOD DATA, CAREFUL PLANNING, AND A WILLINGNESS TO EXPERIMENT
Because states currently start from such different baselines—both in market conditions and institutional capacity—there is not one consistent set of recommendations that will work for all states. California would benefit from simplifying and streamlining its many complex programs and regulations. Virginia and Utah will need to start slowly, assessing current needs and building up staff capacity. With that caveat, three general rules of good policy can benefit all states.
Do your homework. Thoughtful data analysis is the foundation of solid policy.
Experiment, evaluate, and tweak. It’s hard to get policy “just right” on the first try, especially in such a complex and fast-changing market. Implementing pilot programs that can be evaluated and tweaked before rolling out at scale can help deliver better long-term results.
Keep things simple. Complex policies and regulations require more staff time and resources to administer and oversee and impose higher administrative burdens on grant recipients to comply.
Think hard about unintended consequences. Policies can have ripple effects that undermine their primary goals—and it’s very difficult to reform or repeal harmful policies (like California’s CEQA and Prop 13) once they become deeply entrenched.
Asking rents rose by 10.3% year over year in August, marking the first double-digit YOY increase in the history of the Yardi Matrix Multifamily National Report dataset.
At the same time, overall rents have risen by $25 in August and $140 this year to date, up to a national average rent of $1,539. Overall occupancy has also risen by 0.9% from one year ago, up to 95.6%.
Every metro tracked by Yardi Matrix showed positive year-over-year rent growth in August, except for Queens, New York, at -0.5% and Midland-Odessa, Texas, at -5.5%. Rent growth recovery is widespread, no longer concentrated in Southwest and Southeast tech hubs, owing to residents returning to urban cores, job growth, and an increased savings rate.
All of the top 30 metros now show positive YOY rent growth for the first time since the beginning of the pandemic. Phoenix led the top 30 markets for YOY rent growth at a staggering 22%, followed by Tampa, Florida, at 20.2% and Las Vegas at 19.2%. According to Yardi, all three markets benefit from strong job growth and excess savings that enable renters to afford more expensive apartments. New York and San Francisco remain at the bottom at 2.8% and 1.4%, respectively, below pre-pandemic rent levels.
While YOY rent growth may seem incredibly strong in some gateway markets, Yardi notes these numbers are slightly misleading, as they compare today’s rents with last August, when rent growth in many gateway metros had hit bottom. In an alternate comparison of rent growth pre- and post-pandemic, five out of the seven gateway markets have surpassed rent growth levels observed in March 2020. Miami is in the double digits at 16.2%, followed by Boston at 7%, Chicago at 6.4%, Los Angeles at 4.9%, and Washington, D.C., at 3.9%.
New York and San Francisco remain negative at -3.8% and -3.2%, respectively. Yardi attributes this ongoing growth decline in part to continued remote work, particularly at large companies that have delayed returns to the office due to the surge in the delta variant.
On a month-over-month basis, rents rose by 1.7% in August. All of the top 30 metros saw positive month-over-month rent growth, while 26 out of 30 showed 1% rent growth or higher. Las Vegas led the way with 3.3% rent growth month to month, followed by California’s Inland Empire and Seattle at 3.1%.
Many of the metros in the top 10 for August are secondary markets in the Southeast and Southwest. Kansas City, Missouri, fell to the bottom of the top 30 at 0.2%, followed by San Francisco at 0.5% and the Twin Cities at 0.7%.
Rents for single-family build-to-rent communities rose 13.9% YOY in August, far outpacing growth in the traditional multifamily sector. All of the top 30 metros showed positive rent growth year over year, while 20 out of the top 30 showed double-digit rent growth. Tampa led the way with 38.4% YOY growth, followed by Miami at 26.7%.
Occupancy at single-family build-to-rent communities has risen 1.1% YOY, led by San Antonio—up 6.7% YOY—and Indianapolis and Houston, both up 5.6%.
The National Association of Realtors says the current state of the housing market is absolutely “dire,” the consequence of a housing shortage 30 years in the making.
According to the lobbying group, construction of long-term housing fell 5.5 million units short of historical levels over the past 30 years.
The NAR is calling for a “major national commitment” to build more housing of all types by expanding resources, addressing barriers to new development and making new housing construction an integral part of a national infrastructure strategy.
The report, authored for the NAR by the Rosen Consulting Group, highlighted a “chronic shortage of affordable and available homes [needed to support] the nation’s population,” noting the recent lack of new construction and a prolonged underinvestment in those affordable units as the main culprits.
From 1968 to 2000, the total stock of U.S. housing grew at an average annual rate of 1.7%. In the past 20 years, the U.S. housing stock grew by an annual average rate of 1% — and only 0.7% in the last decade.
In fact, coming off the Great Recession, new home construction in the U.S. between 2010 and 2020 fell 6.8 million units short of what was needed, the report said.
Residential fixed investment (RFI) — the sector of economic activity that accounts for housing construction and renovation — accounted for approximately 5% of the country’s total gross domestic product between 1968 and 2000. In the past 12 years, though, RFI accounted for only 3% of the country’s gross domestic product. This shortfall in RFI, the NAR reported, translated to a $4.4 trillion gap in housing market investment from 2000 to 2020.
Existing-home inventory at the end of April totaled just 1.16 million units, down 20.5% from the prior year.
In looking at underbuilt, major U.S. metros, the New York-Newark-Jersey City metro had an underbuilding gap of 148,650 units in the past nine years — the largest gap in the country, the study claimed. That’s followed only by the San Francisco-Oakland-Hayward metro, which reported a gap of 113,200 units; and the Riverside-San Bernardino-Ontario, California metro, which reported a gap of 107,700 units.
“There is a strong desire for homeownership across this country, but the lack of supply is preventing too many Americans from achieving that dream,” said Lawrence Yun, NAR chief economist. “It’s clear from the findings of this report and from the conditions we’ve observed in the market over the past few years that we’ll need to do something dramatic to close this gap.”
Specifically, NAR President Charlie Oppler said adequate increases in housing construction this decade would add an estimated 2.8 million American jobs and $50 billion in nationwide tax revenue.
“A number of factors from the past 20 years are responsible for the massive housing investment gap we see in America today, but what’s important now is that we find solutions that will get us out of this crisis and provide more stability in future markets,” Oppler said. “Additional public funding and policy incentives for construction will very clearly provide huge benefits to our nation’s economy, and our work to close this gap will be particularly impactful for lower-income households, households of color and millennials.”
In order to fill the underbuilding gap in the next 10 years, the NAR estimated that more than 2 million housing units would need to be built per year – an increase of more than 700,000 units per year relative to the pace of housing production in 2020.
Several potential policy changes were offered up by NAR in the report, including addressing the large shortages of capital for the development of affordable housing by expanding resources and maximizing the potential of existing programs, incentivizing shifts in local zoning and regulatory environments to increase the quantity of developable residential space, and increasing housing supply by promoting conversions of underutilized commercial space.
Oppler added that addressing the national underbuilding gap in the housing market will require a “coordinated approach” to the planning, funding and development of infrastructure.
As part of a $1 trillion national infrastructure plan, President Biden has earmarked $318 billion toward the construction and preservation of affordable housing.
“Mortgage rates have remained under three percent for three consecutive weeks,” said Sam Khater, Freddie Mac’s Chief Economist. “Consumer income and spending are picking up, which is leading to an acceleration in economic growth. The combination of low and stable rates, coupled with an improving economy, is good for homebuyers. It’s also good for homeowners who may have missed prior opportunities to refinance and increase their monthly cash flow.”
News Facts
30-year fixed-rate mortgage averaged 2.96 percent with an average 0.6 point for the week ending May 6, 2021, down from last week when it averaged 2.98 percent. A year ago at this time, the 30-year FRM averaged 3.26 percent.
15-year fixed-rate mortgage averaged 2.30 percent with an average 0.6 point, down from last week when it averaged 2.31 percent. A year ago at this time, the 15-year FRM averaged 2.73 percent.
5-year Treasury-indexed hybrid adjustable-rate mortgage (ARM) averaged 2.70 percent with an average 0.3 point, up from last week when it averaged 2.64 percent. A year ago at this time, the 5-year ARM averaged 3.14 percent.
The PMMS is focused on conventional, conforming, fully amortizing home purchase loans for borrowers who put 20 percent down and have excellent credit. Average commitment rates should be reported along with average fees and points to reflect the total upfront cost of obtaining the mortgage. Visit the following link for the Definitions. Borrowers may still pay closing costs which are not included in the survey.
Freddie Mac makes home possible for millions of families and individuals by providing mortgage capital to lenders. Since our creation by Congress in 1970, we’ve made housing more accessible and affordable for homebuyers and renters in communities nationwide. We are building a better housing finance system for homebuyers, renters, lenders, investors and taxpayers. Learn more at FreddieMac.com, Twitter @FreddieMac and Freddie Mac’s blog FreddieMac.com/blog.