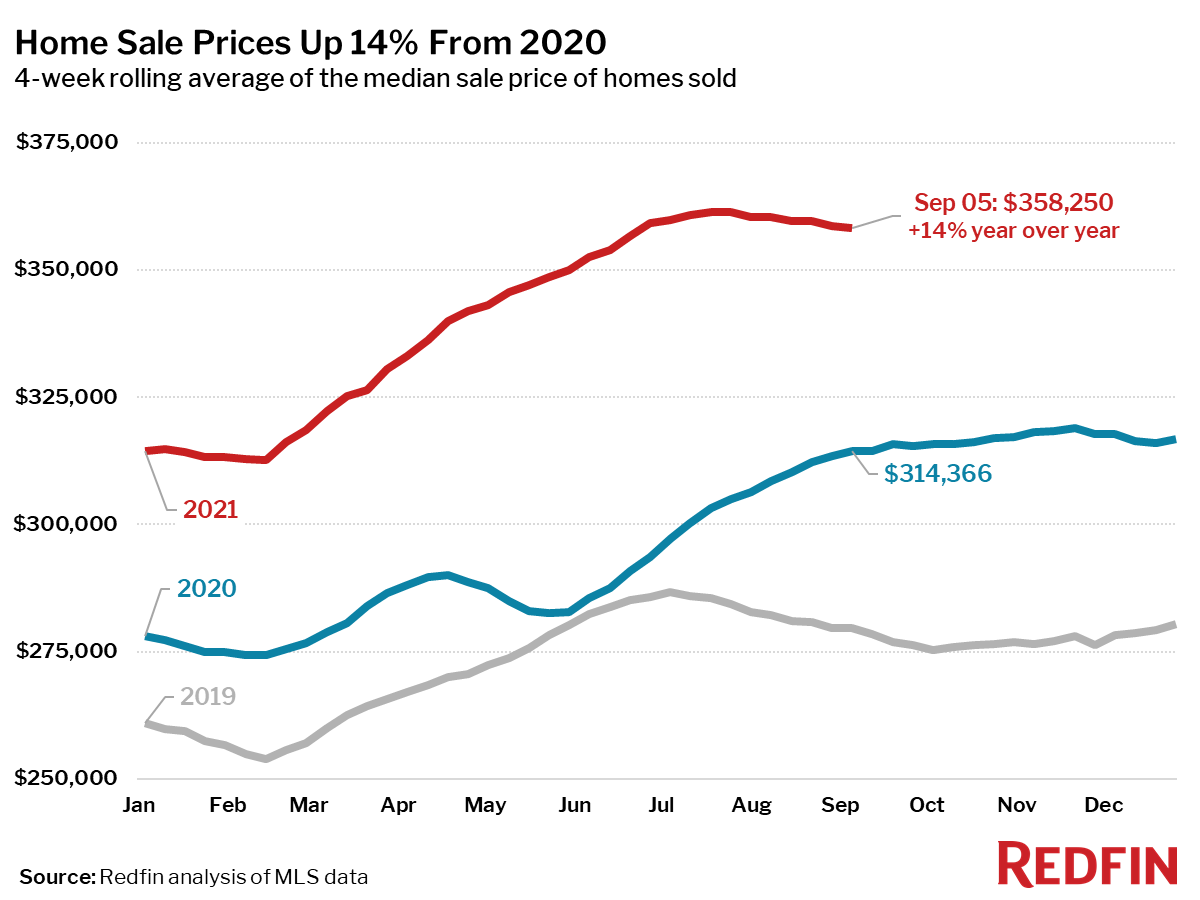
Strong demand pushed home prices up 14% from a year earlier.
Strong home buying demand continued through the end of August, with pending sales up 6% from a year earlier, even as new listings of homes for sale fell 7% from 2020 levels. Measures of competition, such as the share of homes sold above list price and the number of homes sold in two weeks, are continuing to soften. Still, home prices remain high, up 14% from the same time a year ago.
“More homes were listed this summer, but they were quickly snatched up by home buyers even as bidding wars have become more rare,” said Redfin Lead Economist Taylor Marr. “The market hasn’t cooled off any further than it usually does this time of year, and we expect home buying demand to remain strong through the fall.”
Key housing market takeaways for 400+ U.S. metro areas:
Unless otherwise noted, the data in this report covers the four-week period ending September 5. Redfin’s housing market data goes back through 2012.
Data based on homes listed and/or sold during the period:
- The median home-sale price increased 14% year over year to $358,250.
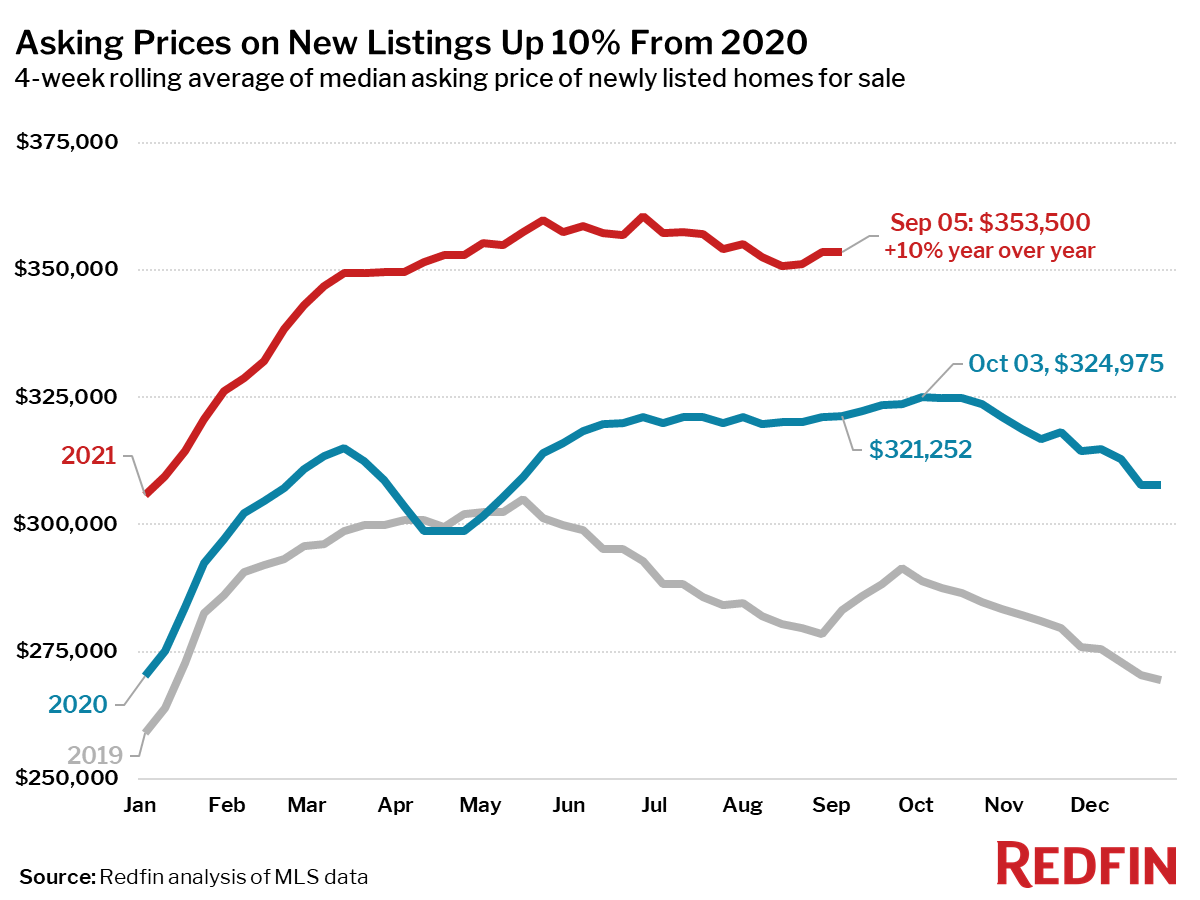
- Asking prices of newly listed homes were up 10% from the same time a year ago to a median of $353,500, on par with where asking prices were in late April. This was down 2% from the all-time high set during the four-week period ending June 27.
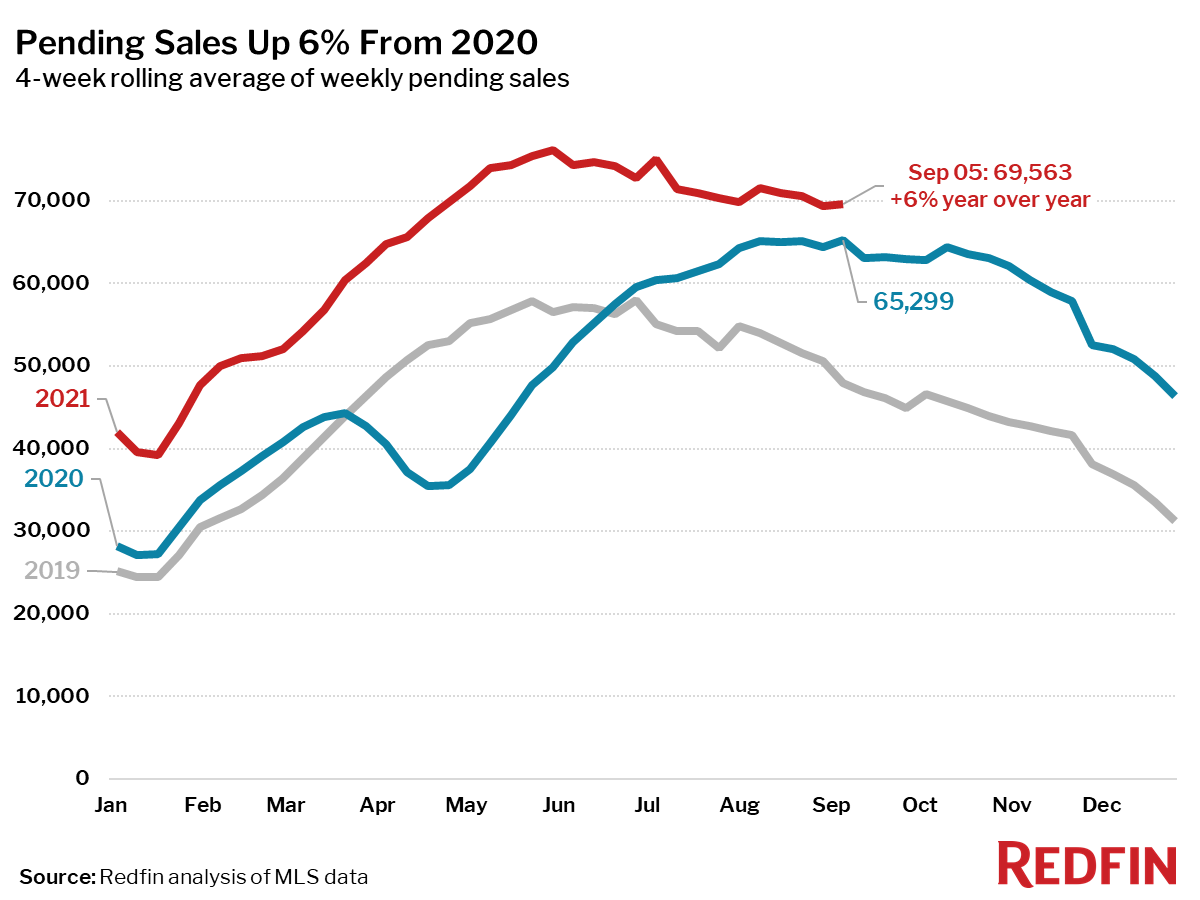
- Pending home sales were up 6% year over year, but down 9% from their 2021 peak hit during the four-week period ending May 30.
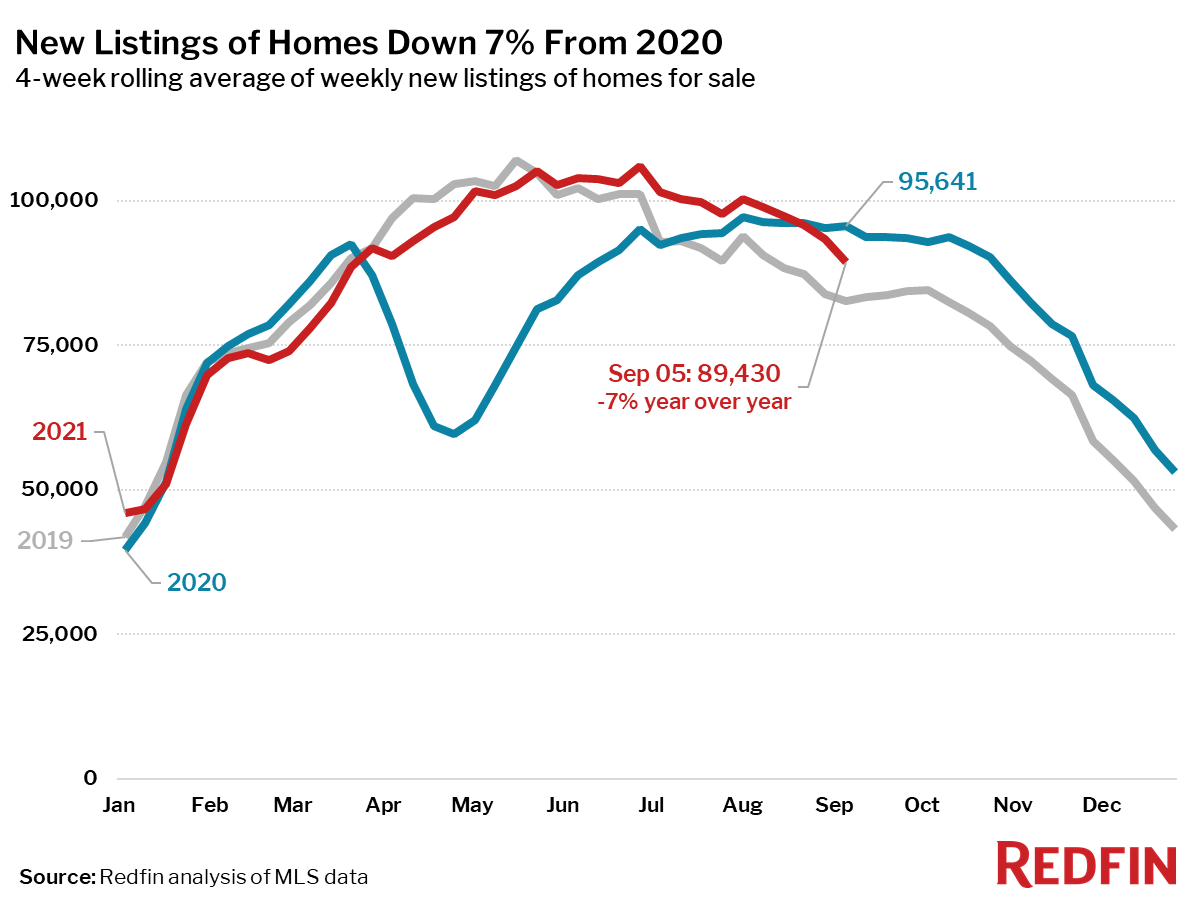
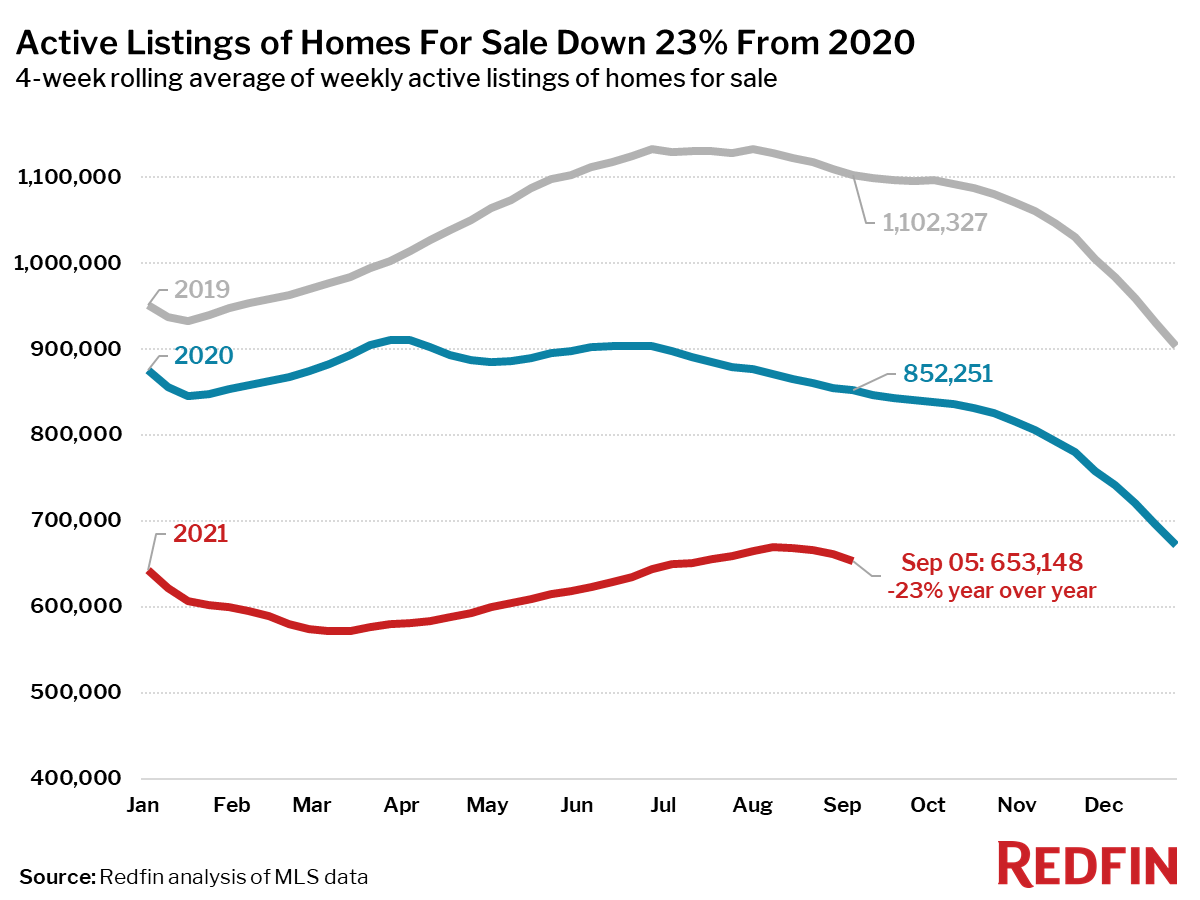
- New listings of homes for sale were down 7% from a year earlier. The number of homes being listed is in a typical seasonal decline, down 16% from the 2021 peak reached during the four-week period ending June 27.
- Active listings (the number of homes listed for sale at any point during the period) fell 23% from 2020. Active listings were up 14% from their 2021 low set during the four-week period ending March 7, but have declined 3% from their 2021 peak hit during the four-week period ending August 8.
- 47% of homes that went under contract had an accepted offer within the first two weeks on the market, above the 43% rate of a year earlier, but down 9 percentage points from the 2021 peak set during the four-week period ending March 28.
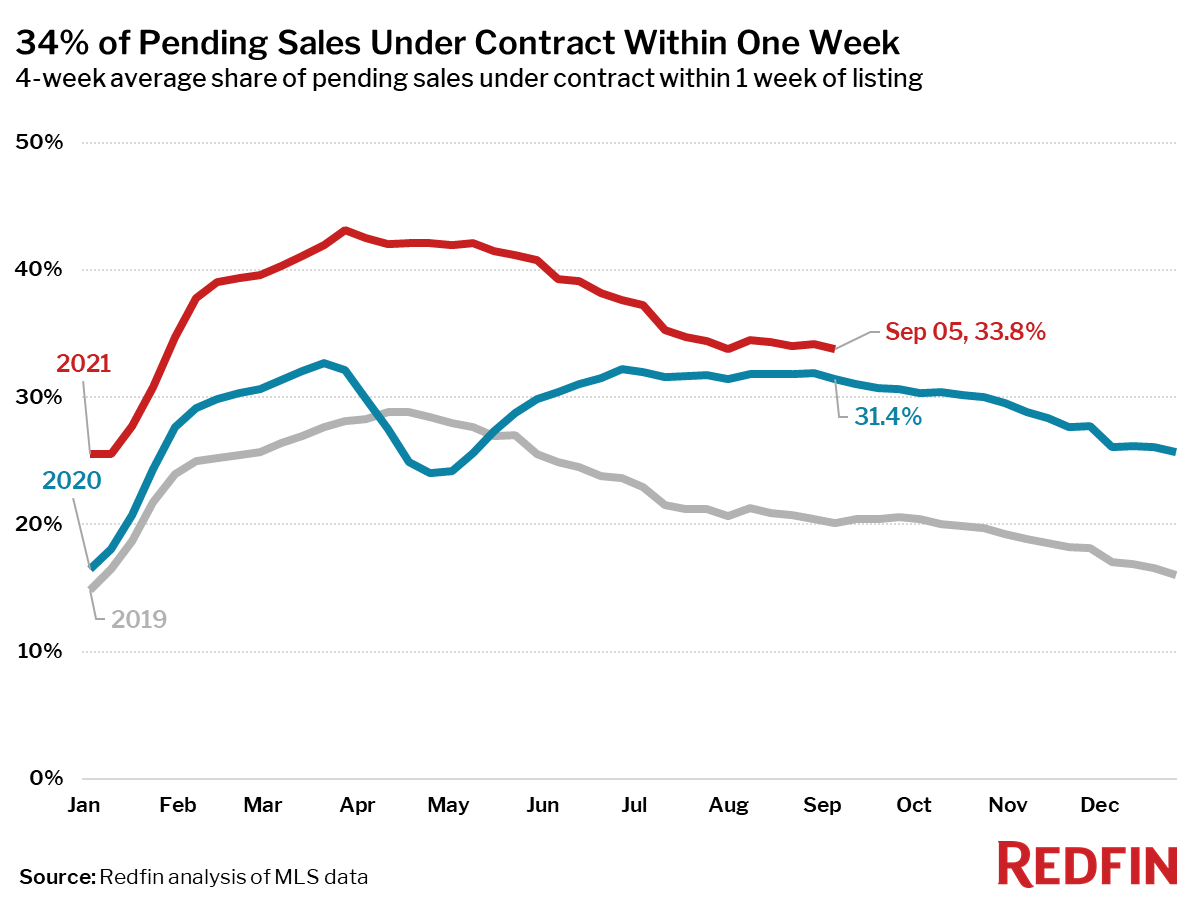
- 34% of homes that went under contract had an accepted offer within one week of hitting the market, up from 31% during the same period a year earlier, but down 9 percentage points from the 2021 peak reached during the four-week period ending March 28.
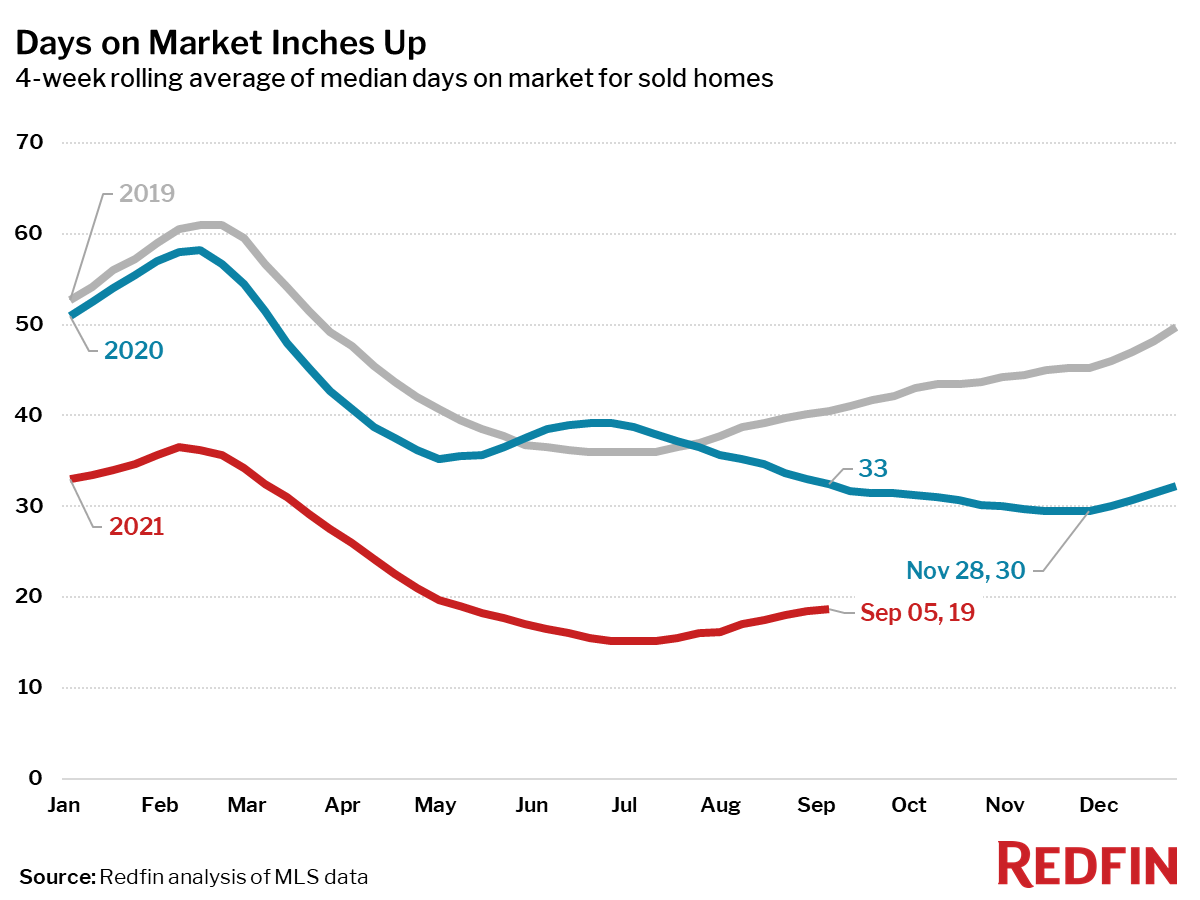
- Homes that sold were on the market for a median of 19 days, up from the all-time low of 15 days seen in late June and July, and down from 33 days a year earlier.
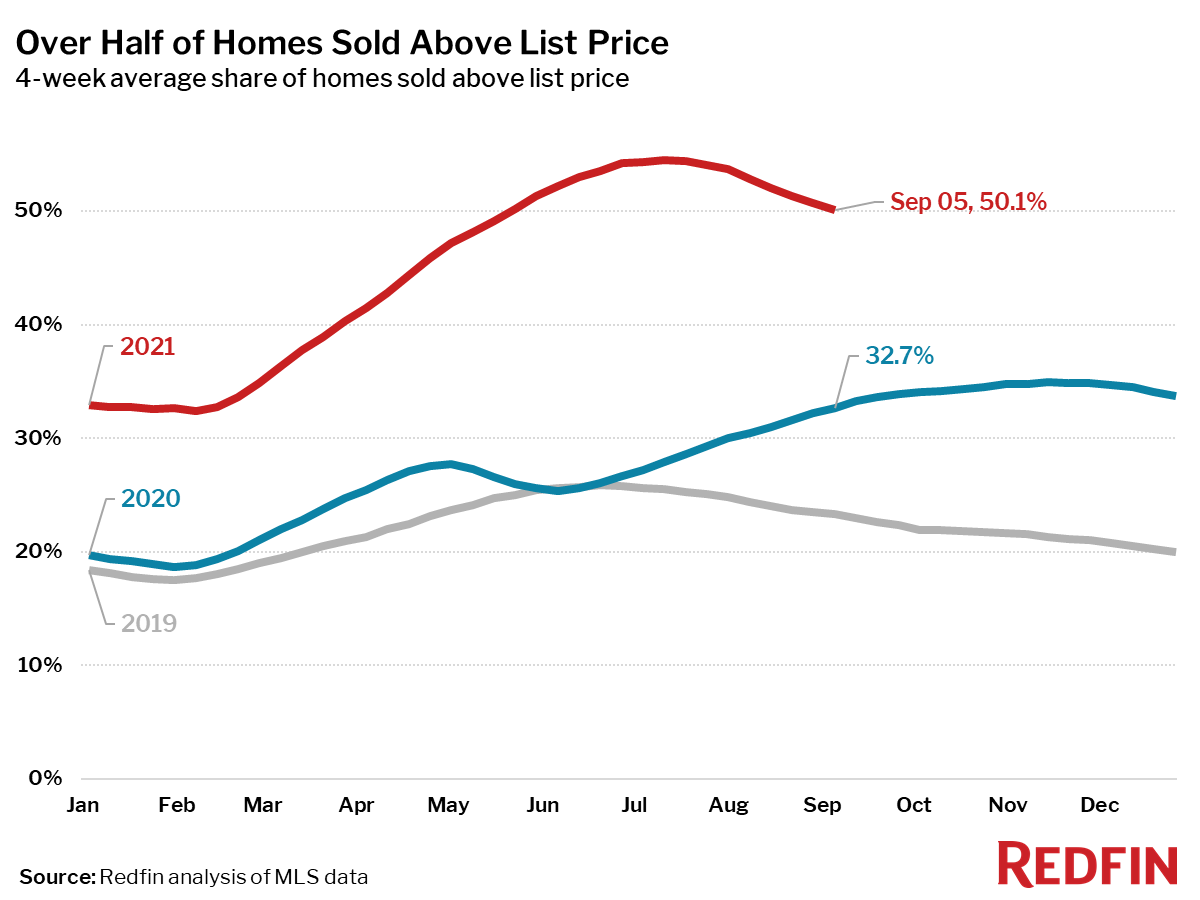
- 50% of homes sold above list price, up from 33% a year earlier. This measure has been falling since the four-week period ending July 11, when it peaked at 55%.
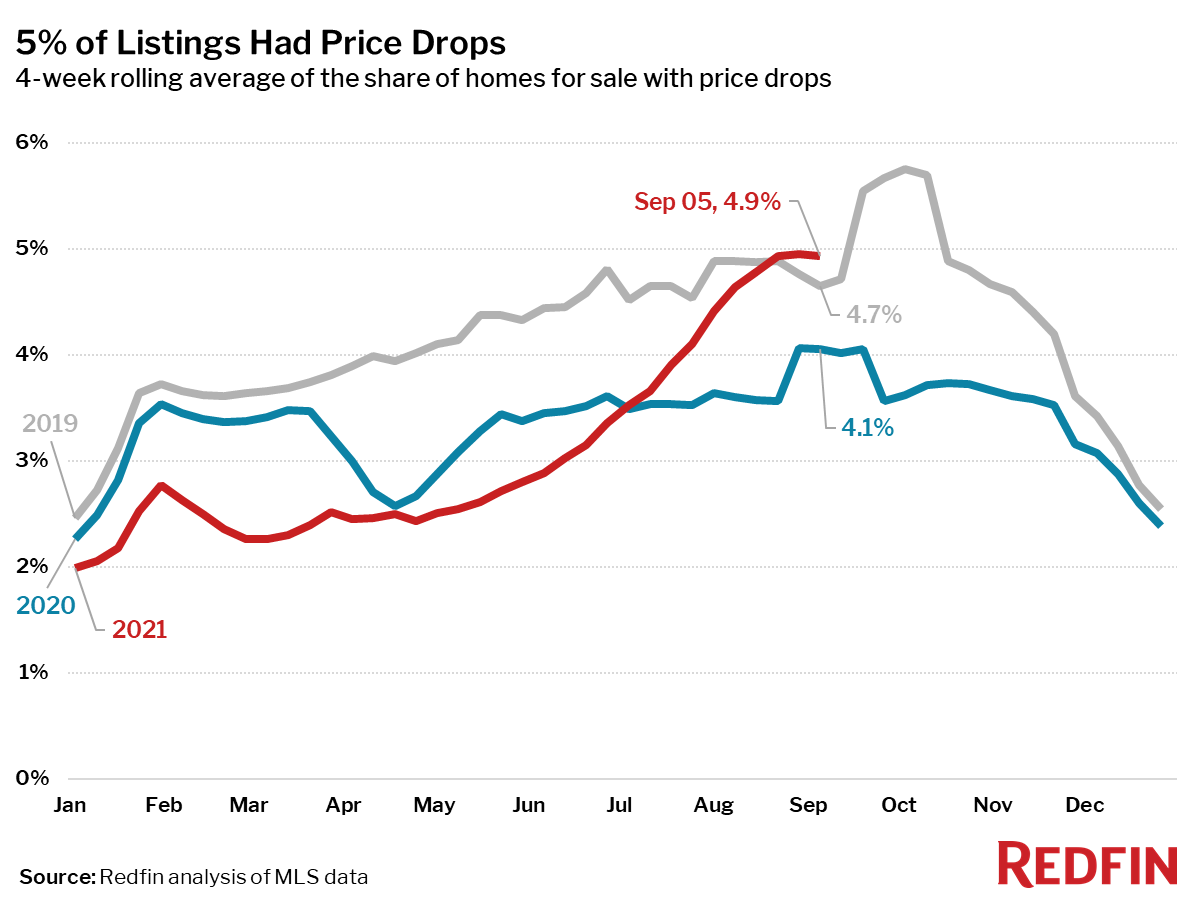
- On average, 4.9% of homes for sale each week had a price drop, up 0.8 percentage points from the same time in 2020, and the highest level since the four-week period ending October 13, 2019.
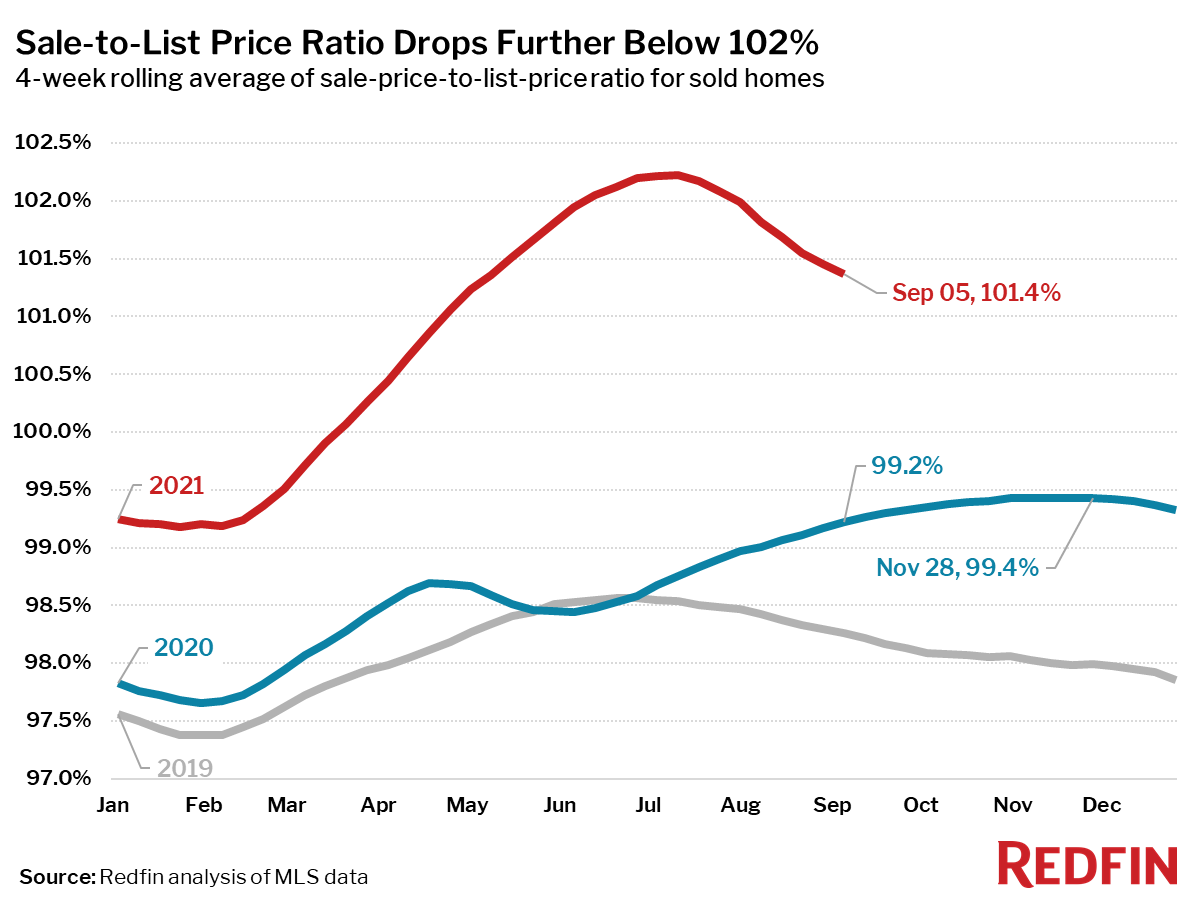
- The average sale-to-list price ratio, which measures how close homes are selling to their asking prices, decreased to 101.4%. In other words, the average home sold for 1.4% above its asking price. This measure was down 0.9 percentage points from its peak hit during the four-week period ending July 11 and up 2.1 percentage points from a year earlier.
Other leading indicators of homebuying activity:
- Mortgage purchase applications decreased 0.2% week over week (seasonally adjusted) during the week ending September 3. For the week ending September 2, 30-year mortgage rates were flat at 2.87%.
- From January 1 to September 5, home tours were up 2%, compared to a 30% increase over the same period last year, according to home tour technology company ShowingTime.
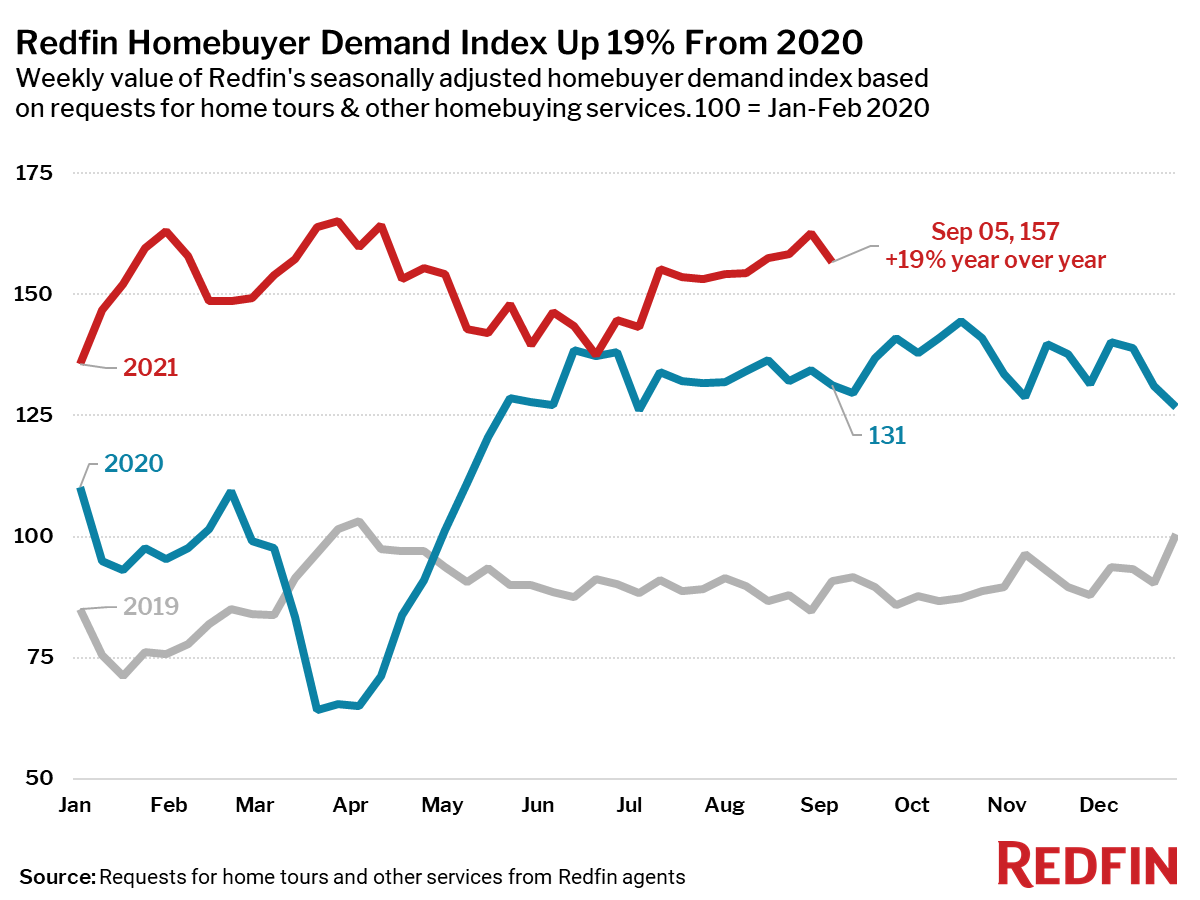
- The Redfin Homebuyer Demand Index was up 19% from a year earlier during the week ending September 5, but dipped slightly from the previous week. The seasonally adjusted Redfin Homebuyer Demand Index is a measure of requests for home tours and other services from Redfin agents.
Refer to our metrics definition page for explanations of all the metrics used in this report.

Share on facebook Share on twitter Share on linkedin Share on pinterest
read more…
redfin.com/news/housing-market