Tag Archives: Armonk Real Estate

Armonk Real Estate

China’s real estate market struggles | Armonk Real Estate

China’s housing market slump has intensified in recent weeks as sales plunge and more developers default on their debt. Now the downturn has reached another milestone: home prices have begun falling for the first time in six years.

The 0.08% drop in new-home prices across 70 cities in September may be small, but it poses a potentially big blow for an economy that counts on property-related industries for almost a quarter of output.

Homebuyer sentiment is evaporating as a crisis at China Evergrande Group ripples through the industry. With prospective buyers already wondering whether cash-strapped builders can deliver their apartments, the risk is that they stay away in droves on fears that real estate is no longer a safe bet.

“Now the priority is to prevent a state of panic,” said Yan Yuejin, research director at Shanghai-based E-house China Research and Development Institute. “The home market has clearly entered a downward cycle.”

Developers are struggling with regulatory tightening that has helped to choke off fresh financing and made it harder to pay bills. Evergrande alone owes more than $300 billion, and has yet to finish homes for 1.6 million buyers who put down deposits.

The drop in confidence has affected people like Carl, a property investment consultant in eastern Hangzhou. He says the number of prospective clients tumbled around 90% last month from the second quarter.

“Business is so light,” Carl said, asking not to give his full name while talking about government policy. One customer “became less and less interested each time we called him, and later on he wouldn’t even pick up our calls.”

The real estate downturn is already hurting China’s economy, which is also being dragged down by power shortages. Economic growth slowed in the third quarter as the property and construction industries contracted for the first time since the start of the pandemic.

Peak Season

September is traditionally a peak season for the home market. Yet residential sales tumbled 17%, investments slid for the first time since early 2020, and the rate of failed land auctions climbed to the highest since at least 2018 — potentially hurting local government coffers.

Smaller cities, where the economy is weaker, were hit the most by last month’s price declines. Existing-home values slid 0.21% in 35 so-called tier-3 cities, the most since early 2015, National Bureau of Statistics figures showed Wednesday.

About three-quarters of cities saw second-hand home values fall from a month earlier. A price war is set to intensify in the coming months as landlords in wait-and-see mode surrender to the cooling trend, Yan said.

The downturn has continued into this month. Existing-home sales plunged 63% from a year earlier in the first 17 days of October, according to a Nomura Holdings Inc. note Monday.

“The effects of developers’ price discounts are waning,” Yang Kewei, a research director at China Real Estate Information Corp., said before the figures were released.

A Bloomberg index of China developer stocks fell 0.5% on Wednesday, taking its decline to 24% this year.

Fears of contagion from the crisis at Evergrande are brewing. Sinic Holdings Group Co. became the latest Chinese real estate firm to default as investors wait to see whether Evergrande will meet overdue interest payments on dollar bonds this week.

Yields on Chinese high-yield dollar bonds, which are dominated by builders, have climbed to their highest in about a decade, hurting a key funding channel for the sector.

That will have a knock-on effect on the broader economy, since Goldman Sachs Group Inc. estimates the property sector and related industries make up about 23% of gross domestic product.

Faster Mortgages

So far, authorities are largely resisting the urge to ease up on the industry. Regulators have told banks to speed up mortgage lending again, Bloomberg reported last week, but the central bank signaled on Friday it would keep monetary policy broadly unchanged in the near term.

Moves in the property and financial markets are a “stress reaction” to some defaults, People’s Bank of China Deputy Governor Pan Gongsheng said Wednesday at a Beijing conference, China Business News reported. Property sector financing and costs have gradually been normalizing, Pan was quoted as saying.

There are “individual problems” in the real estate market, but the risks are controllable overall, Vice Premier Liu He said at the same event, according to the official Xinhua News Agency. Reasonable funding needs in the sector are being met, Liu was quoted as saying.

Some analysts expect the current real estate slump to be less harsh than previous ones because inventories remain relatively small. Developers have been more rational about building projects in coastal cities where demand is higher, said Chen Long, a partner at Beijing-based consultancy Plenum.

“The relatively low stock of unsold housing limits the risk of a major downturn,” Oxford Economics said in a note on Wednesday. “We think the most likely scenario is a contained short-term downturn.”

Still, any recovery will be difficult until home values resume rising.

“If property prices stop growing, we won’t buy,” said Jack, a tech worker in Shenzhen who didn’t want to be identified by his surname for fear of reprisals from his company. “Right now, I’ll sit and watch.”

read more…

bloomberg.com

Builder Confidence Down from Record High | Armonk Real Estate

Ending a string of three successive months of record highs, builder confidence in the market for newly built single-family homes fell four points to 86 in December, according to the latest NAHB/Wells Fargo Housing Market Index (HMI). Despite the decline, December is still the second-highest reading in the history of the series after last month’s 90.

Housing demand is strong entering 2021, however the coming year will see housing affordability challenges as inventory remains low and construction costs are rising.

The issues that have limited housing supply in recent years, including land and material availability and a persistent skilled labor shortage, will continue to place upward pressure on construction costs. As the economy improves with the deployment of a COVID-19 vaccine, interest rates will increase in 2021, further challenging housing affordability in the face of strong demand for single-family homes.

Derived from a monthly survey that NAHB has been conducting for 35 years, the NAHB/Wells Fargo Housing Market Index gauges builder perceptions of current single-family home sales and sales expectations for the next six months as “good,” “fair” or “poor.” The survey also asks builders to rate traffic of prospective buyers as “high to very high,” “average” or “low to very low.” Scores for each component are then used to calculate a seasonally adjusted index where any number over 50 indicates that more builders view conditions as good than poor.

The HMI index gauging current sales conditions dropped four points to 92, the component measuring sales expectations in the next six months fell four points to 85 and the gauge charting traffic of prospective buyers also decreased four points to 73.

Looking at the three-month moving averages for regional HMI scores, the Northeast fell one point to 82, the Midwest was up one point to 81, the South rose one point to 87 and the West increased two points to 96.

The HMI tables can be found at nahb.org/hmi.

read more…

eyeonhousing.org

California sales plummet | Armonk Real Estate

For the data: Full Excel

SFH Sales & Price  |  SFH UII & MTM  |  SFH SqFt & SL Ratio

CDO Sales & Price  |  CDO UII & MTM  | CDO SqFt & SL Ratio


For presentation:   PPT  |   PDF

For more related new releases:  Newstand

December-18Median Sold Price of Existing Single-Family HomesSales
State/Region/CountyDec-18Nov-18 Dec-17 Price MTM% ChgPrice YTY% ChgSales MTM% ChgSales YTY% Chg
CA SFH (SAAR)$557,600$554,760 $549,550r0.5%1.5%-2.4%-11.6%
CA Condo/Townhomes$460,660$465,770 $446,840 -1.1%3.1%-10.0%-21.4%
Los Angeles Metropolitan Area$500,000$512,000 $495,000r-2.3%1.0%-8.3%-17.8%
Central Coast$717,650$672,500 $657,500 6.7%9.1%-15.2%-24.9%
Central Valley$317,500$320,000 $310,000 -0.8%2.4%-8.0%-15.7%
Inland Empire$359,000$363,620 $342,000r-1.3%5.0%-10.1%-19.8%
S.F. Bay Area$850,000$905,000 $882,000r-6.1%-3.6%-20.2%-17.5%
          
S.F. Bay AreaDec-18Nov-18 Dec-17 Price MTM% ChgPrice YTY% ChgSales MTM% ChgSales YTY% Chg
Alameda$850,000$900,000 $862,000 -5.6%-1.4%-24.2%-19.9%
Contra Costa$612,500$641,000 $600,000 -4.4%2.1%-19.1%-16.7%
Marin$1,270,500$1,172,944 $1,268,900 8.3%0.1%-21.3%-12.6%
Napa$725,000$683,500 $688,000 6.1%5.4%-14.1%-21.8%
San Francisco$1,500,000$1,442,500 $1,475,000 4.0%1.7%-24.5%11.3%
San Mateo$1,483,000$1,500,000 $1,500,000 -1.1%-1.1%-24.0%-20.4%
Santa Clara$1,150,000$1,250,000 $1,300,000 -8.0%-11.5%-22.0%-20.6%
Solano$425,000$450,000 $416,000 -5.6%2.2%-13.0%-18.5%
Sonoma$639,000$612,500 $670,000 4.3%-4.6%-10.0%-16.7%
Southern CaliforniaDec-18Nov-18 Dec-17 Price MTM% ChgPrice YTY% ChgSales MTM% ChgSales YTY% Chg
Los Angeles$588,140$553,940 $577,690r6.2%1.8%-3.0%-16.3%
Orange$785,000$795,000 $785,500 -1.3%-0.1%-15.5%-18.3%
Riverside$398,000$400,000 $385,000 -0.5%3.4%-4.9%-17.7%
San Bernardino$295,000$299,450 $278,000 -1.5%6.1%-17.4%-23.1%
San Diego$618,500$626,000 $605,000 -1.2%2.2%-7.4%-14.7%
Ventura$640,000$643,740 $645,000 -0.6%-0.8%-14.0%-13.8%
Central CoastDec-18Nov-18 Dec-17 Price MTM% ChgPrice YTY% ChgSales MTM% ChgSales YTY% Chg
Monterey$590,000$630,000 $614,000 -6.3%-3.9%-26.1%-31.0%
San Luis Obispo$640,000$624,000 $590,000 2.6%8.5%-16.3%-23.7%
Santa Barbara$806,030$550,000 $730,000 46.6%10.4%-1.1%-14.8%
Santa Cruz$926,000$862,500 $831,000 7.4%11.4%-16.2%-31.7%
Central ValleyDec-18Nov-18 Dec-17 Price MTM% ChgPrice YTY% ChgSales MTM% ChgSales YTY% Chg
Fresno$266,500$265,750 $259,750 0.3%2.6%-4.1%-4.7%
Glenn$246,500$225,000 $230,000 9.6%7.2%77.8%113.3%
Kern$242,380$235,250 $233,000 3.0%4.0%-7.1%-7.8%
Kings$243,000$222,000 $225,000 9.5%8.0%-7.1%-17.0%
Madera$263,000$265,000 $239,000r-0.8%10.0%-18.8%-34.6%
Merced$269,060$261,930 $239,900 2.7%12.2%22.0%11.9%
Placer$492,993$461,000 $451,500 6.9%9.2%-10.2%-18.5%
Sacramento$364,500$365,000 $350,000 -0.1%4.1%-14.8%-22.4%
San Benito$577,000$583,200 $537,000 -1.1%7.4%-15.9%-28.8%
San Joaquin$365,000$365,000 $349,720 0.0%4.4%1.1%-14.1%
Stanislaus$309,000$310,000 $300,000 -0.3%3.0%-6.2%-16.0%
Tulare$236,450$237,400 $219,500 -0.4%7.7%-11.5%-20.1%
Other Counties in CaliforniaDec-18Nov-18 Dec-17 Price MTM% ChgPrice YTY% ChgSales MTM% ChgSales YTY% Chg
AmadorNANA $305,000 NANANANA
Butte$356,558$326,940 $304,000 9.1%17.3%97.5%105.3%
Calaveras$310,000$325,000 $285,000 -4.6%8.8%11.7%-26.5%
Del Norte$243,900$250,000 $251,500 -2.4%-3.0%-40.0%-36.8%
El Dorado$454,500$461,750 $450,000 -1.6%1.0%-15.5%-33.6%
Humboldt$308,000$310,000 $319,500 -0.6%-3.6%-15.3%-28.4%
Lake$269,000$255,000 $269,500 5.5%-0.2%17.7%-6.4%
Lassen$208,000$184,000 $175,000 13.0%18.9%53.3%0.0%
Mariposa$320,000$355,000 $310,000 -9.9%3.2%0.0%40.0%
Mendocino$424,900$414,000 $409,500 2.6%3.8%-17.0%-2.2%
Mono$541,000$725,000 $515,000 -25.4%5.0%-55.6%-42.9%
Nevada$389,950$399,000 $393,500 -2.3%-0.9%1.1%-6.0%
Plumas$262,950$289,500 $256,000 -9.2%2.7%0.0%-13.3%
Shasta$267,500$283,000 $258,250 -5.5%3.6%-1.3%6.8%
Siskiyou$182,500$226,000 $192,500 -19.2%-5.2%-13.5%-33.3%
Sutter$320,000$296,000 $270,000 8.1%18.5%26.6%5.2%
Tehama$255,000$199,000 $190,000 28.1%34.2%184.6%100.0%
Tuolumne$258,950$288,500 $269,900 -10.2%-4.1%21.2%27.0%
Yolo$429,000$429,500 $420,000 -0.1%2.1%-1.0%-19.8%
Yuba$298,000$263,000 $241,000 13.3%23.7%2.5%Read17.4%

read more…

https://www.car.org/marketdata/data/countysalesactivity

Construction Job Openings Continue to Rise | Armonk Real Estate

The count of unfilled jobs in the overall construction sector increased in September, as residential construction employment continued to grow.

According to the BLS Job Openings and Labor Turnover Survey (JOLTS) and NAHB analysis, the number of open construction sector jobs (on a seasonally adjusted basis) grew to 221,000 in September, after establishing a cycle high of 225,000 in July. The July estimate represents the highest monthly count of open, unfilled jobs since February 2007.

The open position rate (job openings as a percent of total employment) for September was 3.2%. On a smoothed twelve-month moving average basis, the open position rate for the construction sector increased to 2.6%, setting a cycle high and surpassing the top twelve-month moving average rate set prior to the recession.

The overall trend for open construction jobs has been increasing since the end of the Great Recession. This is consistent with survey data indicating that access to labor remains a top business challenge for builders.

jolts

The construction sector hiring rate, as measured on a twelve-month moving average basis, fell back to 4.6% in September.

Monthly employment data for October 2016 (the employment count data from the BLS establishment survey are published one month ahead of the JOLTS data) indicate that home builder and remodeler net hiring continued to grow, as sector employment increased by 4,500 after posting a 13,200 gain in September. These gains come after a recent period of hiring weakness, which has reduced the 6-month moving average of jobs gains for residential construction to just under 5,000.

Residential construction employment now stands at 2.618 million, broken down as 737,000 builders and 1.881 million residential specialty trade contractors.

res-construction

Over the last 12 months home builders and remodelers have added 140,000 jobs on a net basis. Since the low point of industry employment following the Great Recession, residential construction has gained 632,000 positions.


read more…


http://eyeonhousing.org/2016/11/construction-job-openings-continue-to-rise/

Small wall mounted guest bath sinks | Armonk Real Estate

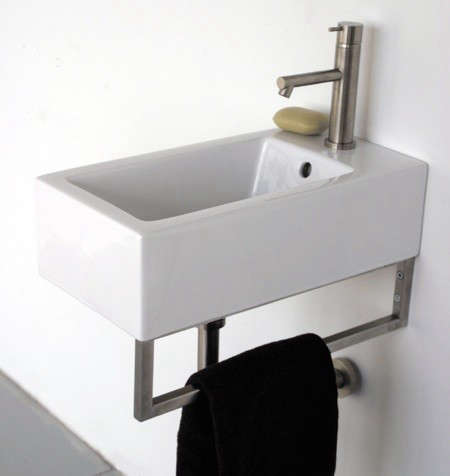
When washroom space is limited, small-profile sinks are essential: Here are ten tiny wall-mounted sinks for the guest bathroom.

Above: Lacava’s 5074 Aquamedia Washbasin in white porcelain measures 10.25 by 19.75 by 7 inches; the wall-mounted version includes a towel bar; $390 at Faucet Farm.

Above: Duravit’s Happy D. Hand Rinse Basin in white porcelain measures about 20 inches wide and 10 inches deep; $180 at Every Faucet.

Above: The wall-mounted Round Ann Sink measures 15.75-inches wide and deep; $79.99 at Ikea.

Above: Kohler’s Taunton Cast-Iron White Wall-Mount Lavatory measures 14 by 16 inches; $337.99 at Plumbers Surplus.

Above: The Scarabeo Thin-Line Ceramic Washbasin measures 11.7 inches square; $350 at eFaucets.

Above: The Whitehaus Wall-Mounted Basin measures approximately 20 by 10 by 5 inches and is available with a chrome towel bar; $258.75 at eFaucets.

Above: Lacava’s Alia Wall Mounted Porcelain Lavatory SInk is 22 inches wide and 11 inches deep; $375 at Lacava.

Above: A space-saving corner sink, the white porcelain Scarabeo Square Wall-Mounted Corner Sinkby Nameeks measures 18.5 inches wide and deep; $486.50 at Every Faucet.

Above: The Duravit Architec Series Hand-Rinse Basin measures a tiny 14 inches; $241.50 through Amazon.

Above: Duravit’s Vero Basins are a modern European classic and are available in several sizes and configurations, including the approximately 10-by-18 inch Vero Handrinse Basin; $296.25 at eFaucets.


read more…


http://www.remodelista.com/posts/10-easy-pieces-wall-mounted-guest-bath-sinks/

New-home sales roar to an 8-year high | Armonk Real Estate

U.S. new-home sales surged to the highest in nearly eight years in July as builders picked up the pace while buyer demand remained robust.

Sales of newly constructed homes rose 12.4% to a seasonally adjusted annual rate of 654,000, the Commerce Department said Tuesday. That was 31.3% higher than a year ago, and easily beat forecasts of a 581,000 pace from economists surveyed by MarketWatch.

June’s figure was revised downward slightly, to 582,000.

The median sales price in July was $294,600, 0.5% lower than year-ago levels. As sales soared, supply dwindled to 4.3 months’ worth of homes at the current pace.

On Tuesday, luxury home builder Toll Brothers TOL, +3.27%  reported double-digit profit and revenue growth for its second quarter. “The solid economy and employment picture are also benefiting our target customers,” executive chairman Robert Toll told analysts.

Analysts and economists have waited to see stronger activity from home builders as the economic recovery drags on and the job market strengthens. Builders have been wary of ramping up construction to pre-crisis levels, but with demand running so much hotter than inventory, and new construction favoring higher-end customers, the housing market has struggled to find equilibrium.


read more…


http://www.marketwatch.com/story/new-home-sales-roar-to-an-8-year-high-of-654000-in-july-2016-08-23?mod=MW_story_latest_news

Aging in Place Is Fastest-Growing Segment in Residential Remodeling | Armonk Real Estate

The Richmond Times Dispatch’s Carol Hazard writes on the growing trend among baby boomers: aging in place. According to the National Association of Home Builders, home modifications are the fastest-growing segment in residential remodeling.

To look at how one woman is changing her home, Hazard interviewed Donna Edgerton, who had an elevator shaft installed, which she will eventually turn it into an actual elevator. Furthermore, she added an open-plan kitchen and family room. She also widened the doors throughout the home to at least 3 feet to accommodate a wheelchair and a walker, along with choosing drawers over cabinets in her kitchen to better mange things around her home. Edgerton’s home renovation now includes doors and faucet features with lever handles rather than knobs, along with a bathroom that has a built-in bench, sinks that allow for a wheelchair, and tilted mirrors.

Aging in place has allowed baby boomers to not move, continue to enjoy their neighborhoods and communities, and enjoy the new amenities of their homes.

As the Richmond Times-Dispatch reports:

In the Richmond area, the number of people ages 65 and older will outnumber the school-age population for the first time in history over the next 15 years, according to a 2015 report by the Greater Richmond Age Wave, a collaboration of public and private organizations working to prepare for the region’s growing aging population.

By 2040, the number of people 85 and older (40,541) in the area will have more than quadrupled since 2000, according to the report.

“One of the biggest challenges over the next decade is how we will accommodate the growing senior population and make sure the houses they live in and the housing choices they make will be suitable for their changing needs,” said Bob Adams, executive director of Virginia Accessible Housing Solutions, whose EasyLiving Home program is designed to encourage builders to include accessibility features in home design and construction.

The problem is particularly acute in rural areas, as young people leave for urban areas and the number of senior households increases, Adams said.

“The number of seniors who live alone is growing dramatically in these areas,” he said, “and they are more susceptible to being isolated.”


read more…


http://www.remodeling.hw.net/newsletter/

So California home prices jump | Armonk Real Estate

The Southern California housing market is red-hot again.

Home prices in the region have been climbing steadily, as they have nationwide, toward record levels not seen since the 2008 housing crisis plunged the country into a severe recession.

The S&P/Case-Shiller home price index, a widely followed gauge of the market, showed that prices in the Los Angeles market in April stood at their highest point since October 2007.

The median home price in Orange County in May was $651,500, surpassing its bubble-era peak reached in 2007, according to the real estate data firm CoreLogic.

Interest rates of about 3.5% or less for 30-year, fixed-rate mortgages  not far off the all-time low of 3.31% in November 2012  have helped fuel the gains.

Dana Kuhn is a lecturer at the Corky McMillin Center for Real Estate at San Diego State University, and we asked him to summarize the market and what it means for would-be buyers and sellers. Here’s an edited excerpt:

Has the Southern California housing market completely recovered from the recession?

In the most desirable markets, that’s essentially true. That would be West Coast large-metro areas. The San Francisco Bay Area is now priced above its peak numbers of the last decade. Orange County, too, and Los Angeles and San Diego are getting very close to their former peaks. Seattle is doing really well. Portland is doing well.

One of the worst-hit areas in the housing crisis was the Inland Empire. How is that region faring?

That was the real subprime [mortgage] disaster area. Those markets have been slower to recover. There are areas like the Inland Empire that are probably only between 80% and 85% of [their pre-bubble] peak.

Is it surprising that it’s taken this long?

Yes and no. Given how severe the recession was, there was so little production [of new housing] in that time. There was a four-year period between September 2008 and September 2012 when the nation’s housing starts were below all previous troughs going back some 40 years. And in those previous troughs, what you typically had was one year at that nadir, and then you’d climb back up fairly quickly. But we had four years below all of those troughs, and so production obviously fell behind demand.

So there was a huge pent-up demand when people started getting jobs and believing in housing again. The industry has struggled to keep up with it in the more desirable markets.

Is that driving the surge in prices?

Yes. Like most things, it’s a supply/demand situation. The number of [housing] starts hasn’t been able to take care of that pent-up demand. The pricing has gone up accordingly, and that has been accommodated by low [mortgage] interest rates. Continued low interest rates have in essence subsidized a rapid ascent in pricing.

Why is it tough to add more housing to the supply in Southern California?

Land is increasingly scarce, and that’s forcing people to build up rather than out. And those higher-density projects are more sensitive politically, more difficult to get approved and take longer to get through the pipeline. You can have agreement about needing more housing in a given market, but when it actually comes down to [building] those 300 units on that corner in that neighborhood, you get resistance. So it can take years in Southern California coastal areas to get [those] projects approved. That’s true whether it’s a for-sale product or a rental market.

This all sounds good for sellers, but is it a tough time to be a buyer?

Yes. Unfortunately real [inflation-adjusted] wage growth hasn’t kept up with that surge in pricing. It’s significantly harder to buy something now than it was a few years ago because people’s wages just haven’t kept up, even though interest rates are still the same.

The median price of a house in Los Angeles County is above a half-million dollars. How does a first-time buyer afford that?

They don’t buy that house. That’s the middle of a statistical group. Your first-time buyer is pretty much forced to buy a [less-expensive] attached product, not detached.

Like a condominium?

Yes. And they’re probably not going to be able to afford to buy that unit in the same neighborhood in which they would rent if they were renters. So they have to make a lifestyle concession in order to become homeowners.

Meaning they would build up equity in that house, then later sell it in hopes of buying one in the neighborhood they desire?

Right. Also, the millennial generation [18 to 34 years old] has eschewed the concept of home ownership because they saw their parents and others get burned in the last downturn and because they prefer lifestyle over ownership.

But as they get older and have kids they’ll have a different outlook. And as their wages increase, they’re also going to realize the importance of the mortgage deduction  the tax benefits that come from home ownership  and there will be move back toward home ownership.


read more…


http://www.latimes.com/business/la-fi-qa-home-prices-20160713-snap-story.html?yptr=yahoo

Remodeling: 2016 Cost vs Value Report | Armonk Real Estate

This site compares average cost for 30 popular remodeling projects with the value those projects retain at resale in 100 U.S. markets. Check out this year’s trends and how they compare to prior years.
Midrange
2016 National Averages
PROJECT
JOB COST
RESALE VALUE
COST RECOUPED
CHANGE VS 2015
Attic Insulation (fiberglass)$1,268$1,482116.9%
Backup Power Generator$12,712$7,55659.4%
Basement Remodel$68,490$48,19470.4%
Bathroom Addition$42,233$23,72756.2%
Bathroom Remodel$17,908$11,76965.7%
Deck Addition (composite)$16,798$10,81964.4%
Deck Addition (wood)$10,471$7,85075.0%
Entry Door Replacement (fiberglass)$3,126$2,57482.3%
Entry Door Replacement (steel)$1,335$1,21791.1%
Family Room Addition$86,615$58,80767.9%
Garage Door Replacement$1,652$1,51291.5%
Major Kitchen Remodel$59,999$38,93864.9%
Manufactured Stone Veneer$7,519$6,98892.9%
Master Suite Addition$115,810$74,22464.1%
Minor Kitchen Remodel$20,122$16,71683.1%
Roofing Replacement$20,142$14,44671.7%
Siding Replacement$14,100$10,85777.0%
Two-Story Addition$171,056$118,55569.3%
Upscale
2016 National Averages
PROJECT
JOB COST
RESALE VALUE
COST RECOUPED
CHANGE VS 2015
Bathroom Addition$79,380$45,00656.7%
Bathroom Remodel$57,411$32,99857.5%
Deck Addition (composite)$37,943$21,87757.7%
Garage Door Replacement$3,140$2,83090.1%
Grand Entrance (fiberglass)$7,971$5,54569.6%
Major Kitchen Remodel$119,909$73,70761.5%
Master Suite Addition$245,474$140,44857.2%
Window Replacement (vinyl)$14,725$10,79473.3%
Window Replacement (wood)$18,087$13,05072.1%
read more…
http://www.remodeling.hw.net/cost-vs-value/2016/

Home Prices in March – Bubbles Anyone? | Armonk Real Estate

The Case-Shiller (CS) National Home Price Index, reported by S&P Dow Jones Indices, rose at a seasonally adjusted annual growth rate of 1.1% in March, down from 3.8% in February. The Home Price Index from the Federal Housing Finance Agency (FHFA) rose at a seasonally adjusted annual rate of 8.4% in March, faster than 6.2% in February.

After the boom and bust, home prices have been recovering from the trough since 2012. As of March 2016, the CS national house price index was at 97% of the February 2007 peak. Nine years after their collapse, house prices are re-approaching their housing bubble peak, but now this level is in line with longer term trend growth.

Figure1_Mar16

However, housing markets are local and the pace of price appreciation varied greatly in different markets during the boom, so proximity to earlier peaks may not mean the same thing in different markets.

House prices in Denver and Dallas now exceed their mid-2000s levels but these markets were among the most stable during the boom with the smallest increases and the shallowest declines, so new peaks shouldn’t be seen as warning signs of new bubble conditions.

In contrast several markets have current house prices that are at or near their previous peaks, but these peaks were significantly inflated during the boom, suggesting these markets may have supply and demand imbalances that are re-inflating price bubbles. These markets include San Francisco, Portland OR, and Seattle.

At the same time several markets are at or near peak levels, but the earlier peaks and declines were relatively restrained. This current proximity to earlier peaks suggests price increases reflect house price recovery, not bubbles. These markets include Boston, Charlotte NC, Atlanta, Cleveland, Detroit, Minneapolis, New York and Chicago.

San Diego and Los Angeles are markets that are not as close to their earlier peaks as some markets, but those peaks reflected some of the most inflated house prices. Even a sizable gap between current and peak prices may reflect some ongoing supply and demand imbalance. The Washington DC and Miami markets share a similar distinction.


read more…


http://eyeonhousing.org/2016/05/home-prices-in-march-bubbles-anyone/