Tag Archives: Armonk Luxury Real Estate

Armonk Luxury Real Estate

Seattle hits 20 months as the nation’s hottest housing market | Armonk Real Estate

Seattle retained its long-running title of the hottest housing market in the country, according to the Case-Shiller national home price report, but there are signs of hope for would-be buyers frustrated by the slim supply in recent years.

Seattle home prices in April rose 13.1 percent over the same period a year ago. Las Vegas and San Francisco held on to their spots just behind Seattle with annual price growth of 12.7 percent and 10.9 percent respectively.

Seattle has been atop Case Shiller’s index for 20 straight months now, and a combination of a historic population boom and record-low supply of homes for sale has been the primary driver of the city’s skyrocketing prices.

Seattle’s streak is among the longest on record for Case-Shiller’s index. San Francisco had a 20-month run as the fastest growing market between 1999 and 2001, at the heart of the dotcom boom. Portland topped Case-Shiller’s index for 23 straight months from 1990 to 1992.

But another report released earlier this month indicates that supply-starved Seattle is starting to see a rise in the number of home for sale. According to the Northwest Multiple Listing Service, brokers added 14,524 new listings in Seattle and the surrounding area in May, the first time that figure topped 14,000 since May 2008. It’s also the first time in close to four years that the market has shown an annual increase in the number of new listings.

Seattle’s median home sale price in May was $830,000, up more than $100,000 from a year ago.

Also on the rise are condo listings, an important trend because condos tend to be less expensive and represent an opportunity for first-time buyers. Condo inventory grew by 21.4 percent over last year, boosted by the addition of 1,803 new listings in May.

While increased supply isn’t a cure-all for bringing prices down, it can slow growth. Take Seattle’s apartment market where thousands of new units opened in recent years, and many are now sitting empty. This has caused landlords to offer incentives to renters like free rent and other perks.


read more…

https://www.geekwire.com/2018/seattle-hits-20-months-nations-hottest-housing-market-relief-buyers-may-horizon/

Construction spending up 5.1% | Armonk Real Estate

The numbers: Construction expenditures were 1.7% lower in March compared with February, the Commerce Department said Tuesday. But a hefty increase to earlier spending estimates in prior months signals that outlays remain on a strong footing.

What happened: Spending ticked down to a seasonally adjusted annual $1.285 trillion rate in March from a $1.306 trillion pace in February. March expenditures were 3.6% higher than a year ago.

The Econoday forecast was for a 0.5% increase in March.

The big picture: In March, outlays for public sector construction projects were little changed, but private-sector spending fell 2.1%.

Residential construction spending was 3.5% lower for the month, but 5.3% higher, compared with a year ago.

With expenditures now seen as stronger in January and February than the government originally estimated, total construction spending for the year to date is 5.5% higher than the same period in 2017.

What they’re saying: “Construction spending was quite soft in March, falling by 1.7%, likely reflecting at least in part the difficult weather during the month,” said Stephen Stanley, Amherst Pierpont Securities chief economist. “I continue to look for a sizable bounce back in construction activity in the spring, as weather delays dissipate.”


read more…


https://www.marketwatch.com/story/construction-spending-stumbles-in-march-but-is-stronger-for-the-year-to-date-2018-05-01

Real estate construction forecasts 2018 | Armonk Real Estate

Each year, leading economists look into their “crystal balls” in an attempt to foresee what the New Year holds for the construction industry. For 2018, this proved a tougher task given key uncertainties clouding the outlook at year end, including the incomplete 2018 federal spending package and as yet enacted tax reform legislation (just passed at time of publication). Add in storm and wildfire recovery boosting construction demand, costs and labor woes (further compounded by immigration reform), then throw in the pending mid-term elections, and the future is cloudier still.

That said, economists gave their best shot, and here is a Q&A covering their outlook for the overall U.S. economy and general construction as we neared the close of 2017. Next month, industry experts will take a targeted look at the prospects for the transportation sector.

Overall Economic Outlook

What level of U.S. economic growth do you see for 2018? What are some key drivers that will impact growth either positively or negatively?

Robert Dietz, senior vice president and chief economist, National Association of Home Builders (NAHB): NAHB sees continued modest yet positive growth prospects for 2018. We should continue to grow, but at below 3% rates. Wage growth is increasing, which is good for consumer spending and housing demand, but is a concern for employers. The wild card for 2018 and 2019 is tax reform. Smart tax reform that rewards small business and promotes housing will contribute to growth. Tax reform that increases taxes on homeowners to reward investors, including foreign owners of U.S. assets, will be counterproductive.

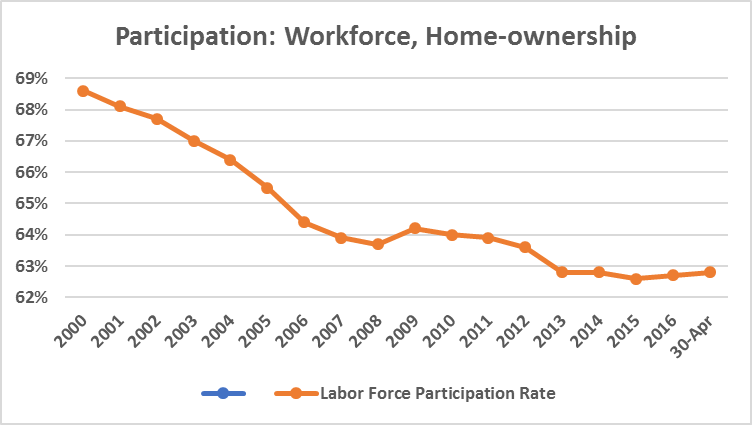
The tight labor market is a key limiting factor for overall economic growth. Increases for the labor force participation rate will help labor markets to continue to grow. However, absent those improvements, wage pressure could increase inflation and cause the Fed to move somewhat faster than its current gradual pace of interest rate hikes.

Ed Sullivan, chief economist, Portland Cement Association (PCA): We project GDP growth to be at 2.3% in 2018. We came off the worst recession since the Great Depression and there has been a tremendous pent-up demand. It takes time to fill this demand, and our growth has been slow.

It will likely continue to be slow driven in part by millennials who are in debt, who are taking their time to start families and who currently don’t participate in the housing market. The recession also changed peoples’ behaviors. But people forget and eventually they will return to old spending habits, just as millennials will one day start families and buy homes.

Ken Simonson, chief economist, Associated General Contractors of America (AGC): The economy should keep expanding at a moderate 2% to 2.5% rate, after inflation. However, this could be affected by big changes in tax and spending policy or by an international crisis.

Anirban Basu, chief economist, Associated Builders & Contractors (ABC): As we enter 2018, consumer confidence is at a roughly 17-year high, unemployment is at a 17-year low, financial markets are surging, the global economy is improving and leading indicators suggest plentiful momentum during the year’s early months. It has been many years since the U.S. economy entered the New Year with such momentum.

Consumer spending will continue to be the leading engine of growth. But that will be supported by faster export growth as the world economy continues to heal, and by faster business spending growth, particularly if pending corporate tax cut legislation is passed. In short, the economic outlook for the U.S. in 2018 is quite good.

There are abundant risks, however. One could argue that asset prices rose too fast and furiously in 2017. That could set the stage for significant asset price volatility in 2018. Stock and other prices can’t rise forever. This is particularly true given rising inflationary pressures, whether in the form of wages, tuition, rent, medical care or fuel. Should interest rates rise with unanticipated rapidity due to these emerging pressures, elevated asset prices could become jeopardized, setting the stage for negative wealth effects. This means that while 2018 should be strong for the U.S. economy, there are few guarantees with respect to 2019 or 2020.

Building Construction

How strong was construction in the commercial and housing markets in 2017, and what level of growth do you expect to see in both segments for 2018?

AGC: Single-family construction spending increased 9% through the first 10 months of 2017, about the same growth rate as in 2016. But multifamily construction really hit the brakes, slipping to a 4% growth. I think that in 2018, there will be a lot of rebuilding and renovations in areas of Texas, Florida and California devastated by hurricanes, flooding and wildfires. Meanwhile, multifamily building may dip after six years of generally torrid growth.

ABC: There was a considerable volume of building construction in 2017. Leading segments included hotel, casino, office, distribution center and multifamily construction. There are many forces at work, including Millennial demographics, the e-commerce revolution, foreign investment into commercial real estate and growth both in consumer and business travel. One suspects that this momentum will stretch into 2018 since both domestic and foreign capital is on the hunt for investment opportunities that yield income.

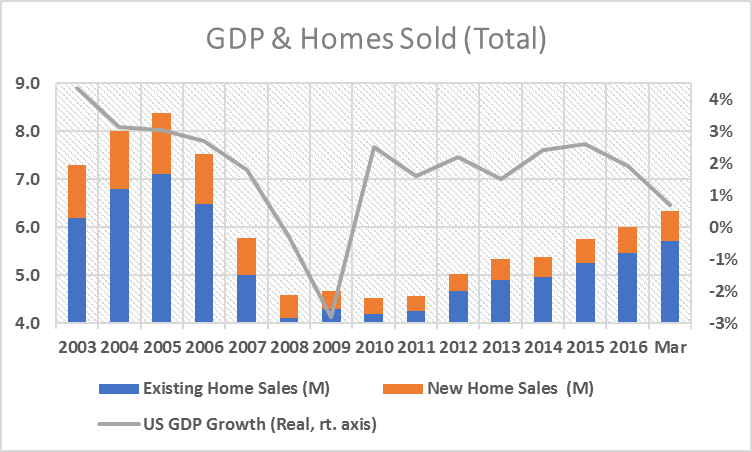
NAHB: On the demand side of the housing market, incoming household formation data show strength for the for-sale market and some softening for rental markets. These trends are consistent with demographic data that show a growing number of millennials entering their 30s. This process will continue to sustain demand for single-family homes in the years ahead.

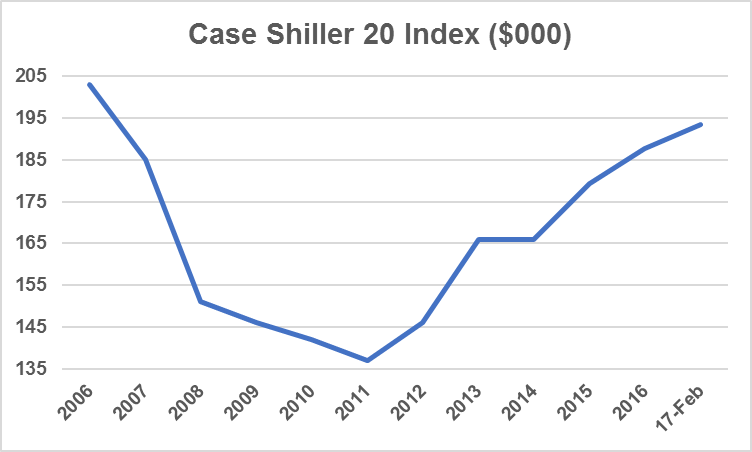
Single-family construction should continue along its modest growth trend (7%), while still being constrained by supply-side bottlenecks, including lack of labor and rising building material prices. Nonetheless, builder confidence, as measured by the NAHB/Wells Fargo Housing Market Index, remains solid. Remodeling should also post gains given rising homeowner wealth and reduced homeowner mobility, which will increase the need for aging-in-place and other kinds of structural improvements.

Multifamily starts peaked in 2015, and NAHB expects a leveling off process to continue over the next few years. The decline in apartment starts in 2017 was steeper than expected, with a 10% 2017 decline expected. We forecast smaller but still negative growth rates over the near-term as rental vacancy rates increase, rent growth softens and housing demand momentum moves to the for-sale market segment.

PCA: We anticipate modest growth throughout the building construction market in both the nonresidential and residential sectors. That should translate into a growth rate similar to 2017.

Nonresidential is approaching a peak and there is slowing in sectors like industrial that are impacted by the macroeconomic environment. The single-family residential market should be fairly healthy in 2018. Gains, however, will be slowed by difficult application processes, lack of Millennial participation and modest increases in mortgage rates that will impact affordability. The multifamily market still has strong potential, but it too is reaching its cyclical peak. Like 2017, next year will likely see 350,000 units built.

The big surprise is the improvement and repair sector thanks unfortunately to two serious hurricanes and California wildfires. This sector saw strong percentage gains toward the end of 2017 and will continue to see these gains throughout 2018.

Raw Material Costs

Do you expect to see the costs of raw materials such as asphalt, cement, steel and lumber increase in 2018? If so, to what level and what is driving the increases?

NAHB: We expect continued gains in building material prices, particularly for lumber given tariffs on Canadian softwood lumber. Rising building material prices was the issue that increased the most as a concern in 2017. While still below the lack of labor and lots, prices for drywall, roofing materials and other building components increased in 2017 due to hurricane repair efforts and the broader growth of the housing market. We expect this pressure on prices to continue in 2018.

ABC: The past year was associated with noteworthy increases in construction materials prices. After slumping for much of 2014 and virtually all of 2015, global commodity prices stabilized and then began to rise in 2016/17.

A more contentious view on trade, including with respect to Canadian soft lumber, also served to elevate price pressures. During a recent 12-month period, softwood lumber prices surged 15%. Diesel fuel, natural gas, iron and steel and other prices also expanded for much of 2017.

Given the expectation that the global economy will heat up even further in 2018, one would expect that materials prices will continue to rise. However, the rise in materials prices could be quite gradual. Quantity supplied is already responding to higher prices in many categories, which should translate into more gradual price increases in general.

AGC: Materials costs ended a years-long slide in late 2016 and rose at a moderate rate in most of 2017. Those increases are likely to accelerate a bit further in 2018 as global demand picks up and construction continues to grow, albeit slowly and unevenly. I don’t foresee a return to the severe, widespread escalations and occasional shortages that cropped up before the last recession.

Employment and Labor Costs

In recent years, finding skilled and experienced workers has challenged many construction companies. In fact, for many, it has been their No. 1 impediment to growth. Do you foresee companies continuing to struggle with this trend in 2018? What impact, if any, will the administration’s stand on immigration have on the industry and finding workers?

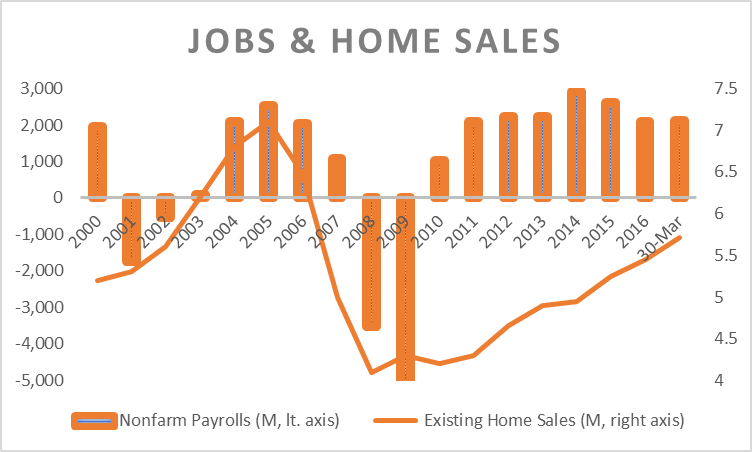
AGC: Finding capable workers will remain the leading challenge for contractors in 2018. The job market is continuing to tighten after more than seven years of continuous job gains and ever-increasing retirements of baby boomers. Restrictive immigration policies and stepped-up deportations are adding to the competition for workers and threaten to slow the growth in the overall economy as many industries struggle to fill openings or to replace the customers who are kept out of the country.

NAHB: On the supply side of the construction market, we need additional gains in the labor force participation rate to allow employers to continue filling open jobs. The construction industry is in the middle of a labor shortage and data suggest it will not turn the corner quickly. Without growth in the size of the labor force, it will be difficult for the residential construction industry to continue adding workers at the current pace of a little more than 100,000 per year. Higher wages due to a tight labor market will bring in some additional workers, but will also increase cost pressures on employers.

We could, of course, build and remodel more homes if we could add workers even faster. The demand is there. The industry must recruit the next generation of construction workers.

PCA: There is no easy fix to the labor challenge. Training programs for skilled workers are great, but they take time and we see companies struggling with labor for several years to come. The labor shortage will continue to be an impediment to company growth and immigration reform will only worsen the trend. Labor-saving technologies will alleviate some of this, but they can only go so far.

ABC: The lack of skilled workers is apparent throughout the U.S. economy, whether in construction, trucking, healthcare, hospitality, cybersecurity or a host of other industry segments…

The year 2018 will be yet another during which America’s low labor force participation rates will continue to hamstring businesses in many segments, including construction. A confluence of factors has led to these circumstances, including cultural shifts, shifts in educational philosophy, the atrophying of apprenticeship programs in much of the nation, and the ongoing large-scale retirement of many of the most talented, skilled and experienced construction workers. The nation’s shifting stand on immigration will not help, with employers finding it increasingly challenging to secure both skilled and semi-skilled personnel.

With respect to construction, the impact is to raise the cost of delivering construction services and to stretch out timetables. That makes it less likely that construction projects can move forward because this serves to reduce the predicted rate of return.


read more…


https://www.forconstructionpros.com/business/article/20985203/special-report-state-of-the-construction-industry-2018

Mortgage rates average 3.82% | Armonk Real Estate

Freddie Mac (OTCQBFMCC) today released the results of its Primary Mortgage Market Survey® (PMMS®), showing average mortgage rates continuing to move lower.

News Facts

  • 30-year fixed-rate mortgage (FRM) averaged 3.82 percent with an average 0.5 point for the week ending August 31, 2017, down from last week when it averaged 3.86 percent. A year ago at this time, the 30-year FRM averaged 3.46 percent.
  • 15-year FRM this week averaged 3.12 percent with an average 0.5 point, down from last week when it averaged 3.16 percent. A year ago at this time, the 15-year FRM averaged 2.77 percent.
  • 5-year Treasury-indexed hybrid adjustable-rate mortgage (ARM) averaged 3.14 percent this week with an average 0.5 point, down from last week when it averaged 3.17 percent. A year ago at this time, the 5-year ARM averaged 2.83 percent.

Average commitment rates should be reported along with average fees and points to reflect the total upfront cost of obtaining the mortgage. Visit the following link for the Definitions. Borrowers may still pay closing costs which are not included in the survey.

Quote
Attributed to Sean Becketti, chief economist, Freddie Mac.
“The 10-year Treasury yield fell to a new 2017-low on Tuesday. In response, the 30-year mortgage rate dropped 4 basis points to 3.82 percent, reaching a new year-to-date low for the second consecutive week. However, recent releases of positive economic data could halt the downward trend of mortgage rates.”


William Raveis must pay Elliman $5M damages in agent-poaching case | Armonk Real Estate

“They’ll eventually be out of Westchester County,” Bill Raveis declared back in 2015, referring to rival firm Douglas Elliman’s move into William Raveis Real Estate’s stronghold.

Not quite two years later, the opposite is turning out to be true.

On Tuesday, a jury upheld Elliman’s claim that Raveis and a former Elliman manager conspired to poach top agents from its office in Armonk, N.Y. The jury awarded Elliman $5 million in damages.

The rival firms have sparred viciously both in New York City and its wealthy suburbs to the north since 2014, when Elliman opened an office in Greenwich, Conn., in the heart of Raveis country.

That year, the suburban powerhouse, which is based in Connecticut, broke into Manhattan with an office headed by Paul Purcell, a former Elliman president, and Kathy Braddock.

The firms’ battle came to a head in mid-2015 when Raveis accused Elliman of blocking all emails that came from the firm — a move Bill Raveis likened to a “baby tantrum.” Elliman, meanwhile, said Raveis was sending mass emails to brokers in New York City in an attempt to lure them away.

Elliman sued Raveis and former manager Lisa Theiss in 2015 for allegedly conspiring to “decimate” its brach by secretly recruiting the firm’s top agents, according to court papers. The suit alleges that Theiss poached 10 agents, including four “top producers,” from her former firm and lured them to Raveis’ newly opened office across the street.

In a statement Tuesday, Elliman Chair Howard Lorber said he was pleased that the jury saw fit to rectify Raveis’ “egregious and outrageous actions.”

In an email, Bill Raveis said he disagreed “with all aspects of the jury’s decision,” and added that his firm would “vigorously be pursuing [an] appeal.”

Both Raveis and Elliman have been going after the Westchester market, which is still dominated by Houlihan Lawrence and Julia B. Fee Sotheby’s International Realty. Raveis logged $439 million in Westchester sales in 2016 while Elliman followed with $378 million, according to a recent analysis by The Real Deal. 


read more…


https://therealdeal.com/2017/06/20/william-raveis-must-pay-elliman-5m-damages-in-agent-poaching-case/

China’s Real Estate Mirage | Armonk Real Estate

BEIJING — When the Chinese government privatized housing in the 1990s, enriching a vast swath of the urban population, it was hailed as a remarkable achievement of the reform economy. Since then, the housing industry has ballooned into a juggernaut that accounts for 70 percent of the country’s household wealth.

More than just a place to live, private housing in the past two decades came to underpin the aspirations of urban Chinese. Homeownership, especially in cities, proved to be a reliable investment outlet. The skyrocketing values of housing have been providing money for sickness and old age in a country where the state has largely dismantled the welfare system. Real estate profits have allowed parents to finance their children’s education abroad.

But the impressive size and wealth of the propertied class belies the growing strains plaguing new home buyers. The country now has some of the least affordable housing markets in the world. The ratio of median home price to median income, a common measure of affordability, in most first-tier cities has soared to higher than that of London.

To cool the markets, local governments have issued myriad purchasing restrictions, like requiring high down payments and banning the purchase of multiple apartments. The proliferation of red tape, together with the increasingly unaffordable real estate, has become a potent symbol of the thwarted economic hopes and the dwindling social mobility that characterize today’s urban China.

In newspapers and dinner table conversations, stories abound of husbands and wives filing fake divorces to get around stringent real estate purchasing restrictions for families. There are also tales of acrimonious disputes between the parents of divorcing couples when both sets claim ownership of the couple’s apartment because they contributed to the purchase. Recently, more than 10,000 home buyers in Beijing found themselves stuck in financial limbo when the government suddenly increased down payment requirements after they had agreements to buy, leaving them short overnight.

In some cases, the housing challenges affect decisions about having children. After the one-child policy was scrapped in 2015, several mothers with single sons confessed to me their reservation about giving birth again: Adding another son would wreck the family’s finances in the future, they explained, because parents are still expected to provide sons with apartments when they reach marriage age to make them eligible bachelors for potential mates.

Nowhere are home buyers’ struggles better reflected than in the saga surrounding “school-district apartments.” Home ownership guarantees owners access to public schools, and the fierce competition among parents for apartments near highly valued schools has long been considered a culprit of the exorbitant housing prices in prosperous metropolises. In certain areas in Beijing, families are now asked to own homes for at least three years before they can qualify for local schools.

read more…

https://www.nytimes.com/2017/06/15/opinion/chinas-real-estate-mirage.html?_r=0#story-continues-1

#Delinquency Rates Point to Continued Healing | Armonk Real Estate

Following a surprising, but small, increase in the percent of 1-4 family first-lien mortgages that were either 90 or more days delinquent or were in the process of foreclosure over the fourth quarter of 2016, the Mortgage Bankers Association reported that the measure continued its descent in the first quarter of 2017. This measure of delinquency, at least for conforming loans, is declining for both borrowers with a credit score below 660 and borrowers at or above it. Moreover, the gap in rate of delinquency for the two categories of borrowers is shrinking.

After rising by 10 basis points to 1.8 percent over the fourth quarter of 2016, the proportion of all mortgages either 90 or more days delinquent or in the foreclosure process fell by 10 basis points over the first quarter of 2017, currently sitting at 1.7 percent. The proportion of mortgages either 90 or more days past due or in the foreclosure process is highest for FHA-insured mortgages, 2.6 percent, and lower for both VA and Conventional loans.

However, at 2.6 percent, this measure of delinquency is below its 2005-2008 average of 4.1 percent. Similarly the current level of 90 or more day delinquency or entering the foreclosure process for VA loans is also below its average in the three years prior to the most recent recession. However, despite a rate below the overall percentage, conventional loans either 90 or more days delinquent or starting the foreclosure process remains 20 basis points above its 2005-2007 average level, 1.3 percent.

The Federal Housing Finance Agency, which oversees the government-sponsored entities (GSEs), Fannie Mae and Freddie Mac, provides estimations of loans purchased by the GSEs that become 90 or more days delinquent or start the foreclosure process*. This information is also provided by credit score, scores under 660 and those above or equal to 660. However, the series does not begin until 2009.

Overall, the proportion of mortgages 90 or more days past due or starting the foreclosure process has declined since its 2010 peak level. The declines have taken place for both mortgages loans obtained by borrowers with a credit score below 660 and borrowers with a credit score above 660. Currently, 4.6 percent of borrowers with a credit score below 660, the proportion of mortgage loans either 90 or more days delinquent or in the process of foreclosure, 8.3 percentage points less than its peak. The 0.8 percent of borrowers with a credit score at or above 660 with this kind of delinquency rate is 2.7 percentage points below its peak level, 3.5 percent.

Although the 90 or more day delinquency and foreclosure started rate for borrowers in both credit score categories is declining, the rate of decrease for borrowers with less than a 660 credit score is falling faster. As a result, the gap between these delinquency rates is shrinking. The figure above shows that at its peak in 2009 and 2010, the percent of borrowers with less than a 660 had a 90 or more day delinquency and foreclosure started rate that was 8 percentage points above the rate for borrowers with a credit score at or above 660. This gap has now shrunk to 3.4 percentage points.

Specifically, the data for 90 or more days delinquent is calculated as the residual between the percent of loans 60 or more days delinquent and the portion 60-89 days past due.

The definitions for the FHFA components are as follows:

60-plus-days Delinquent – Loans that are two or more payments delinquent, including loans in relief, in the process of foreclosure, or in the process of bankruptcy, i.e., total servicing minus current and performing, and 30 to 59 days delinquent loans. Our calculation may exclude loans in bankruptcy process that are less than 60 days delinquent.

60-89 Days Delinquent – Includes loans that are only two payments delinquent.

Serious Delinquency – All loans in the process of foreclosure plus loans that are three or more payments delinquent (including loans in the process of bankruptcy).

The definition of serious delinquency in the FHFA data likely differs from the MBA definition of “seriously delinquent” provided below.


read more….

http://eyeonhousing.org/2017/05/trends-in-delinquency-rates-point-to-continued-healing/

Zillow kickback problem | Armonk Real Estate

Earlier this month, Zillow Group Z, +0.39%  , the popular online real estate data provider, reported blowout earnings. Revenue rose 32% compared to a year ago, and online visits were up 18%.

But there was a note of caution in its earnings release. In April, the company said, it had received a notice from the Consumer Financial Protection Bureau that questioned whether some of Zillow’s advertising revenues violated regulations against kickbacks.

At issue is the question of how a real estate service provider, like a real-estate agent or lender, gets business from a home buyer. Congress passed the Real Estate Settlement Procedures Act, also known as RESPA, in 1974 to make sure those providers weren’t funneling customers to each other in exchange for kickbacks or other inappropriate rewards.

Real estate market observers say that while Zillow’s broad footprint and accessible data have been a boon for customers, deciding whom to hire for the transaction is often a fraught process that could benefit from more transparency and less of the old handshake-deal approach that has often characterized real estate.

In Zillow’s case, what’s called “co-marketing” works by allowing a real estate agent to share the cost of an ad on the web site with a preferred lender.

Zillow

This practice makes it seem as though those lenders or agents are receiving a seal of approval from each other or from Zillow itself. Many industry participants see the co-marketing process as little more than advertising that may appear like due diligence to a captive and uninformed customer.

There’s broad recognition among consumer advocates – and the CFPB itself – that would-be home buyers don’t shop for mortgages. It’s hard to spend the time required with more than one lender, and there are concerns about checking credit scores too frequently. And many lenders use confusing jargon that makes it hard for consumers to compare one offer to another.

“People do real estate transactions rarely, a couple times in their lifetime, so it’s not like people can gain experience, and it’s hard to shop around because you don’t know what you’re asking for,” said Andrew Pizor, a staff attorney at the National Consumer Law Center.

“It’s opaque and there’s very little competition,” Pizor continued. “It’s a horrible market. As a consumer advocate I have my doubts about the free market, but this is not a free market in terms of supply and demand and transparency. It just puts consumers even more at risk.”

As Pizor puts it, “you only want people to be making a referral for reasons based on the merits of the product or the service: they’re good and you trust them or they have a product you can’t get elsewhere, not because you’re getting referrals.”

The CFPB’s interest dates back to 2015. The agency has requested information several times since then, with the most recent request, a civil investigative demand, coming in April. “We are continuing to cooperate with the CFPB in connection with their most recent request for information,” Zillow’s earnings report noted. “We continue to believe that our acts and practices are lawful and that our co-marketing program allows lenders and agents to comply with RESPA.”

The next step, Zillow added, could be what’s known as an “enforcement action,” which could include “restitution, civil monetary penalties, injunctive relief or other corrective action. We cannot provide assurance that the CFPB will not ultimately commence a legal action against us in this matter, nor are we able to predict the likely outcome of the investigation into this matter.”

A Zillow spokeswoman declined to answer MarketWatch questions on the scale of the co-marketing program. Company management fielded four analyst questions on the CFPB review on its quarterly earnings call and said little except that “it’s a small portion of overall revenue.”

But the prepared remarks for the earnings release noted that customer leads rose 30% compared to a year ago in the first quarter, and “we continue to expect that growth in contacts sent to Premier Agent advertisers will outpace unique user growth.”

In an emailed statement, the spokeswoman wrote, “Zillow offers myriad ways for consumers to comparison shop for lenders and agents. Rather than offer a few service providers, consumers can browse more than a million reviews for agents and lenders, including published, up-to-the-minute mortgage rates being offered and skill sets of particular agents. Zillow Group’s mission is to give consumers lots of information so they can make good choices when choosing agents and lenders for one of the most important transactions of their lives.”

The CFPB also declined to discuss the matter with MarketWatch.

The agency usually only takes actions like the ones against Zillow when it believes its case is “pretty clear-cut,” Pizor told MarketWatch. “I think the CFPB is being generous. I think the law is pretty clear.”

Still, Pizor said, a ruling from the CFPB would help bring clarity to the market – a step many real estate professionals would welcome. The National Association of Realtors has released best practices materials recommendations and industry lawyers are watching carefully.

The CFPB earlier this year fined Prospect Mortgage, a lender, with failing to comply with RESPA. It also fined two real estate brokers and a mortgage servicer, all of whom it said took kickbacks from Prospect.

To many industry participants, it seems clear that the co-marketing arrangement must be very profitable for Zillow. Why else would a new-media company founded to, as it says in its mission statement, “empower” customers with new ways of shopping for and maintaining a home cling to an outdated way of doing business, rather than trying to disrupt it with a newer, better model?

“Nobody is doing referral fees any more. They were done away with. Marketing service agreements are the next wave of that,” said Brian Faux, CEO of Morty, an online mortgage brokerage.

Faux describes Zillow as a “great web site with a lot of data that’s good for consumers,” including data that helps them understand the cost of owning a home.


read more…


http://www.marketwatch.com/story/zillow-advertising-under-cfpb-fire-sets-real-estate-industry-on-edge-2017-05-18

U.S. Housing: Going From Good To Great | Armonk Real Estate

Activity levels and selling prices for the domestic real estate market last peaked in 2005, two years after the prior peak of the economic cycle (i.e., GDP) in 2003 (at 4.4%). Thus, by preceding the 2008-09 recession, this most recent national housing bust set a precedent as the first in recorded history in which housing helped lead the economy down.

And when economic activity bottomed in early-’09 (March GDP fell 4.9%), domestic housing remained at stubbornly low levels for a few more years.

Sources: US Dept. of Labor (BLS), National Association of Realtors (NAR), US Bureau of Census.

Note: sales of existing homes account for >90% of all homes sold in the US, up from ~85% pre-crisis.

Even today, more than a decade after the start of housing’s precipitous decline, total US sales volumes (including new homes) remain nearly 30% below peak levels, and over 15% below the 2000-’05 average.

It is a different world post-crisis / housing bust, and residential real estate’s demographic hurdles remain high. For example, baby boomers, many of whom live on fixed income payments, are only beginning to downsize or move into managed care facilities.

The more pervasive demographic challenge to home-ownership rates – now below 64%, vs. more than 69% in 2004 – is posed by ‘echo boomers’, in their 20’s and 30’s. Born in the 80’s and 90’s these younger demo’s that nevertheless still account for the bulk of entry-level home purchases, more often favor renting over buying, a contrast to their parents and grandparents.

Thus, Entry-level home-buying now represents only about one-third of housing activity, down solidly from pre-crisis historical levels averaging 40%. First-time buying has, however, slowly improved from cycle lows in the high 20%’s, and in my opinion has plenty of runway ahead.

Sources: US Dept. of Labor (BLS),

A couple quick observations. The tight relationship between labor force participation and home-ownership, both of which appear to be bottoming or at least steadying. And, more importantly, the nearly six percentage point drop in home-ownership since 2004, and the comparable decline in entry level home purchases from most past averages.

This paucity of first-time purchases, of relatively inexpensive homes, in fact overstates housing’s recent strength and helps underscore the housing industry’s lack of breadth. Case-Shiller, a commonly used barometer of domestic house prices (only), echoes later price charts, and indicates average selling prices (ASP’s) are still below levels more than 10 years ago.

Source: S&P Corelogic Case-Shiller.

It’s About Jobs (Mainly)

The most important driver for housing demand is job growth. Moreover, it’s the absolute number of jobs created, rather than the unemployment rate, that housing most depends.

The 2017 YTD figure is annualized, and based on latest figures: April’s jobs and March’s home sales.

Sources: US Dept. of Labor (BLS), NAR.

Indeed, existing home sales have tracked changes in jobs, but in direction – rather than in magnitude. Since housing peaked in late-2005, the US economy has added roughly 11 million new jobs, yet housing activity remains solidly below past levels, as we’ll talk more about. At some point new jobs will more accurately translate into similar increases in home sales.

Confidence Is Key

Consumer confidence is the next most important driver of home sales, after employment. Multiple cycles of empirical data bear this out.

Consumer sentiment based on annual averages of month-end figures

Sources: University of Michigan, US Dept. of Labor (BLS), NAR

Despite steady improvements in consumer confidence since its 2008 trough, the figure, though still steadily upward trending, remains below it base level (100) just as home sales volumes track below their ‘normalized’ levels.

To paraphrase Jamie Dimon, CEO of JP Morgan Chase, the country’s #2 mortgage originator (after Wells Fargo), consumer confidence is the ‘secret sauce’, to housing.

Interest Rates Matter, Though Less Than Is Assumed

Of course rates matter for housing: a single percentage point decline in mortgage rates buys a 15% more house (over 30 years, ceteris paribus). But, contrary to conventional beliefs, empirical evidence suggests interest rates rank behind consumer confidence in terms of importance for the industry.

Although it’s the third leg of the proverbial stool supporting home sales, (mortgage) rates are the factor that most directly benefit from a Federal Reserve Board that has been decidedly ‘dovish’, pursuing relatively easy monetary policy these past 35 years or so.

Source: NAR

Yet as investors (and borrowers) handicap a potential increase in short-term rates by the central bank in its next (NYSEARCA:JUNE) meeting, we tend to overstate the impact of mortgage rates on housing.

Favorable borrowing rates had a mitigating effect on the housing ‘bust’. The Fed’s move to zero short-term rates, which lasted a full seven-years (Dec. ’08 – Dec. ’15) has thus far had a similarly benign impact on the subsequent recovery.

Their impact (low rates) has been partly muted by a number of factors, mainly mortgage originators’ basic business decisions (i.e., risk / reward), stricter home-lending regulations, the disappearance of independent mortgage brokers (e.g., Washington Mutual, Countrywide, etc.) and the reduced activity among government sponsored mortgage securitizers (e.g, Fannie Mae).

Yet were it not for mortgage rates following 10-year Treasurys to just over 2% with the launch of quantitative easing (late-2008), financial history might have been much different: One can only speculate on the further damage to home prices, mortgages (especially adjustable), securitizations, etc. that would have occurred had the Federal Reserve not stepped in with zero rates and levered its balance sheet by $4 trillion.

read more…

https://seekingalpha.com/article/4070667-u-s-housing-going-good-great

New Home Sales Post Slight Increase | Armonk Real Estate

New home sales contracts expanded by 3.7% in January over a soft December reading, according to estimates from the joint data release of HUD and the Census Bureau. Despite the gain, which places the January pace of sales 5.5% higher than a year ago, the current seasonally adjusted annual rate of 555,000 is slightly below the positive growth trend that has been in place over the last few years.

Inventory growth continued in January. After hovering near 240,000 for most of 2016, inventory increased to 247,000 in October, 256,000 in December and 265,000 in January. The current months’ supply number stands at 5.7, higher than the existing market (3.6) estimate.

Solid builder confidence and ongoing tight inventory conditions suggest continued growth for single-family construction in the months ahead. An open question is pricing, given rising construction prices and increasing interest rates. New homes will need to be competitively priced, even as prices for existing homes continue to grow. For this reason, we continue to expect a broadening of the new home inventory base and slight declines in median new home size.


read more…


http://eyeonhousing.org/2017/02/new-home-sales-post-slight-increase/