
This is the third of three articles about the U.S. housing market. Ex-housing, the U.S. is in deflation currently at -1% YoY. So the only current “inflation risk” that might justify the Fed raising rates is the appreciation in house prices. In my previous two posts, I explained that both housing and apartment demand are supported by increased demographic demand, as the Millennial generation creates about the same affect on single and multi-unit housing as their Boomer parents and grandparents did 50 years ago. Further, there has been a marked increase in foreign buying of homes, skewed towards the upper end and disproportionately all-cash purchases. As a big part of this increase has come from Chinese nationals, the current problems hitting that county may ease demand, and therefore ease upward pressure, on U.S. house prices.
But some have argued that housing has entered a 2nd bubble. Some of this comes from the usual Doomer chorus Seriously, one guy actually claimed a couple of weeks ago that there was a bubble in rents! It must be the Underpants Gnomes theory of bubbles:
1. rent lots of vacant units
2. ???
3. Profit!
What’s the missing step 2? Sublet everything, because everyone knows that rents only go up?!?
But some is more serious analysis. The website Political Calculations, for example, believes there is a bubble based on the movement in prices vs. median household income. Here’s their relevant graph:
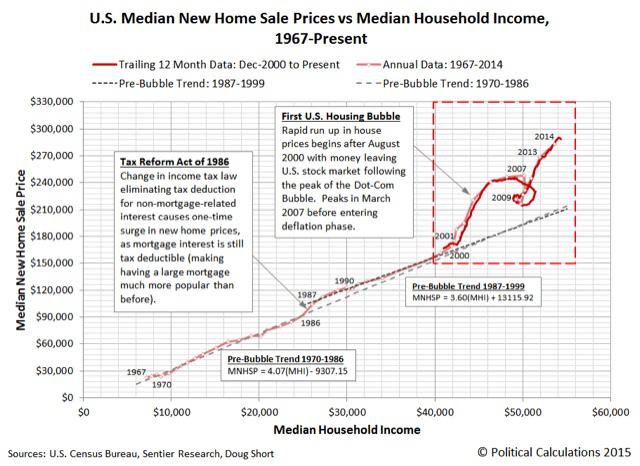
The point of view does have merit, since after all it is households buying houses! But I believe that misses the bigger picture.
To begin with, the big problem in assessing house prices is that, since housing is itself nearly 40% of the CPI, by what should house prices be deflated, for a “real” measure? Here is a graph created by Doug Short, the Case Shiller house index by median household income, by the entire CPI, and by owner’s equivalent rent:
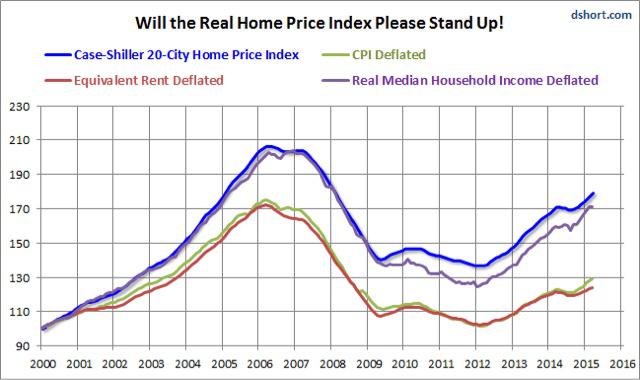
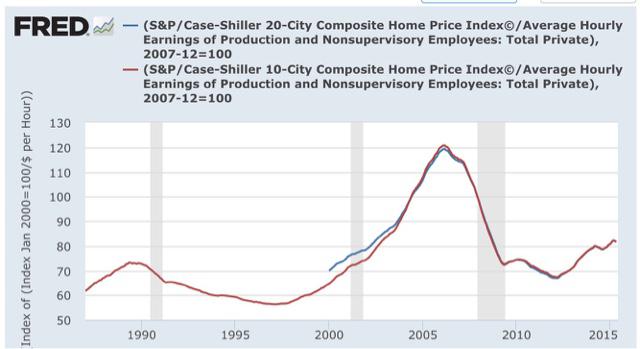
Nominal house prices, and prices deflated by median household income, appear to show housing in a new bubble. But deflated by CPI and by owner’s equivalent rent, prices haven’t moved much off their bottom. Nor has there been much movement when house prices are deflated by average hourly wages:
To sort out how extreme (or not) house prices are, let’s consider three types of purchasers:
1. the entry level purchaser, likely young, likely buying a townhouse, condo, or small single family home perhaps in an inner ring suburb.
2. the move-up purchaser, trading in a smaller house for a bigger one.
3. the retirement purchaser, either downsizing or building the retirement home of their dreams.
Income is likely the main measure for the 1st purchaser. They probably don’t have a lot of savings with which to make a big downpayment, and may be getting help from family members. The most important thing for them is whether they will be able to make the monthly mortgage payment and other bills.
While household income constrains that ability, mortgage rates also loom large. And here is what happens when we calculate the monthly mortgage payment of a house, as measured by the Case Shiller Index, and then adjusted for mortgage rates:
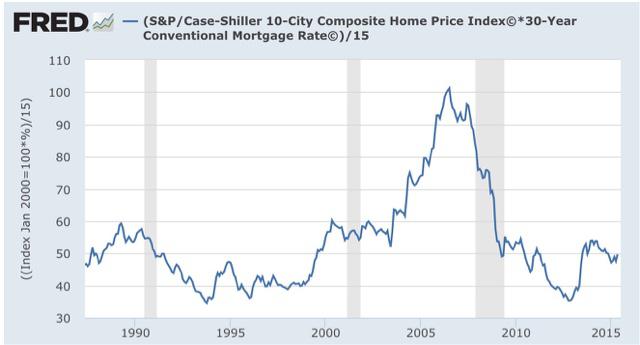
Courtesy of lower mortgage rates, even though median household income has actually declined for all ages 25-64 since 2007, the typical monthly mortgage payment now is only about 50% of what it was at the peak of the housing bubble, even when we take median household income into account.
read more…
http://seekingalpha.com/article/3434566-why-there-is-no-second-housing-bubble?ifp=0