Home prices rose 18.6% annually in June, up from a 16.8% increase in May, according to the S&P CoreLogic Case-Shiller national home price index.
Prices are now 41% higher than their last peak during the housing boom in 2006.
Home prices continue to surge due to strong demand and persistent low supply.
Douglas Elliman Real Estate open house
Home prices rose 18.6% annually in June, up from the 16.8% increase in May, according to the S&P CoreLogic Case-Shiller national home price index.
That is the largest annual gain in the history of the index dating back to 1987. Prices nationally are now 41% higher than their last peak during the housing boom in 2006.
Unlike other median price surveys, which can be skewed by the type of homes selling, this measures repeat sales of similar homes over time.
The 10-City composite rose 18.5%, up from 16.6% in the previous month. The 20-City composite was up 19.1%, up from 17.1% in the previous month.
Phoenix, San Diego, and Seattle reported the strongest price increases of the 20 cities. Prices in Phoenix increased 29.3% year-over-year. In San Diego they rose 27.1%, and in Seattle they were up 25.0%. All 20 cities reported higher price increases in the year ending June 2021 versus the year ending May 2021.
“The last several months have been extraordinary not only in the level of price gains, but in the consistency of gains across the country,” said Craig Lazzara, managing director and global head of index investment strategy at S&P DJI. “In June, all 20 cities rose, and all 20 gained more in the 12 months ended in June than they had gained in the 12 months ended in May.”
Prices in just about every city in the 20-city index, except for Chicago, are at all-time highs, he said, as are the national composition and the 10- and 20-city indices.
Home prices continue to surge due to strong demand and persistent low supply. While supply has been increasing month to month, it was still down 12% in July year-over-year, according to the National Association of Realtors.
Peter Boockvar, chief investment officer at Bleakley Advisory group, said prices are rising at “a really out of control pace that is unsustainable and unhealthy.”
Home sales, however, have started to cool. Signed contracts on existing homes dropped in July, according to the National Association of Realtors. Prices usually lag sales by about six months, so that could be a sign that price gains will stop accelerating as they have been for over a year.
“According to new Ally Home data, 45% of buyers say they have delayed purchasing a home due to market conditions, with 29% citing high home prices and 20% indicating homes selling too quickly as factors in this delay,” says Glenn Brunker, president of Ally Home.
Low mortgage rates continue to keep prices strong. Rates will rise if the Federal Reserve slows its purchases of mortgage-backed bonds, but so far that is not expected to happen in the near term.
Fannie Mae’s HPSI sees “good time to buy” sentiment drop to survey low
Homebuyers are feeling pretty discouraged by the housing market these days. The latest Fannie Mae Home Purchase Sentiment Index shows that just 35% of consumers believe now is a good time to buy a home, down from 47% in April. And those who believe it is a bad time to be a homebuyer increased to 56% from 48%.
“Consumers appear to be acutely aware of higher home prices and the low supply of homes, the two reasons cited most frequently for that particular sentiment,” said Doug Duncan, senior vice president and chief economist at Fannie Mae.
“However, despite the challenging buying conditions, consumers do appear more intent to purchase on their next move, a preference that may be supported by the expectation of continued low mortgage rates, as well as the elevated savings rate during the pandemic, which may have allowed many to afford a down payment,” Duncan said.
Though low inventory, bidding wars and high prices have knocked down homebuyer sentiment, other factors, such as a rebounding economy and stable income levels, pushed the overall HSPI index up one point to 80 in May.
In fact, four of the HPSI’s six components measuring market expectations increased month over month. The HPSI is still 12.5 points higher than it was in May 2020, when forbearance and unemployment heavily weighed down consumer sentiment.
Because the housing market feels very much like a zero sum game at this point, sellers again felt good about their position. Just over two-thirds of those surveyed in June said it was a prime time to list a home and tempt the swarms of homebuyers, unchanged from the prior month.
Respondents also remained virtually unaltered on how much homes will actually cost. The percentage of respondents who say home prices will go up in the next 12 months decreased from 49% to 47%, while the percentage who say home prices will go down remained unchanged at 17%. The share who think home prices will stay the same increased from 27% to 29%.
Mortgage rate expectations changed a bit in May for prospective homebuyers and sellers: The percentage who expect mortgage rates to go up decreased from 54% to 49% while the share of those who think mortgage rates will stay the same increased from 33% to 38%. The remaining 6% are hopeful they may slide back down.
Since rates have fallen back below 3% once again, Fannie Mae’s economic and strategic group revised its expectations for purchase and refinance volume. The economic group cut $43 billion from its 2021 purchase volume forecast; it now estimates that purchase mortgages will hit $1.8 trillion by year’s end.
Because record low mortgage rates fueled the refinance wave of 2020’s housing market, Fannie Mae also revised its refi origination volume to $2.2 trillion in 2021, an increase of $125 billion from the previous month’s forecast.
Borrowers who aren’t stuffing their pockets full of refi savings may be making it up on the job market. The percentage of respondents who say their household income is significantly higher than it was 12 months ago increased from 21% to 29%, while the percentage who say their household income is significantly lower decreased from 17% to 13%. To top it off, the percentage of respondents who say they are not concerned about losing their job in the next 12 months increased from 80% to 87%.
The Federal Housing Finance Agency (FHFA) found that house prices across the nation rose 16% from April 2020 to April 2021.
From March to April, house prices across the nation rose 1.8%, surpassing the previous month’s 1.6% increase.
Three regions — the Pacific coast, the western states and New England — saw more pronounced year over year increases. The FHFA index tracks seasonally-adjusted, purchase data from Fannie Mae and Freddie Mac.
In the mountain division, which includes Colorado, New Mexico, Idaho, Wyoming, Utah, Nevada, Arizona and Wyoming, house prices rose 21% year over year. In the pacific division, encompassing Washington, Oregon and California, prices rose 18%. In Maine, Vermont, New Hampshire, Massachusetts, Connecticut and Rhode Island, house prices also rose 18%.
“House prices recorded another monthly and annual record in April,” said Dr. Lynn Fisher, FHFA’s deputy director of the division of research and statistics. “This unprecedented price growth persists due to strong demand, bolstered by still-low mortgage rates, and too few homes for sale.
Mortgage rates rose above 3% for the first time in 10 weeks last week. Mortgage applications are still on the rise, however.
House prices have risen during the past year as a result of elevated lumber prices, a lack of available homes and increased demand for homes.
Lockdowns early in the pandemic led many to work from home and divide their living space into home offices. Those who were able to bought homes with more space, better suited to the pandemic remote work trend.
That has led to astonishing price increases in markets like Seattle, where the median home-sale price rose more than 26% year-over-year to a record $737,800 in May 2021. Tech employees there, faced with working remotely from cramped apartments, instead hunted for homes with more space.
“I’ve never seen anything like this housing market,” a Seattle-area Redfin agent said.
S&P Dow Jones Indices (S&P DJI) today released the latest results for the S&P CoreLogic Case-Shiller Indices, the leading measure of U.S. home prices. Data released today for February 2021 show that home prices continue to increase across the U.S. More than 27 years of history are available for the data series, and can be accessed in full by going to https://www.spglobal.com/spdji/.
YEAR-OVER-YEAR
The S&P CoreLogic Case-Shiller U.S. National Home Price NSA Index, covering all nine U.S. census divisions, reported a 12.0% annual gain in February, up from 11.2% in the previous month. The 10-City Composite annual increase came in at 11.7%, up from 10.9% in the previous month. The 20-City Composite posted an 11.9% year-over-year gain, up from 11.1% in the previous month.
Phoenix, San Diego, and Seattle reported the highest year-over-year gains among the 20 cities in February. Phoenix led the way with a 17.4% year-over-year price increase, followed by San Diego with a 17.0% increase and Seattle with a 15.4% increase. Nineteen of the 20 cities reported higher price increases in the year ending February 2021 versus the year ending January 2021.
MONTH-OVER-MONTH
Before seasonal adjustment, the U.S. National Index posted an 1.1% month-over-month increase, while the 10-City and 20-City Composites both posted increases of 1.1% and 1.2% respectively in February.
After seasonal adjustment, the U.S. National Index posted a month-over-month increase of 1.1%, and the 10-City and 20-City Composites both posted increases of 1.1% and 1.2% respectively as well. In February, all 20 cities reported increases before and after seasonal adjustments.
ANALYSIS
“Strong home price gains continued in February 2021,” says Craig J. Lazzara, Managing Director and Global Head of Index Investment Strategy at S&P DJI. The National Composite Index marked its ninth month of accelerating prices with a 12.0% gain from year-ago levels, up from 11.2% in January. This acceleration is also reflected in the 10- and 20-City Composites (up 11.7% and 11.9%, respectively). The market’s strength continues to be broadly-based: all 20 cities rose, and 19 cities gained more in the 12 months ended in February than they had gained in the 12 months ended in January.
“More than 30 years of S&P CoreLogic Case-Shiller data help us to put February’s results into historical context. The National Composite’s 12.0% gain is the highest recorded since February 2006, exactly 15 years ago, and lies comfortably in the top decile of historical performance. Housing’s strength is reflected across all 20 cities; February’s price gains in every city are above that city’s median level, and rank in the top quartile of all reports in 18 cities.
“These data remain consistent with the hypothesis that COVID has encouraged potential buyers to move from urban apartments to suburban homes. This demand may represent buyers who accelerated purchases that would have happened anyway over the next several years. Alternatively, there may have been a secular change in preferences, leading to a permanent shift in the demand curve for housing. Future data will be required to analyze this question.
“Phoenix’s 17.4% increase led all cities for the 21st consecutive month, with San Diego (+17.0%) and Seattle (+15.4%) close behind. Although prices were strongest in the West (+13.0%) and Southwest (+12.9%), every region logged double-digit gains.”
SUPPORTING DATA
Table 1 below shows the housing boom/bust peaks and troughs for the three composites along with the current levels and percentage changes from the peaks and troughs.
2006 Peak
2012 Trough
Current
Index
Level
Date
Level
Date
From Peak (%)
Level
From Trough (%)
From Peak (%)
National
184.61
Jul-06
133.99
Feb-12
-27.4%
238.82
78.2%
29.4%
20-City
206.52
Jul-06
134.07
Mar-12
-35.1%
246.04
83.5%
19.1%
10-City
226.29
Jun-06
146.45
Mar-12
-35.3%
259.50
77.2%
14.7%
Table 2 below summarizes the results for February 2021. The S&P CoreLogic Case-Shiller Indices could be revised for the prior 24 months, based on the receipt of additional source data.
February 2021
February/January
January ’21/December ’20
1-Year
Metropolitan Area
Level
Change (%)
Change (%)
Change (%)
Atlanta
171.44
0.9%
0.8%
10.0%
Boston
254.42
0.9%
0.7%
13.7%
Charlotte
187.36
1.0%
0.7%
11.7%
Chicago
154.76
0.3%
0.3%
8.6%
Cleveland
142.62
0.8%
0.1%
12.5%
Dallas
214.38
1.7%
0.8%
10.9%
Denver
250.39
1.8%
1.0%
11.2%
Detroit
142.63
1.0%
0.6%
11.7%
Las Vegas
214.78
1.0%
0.9%
9.1%
Los Angeles
325.33
1.3%
1.0%
11.9%
Miami
275.88
1.0%
1.2%
11.0%
Minneapolis
198.56
1.0%
0.0%
10.4%
New York
227.36
0.6%
1.0%
11.6%
Phoenix
236.51
2.0%
1.6%
17.4%
Portland
270.66
1.3%
1.0%
11.4%
San Diego
310.62
2.9%
1.5%
17.0%
San Francisco
298.34
2.1%
0.6%
11.0%
Seattle
299.95
2.4%
1.5%
15.4%
Tampa
255.05
1.3%
1.1%
12.7%
Washington
262.18
1.0%
0.7%
11.1%
Composite-10
259.50
1.1%
0.9%
11.7%
Composite-20
246.04
1.2%
0.9%
11.9%
U.S. National
238.82
1.1%
0.9%
12.0%
Sources: S&P Dow Jones Indices and CoreLogic
Data through February 2021
Table 3 below shows a summary of the monthly changes using the seasonally adjusted (SA) and non-seasonally adjusted (NSA) data. Since its launch in early 2006, the S&P CoreLogic Case-Shiller Indices have published, and the markets have followed and reported on, the non-seasonally adjusted data set used in the headline indices. For analytical purposes, S&P Dow Jones Indices publishes a seasonally adjusted data set covered in the headline indices, as well as for the 17 of 20 markets with tiered price indices and the five condo markets that are tracked.
S&P Dow Jones Indices (S&P DJI) today releases the latest results for the S&P CoreLogic Case-Shiller Indices, the leading measure of U.S. home prices. Data released today for December 2020 show that home prices continue to increase across the U.S. More than 27 years of history are available for the data series, and can be accessed in full by going to https://www.spglobal.com/spdji/.
Please note that transaction records for October 2020 and November 2020 for Wayne County, MI, are now available. Due to delays at the local recording office caused by the COVID-19 pandemic, S&P DJI and CoreLogic were previously unable to generate valid October 2020 and November 2020 updates for the Detroit S&P CoreLogic Case-Shiller Indices.
However, there are still an insufficient number of records from Wayne County for December 2020. Since Wayne County is the most populous county in the Detroit metro area, S&P DJI and CoreLogic are unable to generate a valid Detroit index value for December 2020. When the sale transactions data fully resumes, and sufficient data is collected, the Detroit index values for the month(s) with missing updates will be calculated.
YEAR-OVER-YEAR
The S&P CoreLogic Case-Shiller U.S. National Home Price NSA Index, covering all nine U.S. census divisions, reported a 10.4% annual gain in December, up from 9.5% in the previous month. The 10-City Composite annual increase came in at 9.8%, up from 8.9% in the previous month. The 20-City Composite posted a 10.1% year-over-year gain, up from 9.2% in the previous month.
Phoenix, Seattle, and San Diego continued to report the highest year-over-year gains among the 19 cities (excluding Detroit) in December. Phoenix led the way with a 14.4% year-over-year price increase, followed by Seattle with a 13.6% increase and San Diego with a 13.0% increase. Eighteen of the 19 cities reported higher price increases in the year ending December 2020 versus the year ending November 2020.
MONTH-OVER-MONTH
Before seasonal adjustment, the U.S. National Index posted a 0.9% month-over-month increase, while the 10-City and 20-City Composites both posted increases of 0.9% and 0.8% respectively in December. After seasonal adjustment, the U.S. National Index posted a month-over-month increase of 1.3%, while the 10-City and 20-City Composites both posted increases of 1.2% and 1.3% respectively. In December, 18 cities (excluding Detroit) reported increases before seasonal adjustment, while all 19 cities reported increases after seasonal adjustment.
ANALYSIS
“Home prices finished 2020 with double-digit gains, as the National Composite Index rose by 10.4% compared to year-ago levels,” says Craig J. Lazzara, Managing Director and Global Head of Index Investment Strategy at S&P DJI. “The trend of accelerating prices that began in June 2020 has now reached its seventh month and is also reflected in the 10- and 20-City Composites (up 9.8% and 10.1%, respectively). The market’s strength continues to be broadly-based: 18 of the 19 cities for which we have December data rose, and 18 cities gained more in the 12 months ended in December than they had gained in the 12 months ended in November.
“As COVID-related restrictions began to grip the economy in early 2020, their effect on housing prices was unclear. Price growth decelerated in May and June, and then began a steady climb upward, and December’s report continues that acceleration in an emphatic manner. 2020’s 10.4% gain marks the best performance of housing prices in a calendar year since 2013. From the perspective of more than 30 years of S&P CoreLogic Case-Shiller data, December’s year-over-year change ranks within the top decile of all reports.
“These data are consistent with the view that COVID has encouraged potential buyers to move from urban apartments to suburban homes. This may indicate a secular shift in housing demand, or may simply represent an acceleration of moves that would have taken place over the next several years anyway. Future data will be required to address that question.
“Phoenix’s 14.4% increase led all cities for the 19th consecutive month, with Seattle (+13.6%) and San Diego (+13.0%) close behind. Prices were strongest in the West (+10.8%) and Southwest (+10.5%), but gains were impressive in every region.”
SUPPORTING DATA
Table 1 below shows the housing boom/bust peaks and troughs for the three composites along with the current levels and percentage changes from the peaks and troughs.
2006 Peak
2012 Trough
Current
Index
Level
Date
Level
Date
From Peak (%)
Level
From Trough (%)
From Peak (%)
National
184.61
Jul-06
134.00
Feb-12
-27.4%
234.40
74.9%
27.0%
20-City
206.52
Jul-06
134.07
Mar-12
-35.1%
240.75
79.6%
16.6%
10-City
226.29
Jun-06
146.45
Mar-12
-35.3%
254.18
73.6%
12.3%
Table 2 below summarizes the results for December 2020. The S&P CoreLogic Case-Shiller Indices are revised for the prior 24 months, based on the receipt of additional source data.
December 2020
December/November
November/October
1-Year
Metropolitan Area
Level
Change (%)
Change (%)
Change (%)
Atlanta
168.58
0.8%
1.2%
8.9%
Boston
250.33
0.8%
1.4%
11.4%
Charlotte
184.40
0.7%
1.1%
10.2%
Chicago
154.45
0.3%
0.4%
7.7%
Cleveland
141.25
0.9%
0.1%
11.5%
Dallas
209.09
0.9%
0.8%
8.4%
Denver
243.49
0.9%
1.0%
9.2%
Detroit
—
—
0.7%
—
Las Vegas
210.65
1.1%
0.7%
7.9%
Los Angeles
317.64
0.7%
0.9%
9.9%
Miami
269.81
1.2%
1.3%
9.2%
Minneapolis
196.81
0.4%
0.6%
10.2%
New York
223.32
1.2%
1.9%
9.9%
Phoenix
228.24
1.1%
1.3%
14.4%
Portland
264.51
0.5%
0.7%
9.9%
San Diego
297.52
0.6%
0.9%
13.0%
San Francisco
289.88
0.0%
0.9%
8.7%
Seattle
288.75
0.9%
0.9%
13.6%
Tampa
248.92
1.2%
1.4%
10.7%
Washington
259.00
1.2%
1.1%
10.3%
Composite-10
254.18
0.9%
1.2%
9.8%
Composite-20
240.75
0.8%
1.1%
10.1%
U.S. National
234.40
0.9%
1.1%
10.4%
Sources: S&P Dow Jones Indices and CoreLogic
Data through December 2020
Table 3 below shows a summary of the monthly changes using the seasonally adjusted (SA) and non-seasonally adjusted (NSA) data. Since its launch in early 2006, the S&P CoreLogic Case-Shiller Indices have published, and the markets have followed and reported on, the non-seasonally adjusted data set used in the headline indices. For analytical purposes, S&P Dow Jones Indices publishes a seasonally adjusted data set covered in the headline indices, as well as for the 17 of 20 markets with tiered price indices and the five condo markets that are tracked.
S&P Dow Jones Indices is the largest global resource for essential index-based concepts, data and research, and home to iconic financial market indicators, such as the S&P 500® and the Dow Jones Industrial Average®. More assets are invested in products based on our indices than products based on indices from any other provider in the world. Since Charles Dow invented the first index in 1884, S&P DJI has been innovating and developing indices across the spectrum of asset classes helping to define the way investors measure and trade the markets.
S&P Dow Jones Indices is a division of S&P Global (NYSE: SPGI), which provides essential intelligence for individuals, companies, and governments to make decisions with confidence. For more information, visit https://www.spglobal.com/spdji/.
Fiberglass remains the most popular insulation choice among home builders, with better than a 50% market share according to some studies. The advantages are compelling: competitive cost and a ready installer base. But like any fiber insulation, the performance of fiberglass depends on the quality of the installation job. Well-installed fiberglass is as effective as any insulation, R-value being equal, while poorly installed fiberglass underperforms its promised R-value rating. So it’s up to the builder to ensure a quality job.
To insulate effectively, fiberglass batts need to fill the entire stud bay without being compressed. To insulate a wall, start by filling the full-width bays. Insert the batt from the top down, pushing it up against the wall plates. If the sides snag on rough lumber, run a putty knife along the side of the stud.
Fiberglass gets its insulating quality not from the fiberglass itself but from the air that is trapped between the fibers. Wind pressure or even convective air pressures can make that air move, degrading the thermal performance of the batt. So to be effective, fiberglass has to be protected against air pressures. There’s a simple rule that’s not always followed: Align the air pressure boundary of the building with its thermal boundary. In practice, that means that fiberglass batts need to be installed in walls so that the batt is in full contact with the wall sheathing on the outboard side and with the drywall on the inboard side. The batts also have to be in full contact with the studs on either side of the stud cavity.
Housewrap on the wall is critical to the performance of this assembly. Wind blowing into the wall through cracks and crevices can degrade the performance of the insulation by 50% or more. Well-installed housewrap prevents this air intrusion and allows the insulation to perform at its rated value.
In the fast-moving world of the job site, insulation installers are under pressure to make time. The task often is not thought of as a craft where quality matters. But in fact, the insulation installer’s job is significant in the overall performance of the finished house, and there is skill involved. Insulation workers should be trained and supervised to do a quality job.
Batts should be carefully fit to the space. If the stud spacing varies from the standard 16-inch or 2-foot spacing, the batts should be trimmed to fit snugly, rather than jammed into the space. Batts should be cut around obstructions such as outlets or switch boxes. Where wiring interferes with the placement of the batt, the batt should be split and carefully fit around the wires. To make sure the batt is in contact with the wall sheathing, the installer should push the batt back against the sheathing, then pull the face side out from the wall to fluff the material up.
A Complete Air Barrier
To be effective, a home’s air barrier should be continuous and complete. This isn’t too hard to accomplish for most areas of the house, but there are locations in the building envelope where air barrier assemblies are sometimes neglected. These elements are called out in the Energy Star program’s Thermal Bypass Checklist. (See also the EPA’s Thermal Bypass Checklist Guide for detailed instruction on completing the checklist.)
Steve BaczekThree-dimensional thermal bypass checklist. Many organizations have published lists of areas in a building that are likely to challenge the air barrier. Making a 3D rendering takes the checklist one step further, giving users a visual graphic to better understand and deal with these areas of concern.
One example is the location where a tub or shower unit is placed against an exterior wall. It’s common for the wall to be insulated, then the tub to be set without the wall being drywalled first. This results in the insulation being exposed to the air behind the tub, rather than protected and supported. To satisfy the Thermal Bypass Checklist, that wall should be drywalled or otherwise covered with a rigid sheet material before the tub is installed.
Fireplaces are similar to tubs and showers: They are often set against an insulated wall that hasn’t been drywalled. Here again, the Thermal Bypass Checklist calls for that wall to be covered with a rigid material that will resist airflow and support the insulation.
Another example is the wall between an unconditioned attached garage and the conditioned part of the house. While the garage wall may be drywalled, it’s often the case that the wall above the garage ceiling is left with exposed insulation. To satisfy the checklist, the interface between the house and the unconditioned space should be covered with a rigid airtight material.
Similarly, builders sometimes attach porch roofs to the main house without first sheathing the exterior wall, potentially leaving insulation exposed to the unconditioned air under the roof. To satisfy the checklist, this juncture must be protected with an air barrier material. The simplest way to accomplish this is just to sheathe the house wall before attaching the porch.
The Importance of the Stack Effect
Air movement through an air barrier requires a pressure difference and a hole for the air to move through. In cold climates, one of the important sources of pressure difference is the stack effect. Heated air in the building has a tendency to rise, creating a negative (outdoor to indoor) pressure at the bottom of the house and a positive (indoor to outdoor) pressure at the top of the house. There’s nothing you can do to prevent stack pressure from occurring. So to address the air leakage, the strategy is to seal up the holes.
Layers of pressure. As warm air rises inside a typical home, the pressure changes from inward pressure (infiltration) at the bottom of the building to outward pressure (exfiltration) at the top, with a neutral pressure plane in the middle. Because the pressure increases with the distance from the neutral plane, the top and bottom of the building are the most critical for establishing an air barrier.
In practical terms, this means that the priority air leaks in a two-story or higher house are the lowest and the highest holes in the air barrier. Pay special attention to low leak points such as the first-floor band joist area, and to high leak points such as the second-floor ceiling. Time spent sealing up attic locations such as can light penetrations, duct registers, and wall top plates will pay off in performance during cold weather.
A $500 drop in rents is drawing people back to Manhattan, according to a new report from Douglas Elliman.
With landlords piling on concessions, new leases surged to the highest October total in 12 years after stalling for the past 14 months.
But with over 16,000 empty apartments in the borough, any return to normal is an uphill climb.
Vacancy has climbed to over six percent compared to two percent at the same time last year. It is now at its highest in 14 years after the coronavirus pandemic drove Manhattanites to more suburban and rural areas.
Nevertheless, appraiser Jonathan Miller, who compiled the Douglas Elliman reports, paints a glass half full picture.
JONATHAN MILLER
“While the usual records continued – high inventory and landlord concessions – Manhattan saw a sharp uptick in new leases for the first time since the summer of 2019,” said Miller.
“Falling rents are beginning to pull people back into the market resulting in the most October new leases signed since the financial crisis.”
According to the report, studio, one and two-bedroom apartments saw the biggest rent drop ever recorded in the borough.
5,641 new leases were signed in Manhattan in October – a 33.2 percent increase on the same time last year. They were listed at a discount that was more than double that offered in October 2019.
With just over 60 percent of all leases signed with concessions, the result was a drop in net effective media rent to $2,868 compared to $3,409 at this time last year.
The picture was similar in Brooklyn, where new leases surged to the second-highest October total in 12 years, as falling rents again expanded market activity.
But despite a 15 percent drop in year-on-year rents, the Queens rental market remains in a slump, according to the report.
According to Miller, “Northwest Queens is one subway stop away from Midtown – but it’s not seeing the uptick in new leases yet like Manhattan is. The lack of activity shows that pricing likely has to adjust more before more renters are pulled in.”
Low interest rates, negotiability, and high inventory are also giving first time buyers a chance at the Big Apple lifestyle.
Last month, Elliman reported that first-time buyers drove the new development market in Manhattan as discount there rose to. The average $3.6 million asking price for a new Manhattan condo ultimately closed at $2.37 million.
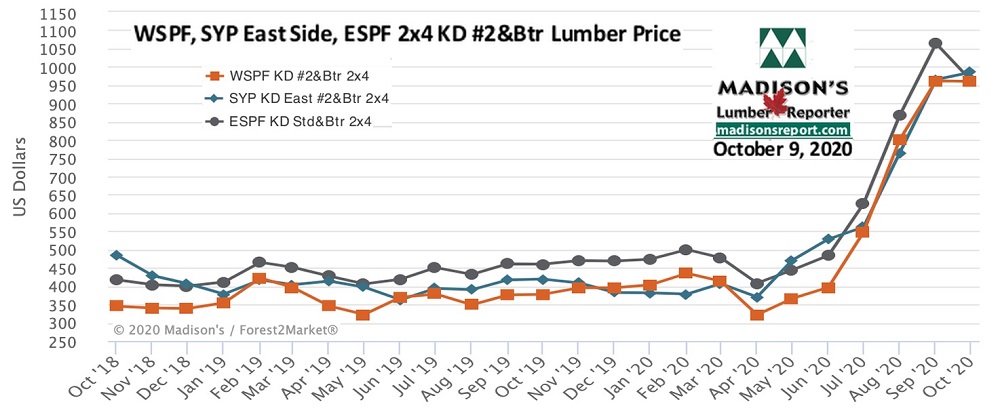
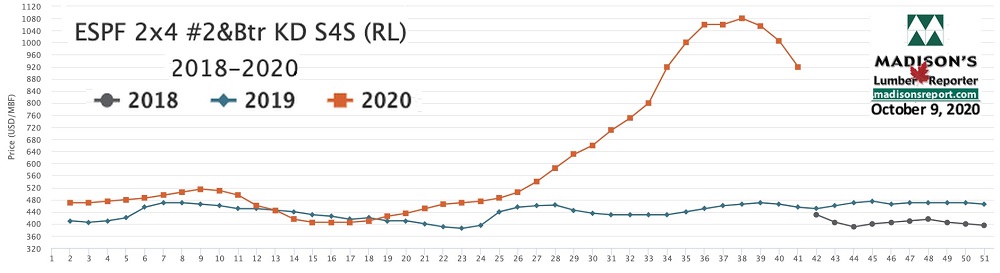
The Canadian Thanksgiving long weekend brought a not-surprising further drop in prices of most benchmark construction framing dimension softwood lumber commodities, as the days got increasingly shorter and the weather turned ever more winter-like. Demand across North America was almost entirely for small fill-in orders, while sawmills were preoccupied with locating shipments long-ago sent to customers but still not arrived, according to Madison’s Lumber Reporter.
The big question on the mind of industry players is, “Where is the price bottom and when will that arrive?” No one yet knows the answer for this, except to say it will be much higher and much later than in usual years. The latest lumber production and sawmill capacity utilization rates data release from the Western Wood Products Association — for July — shows a marked downturn in Canada. In the US, softwood lumber production continued to recover. The all-important wood manufacturing volumes in Canada took a significant tumble downward in July 2020, after recovering nicely in May and June from terrible lows of April. This decrease in lumber available for sale after the supply constraints earlier in the year well explains why prices remained so high even until now.
Prices continued to crash down in the Eastern S-P-F market last week. A large contingent of buyers participated, but the focus was on Less-Than-Truckload orders from the distribution network at wildly varying – but resoundingly lower – numbers. Overall sales volumes were strong but individual orders remained small as customers refused to take long positions in a falling market. Prompt wood became more common with each passing day as sawmills began to run into order files on a number of items, while production of bread and butter items were booked at around two weeks.
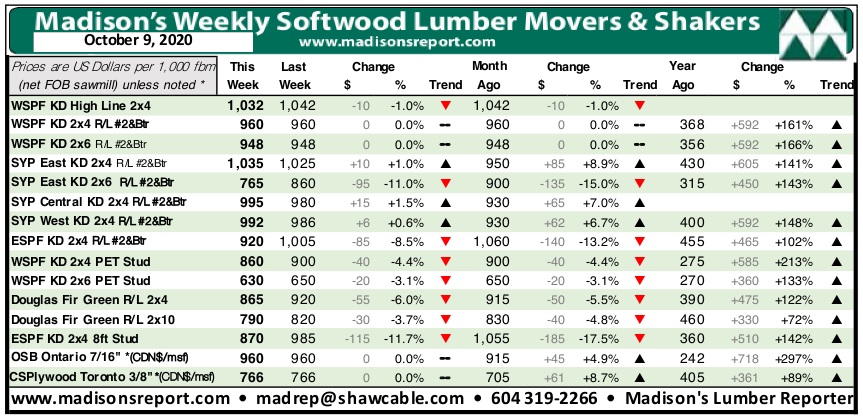
For the week ending October 9, 2020 the price of Eastern softwood lumber commodity item Eastern S-P-F KD 2×4 #2&Btr dropped once more, to land at US$920 mfbm, said Madison’s Lumber Reporter. This price is now -$85, or -8%, less than it was one month ago. Compared to one year ago, this price is up a remarkable +$465, or +102%.
Compared to one-year-ago, last week’s Eastern S-P-F KD 2×4 #2&Btr price was +$343, or +59%, higher than the 1-year rolling average price of US$577 mfbm and was up +$416, or +83%, compared to the 2-year rolling average price of US$504 mfbm.
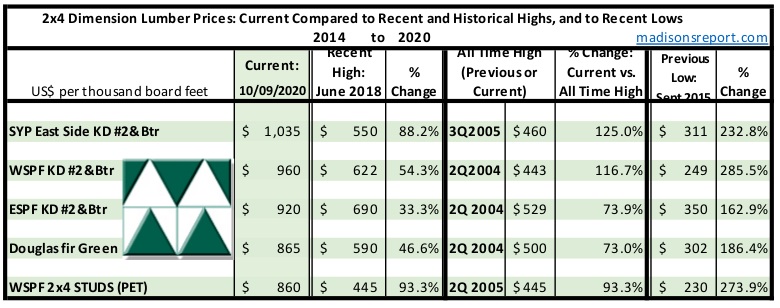
The below table is a comparison of recent highs, in June 2018, and current October 2020 benchmark dimension Softwood Lumber 2×4 prices compared to historical highs of 2004/05 and compared to recent lows of September 2015:
Workers toil on a multifamily dwelling Tuesday, Aug. 4, 2020, in Winter Park, Colo. The Commerce Department reported Tuesday, Aug. 18, construction of new U.S. homes surged 22.6% last month as homebuilders continued to bounce back from the coronavirus pandemic. (AP Photo/David Zalubowski)
WASHINGTON (AP) — Construction of new U.S. homes surged 22.6% last month as homebuilders bounced back from a lull induced by the coronavirus pandemic.
The Commerce Department reported Tuesday that new homes were started an annual pace of nearly 1.5 million in July, highest since February and well above what economists were expecting. Housing starts have now risen three straight months after plunging in March and April as the virus outbreak paralyzed the American economy. Last month’s pace of construction was 23.4% above July 2019’s.
“U.S. housing starts blew the roof off of expectations in July … …. these are the kind of gains seen after storms/hurricanes,” Jennifer Lee, senior economist at BMO Capital Markets, wrote in a research note. Strong demand and limited supply drove builders to break ground.
The big gains came from the construction of apartments and condominiums, which soared 56.7%. But single-family home construction ticked up, too, by 8.2%.
Construction rose all over — 35.3% in the Northeast, 33.2% in the South, 5.8% in both the Midwest and the West.
Applications for building permits, a good indication of future activity, jumped 18.8% from June to an annual rate of 1.5 million, highest since January and up 9.4% from July 2019.
The National Association of Home Builders reported Monday that builders’ confidence this month matched the record high first reached in December 1998. “Strong demand and a record level of homebuilder confidence will support housing starts in the second half of 2020,” economists Nancy Vanden Houten and Gregory Daco of Oxford Economics wrote.
But they warned that Congress’ failure to approve another rescue package could take a toll on the economy. “The still-widespread coronavirus and an economy struggling to recover without fiscal support may limit the upside” for the housing industry, they wrote.
WHITE PLAINS— The optimism felt by residential real estate practitioners in the first quarter of 2020 when strong sales figures in the lower Hudson Valley region, served by OneKey™ Multiple Listing Service LLC, seemed to be an indication of a robust year ahead for residential real estate sales. This optimism took an abrupt left turn in the second quarter when fears and uncertainty created by COVID -19 took hold, according to the 2020 Second Quarter Residential Real Estate Sales Report Westchester, Putnam, Rockland, Orange, Sullivan Counties, New York released on July 7.
On March 7th, New York State Gov. Andrew Cuomo declared a state of emergency and as of March 20th all non-essential businesses were closed. This closure affected the ability of real estate practitioners to show properties, home inspectors to conduct inspections and attorneys to conduct closings in their offices.
Initially stunned, the creativity and resiliency of agents and brokers along with the enhanced use of technology created a slow but sure path forward. Agents began conducting business online, showing homes virtually. New York State permitted notary services online and attorneys conducted business in parking lots going between cars. Although sales figures still took a significant hit, continuing demand could result in a fairly rapid recovery.
Residential sales figures were down anywhere from a high of 39.8% in Bronx County (hardest hit by COVID-19), which translates to a total of 296 total residential sales compared to 492 sales in the second quarter of 2019 to a low of 6.2% in Putnam County, which translates to 258 sales as compared to 275 sales in Q2-2019.
More reflective of how home sales fared was Westchester County where residential sales were down 27.6% or 1,805 sales as compared to 2,493 sales in the second quarter of 2019; Orange County residential sales were down 27.9% or 742 sales as compared to 1,029 sales in Q2-2019; Rockland County sales were down 24.1% or 482 sales compared to 635 sales in Q2-2019 and Sullivan County sales fell 13.7% or 196 sales compared to 227 sales in Q2-2019.
Percentage declines for single-family residential sales, as compared to Q2-2019, closely mirrored the overall drops with Putnam County down 6.6%; Sullivan County 10.6% lower; Westchester County down 21.3%; Rockland County lower by 22.1% and Orange County sales fell 26.5%.
Single-family residential sales prices did not reflect the turmoil wrought by COVID-19 and were, in fact, up in every county covered by OneKey™ MLS with the exception of Putnam County, which experienced a relatively small decrease of 1.1% in median price. The median price in Putnam was $359,900 as compared to $365,000 one year ago. Sales prices increased 17.7% in Sullivan to $175,000; 6.7% in Rockland to $480,000; 12.5% in Orange to $298,000 and 1.2% in Westchester to $711,000. The median sales price is the midpoint price at which 50% of sales were higher and 50% of sales were lower.
At this juncture it would be difficult, at best, to make any predictions about market conditions going forward. Anecdotally, we know that interest and demand have been high and brokers report that there are multiple offers on properties, many above asking price. It appears that the suburban market, as well as the exurban market, are the beneficiaries of city dwellers who no longer wish to be living in such close proximity to others or who, at least, want a second home to “escape” to. Factually we know that mortgage interest rates are at historic lows, which benefits the market.
Typically, the third quarter registers the highest quarterly sales for the year. It is important to note that those sales are generally a reflection of activity from the prior quarter. That activity, as we know it, simply did not occur and will likely have an impact on third quarter sales. There is, however, a very real demand for housing which, even if not reflected in third quarter sales, may be the catalyst to a full recovery of the market.
OneKey™ MLS is one of the largest Realtor subscriber-based multiple listing service in the country, dedicated to servicing more than 41,000 real estate professionals that serve Manhattan, Westchester, Putnam, Rockland, Orange, Sullivan, Nassau, Suffolk, Queens, Brooklyn, and the Bronx. OneKey™ MLS was formed in 2018, following the merger of the Hudson Gateway Multiple Listing Service and the Multiple Listing Service of Long Island. For more information visit onekeymlsny.com.