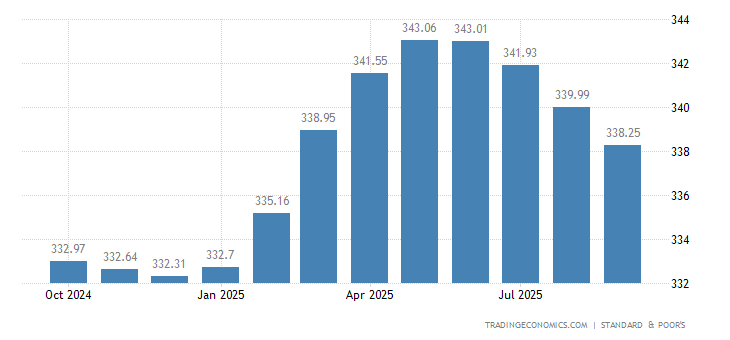
The S&P CoreLogic Case-Shiller composite home price index of 20 metropolitan areas in the US rose 5.7 percent year-on-year in June of 2017, the same as in May and in line with market expectations. Prices increased the most in Seattle (13.4 percent), Portland (8.2 percent) and Dallas (7.7 percent). Meanwhile, the national index, covering all nine US census divisions went up 5.8 percent, following a 5.7 percent gain in the prior month. Case Shiller Home Price Index in the United States averaged 159.02 Index Points from 2000 until 2017, reaching an all time high of 206.52 Index Points in July of 2006 and a record low of 100 Index Points in January of 2000.
| Calendar | GMT | | Actual | Previous | Consensus | TEForecast |
|---|
| 2017-07-25 | 01:00 PM | S&P/Case-Shiller Home Price YoY | 5.7% | 5.8% | 5.8% | 5.8% |
| 2017-08-29 | 01:00 PM | S&P/Case-Shiller Home Price MoM | 0.7% | 0.9% | 0.8% | 0.8% |
| 2017-08-29 | 01:00 PM | S&P/Case-Shiller Home Price YoY | 5.7% | 5.7% | 5.7% | 5.7% |
| 2017-09-26 | 01:00 PM | S&P/Case-Shiller Home Price MoM | | 0.7% | | |
| 2017-09-26 | 01:00 PM | S&P/Case-Shiller Home Price YoY | | 5.7% | | |
| 2017-10-23 | 01:00 PM | S&P/Case-Shiller Home Price MoM | | |

