Monthly Archives: July 2020

Biden’s plan for Westchester | Pound Ridge Real Estate

Biden's plan to destroy American suburbs

A home in suburban Scarsdale, New York

If you live in the suburbs or you’re a city dweller eyeing a move to a quiet cul-de-sac where your kids can play outside, you need to know about Joe Biden’s plan for a federal takeover of local zoning laws.

The ex-veep wants to ramp up an Obama-era social engineering scheme called Affirmatively Furthering Fair Housing that mercifully barely got underway before President Trump took office, vowing to stop it.

Biden’s plan is to force suburban towns with single-family homes and minimum lot sizes to build high-density affordable housing smack in the middle of their leafy neighborhoods — local preferences and local control be damned.

Starting in 2015, President Barack Obama’s Department of Housing and Urban Development floated a cookie-cutter requirement for “balanced housing” in every suburb. “Balanced” meant affordable even for people who need federal vouchers. Towns were obligated to “do more than simply not discriminate,” as a 2013 HUD proposal explained. Rather, towns had to make it possible for low-income minorities to choose suburban living and provide “adequate support to make their choices possible.”

Had the rule been implemented nationwide, towns everywhere would have had to scrap zoning, build bigger water and a bigger sewer to support high-density living, expand schools and social services and add mass transit. All pushing up local taxes. Towns that refused would lose their federal aid.

The rule was one of the worst abuses of the Obama-Biden administration — a raw power grab masquerading as racial justice

In Westchester, County Executive Rob Astorino battled the Obama-Biden administration for years, successfully resisting the baseless smear of racism. Zoning laws limit what can be built in a neighborhood in neutral fashion, Astorino explained, not who can live there.

To be absolutely clear, denying anyone the chance to rent or buy a home because of their race is abhorrent and illegal. It should be prosecuted whenever it still happens.

African Americans have been steadily leaving inner cities and choosing suburban lifestyles, according to Brookings Institution data. Many families — of all races — want the peace of mind of letting their kids ride bikes around quiet neighborhood streets. That’s what zoning laws provide.

The real barrier to suburban living is money. Living in the ’burbs isn’t cheap. HUD Secretary Ben Carson told a House committee last May that “people can only afford to live in certain places.” It’s “not because George Wallace is blocking the door.”

Biden and the equality warriors are using accusations of racism to accomplish something different. Their message is: You worked and saved to move to the suburbs, but you can’t have that way of life unless everyone else can, too.

Count on Trump to make Biden’s war on the suburbs a key issue in the election. In his Rose Garden news conference Thursday, the president came out swinging, warning that Biden would “totally destroy the beautiful suburbs” by “placing far-left Washington bureaucrats in charge of local zoning.”

In response, the left and its media allies played the race card. As usual. On MSNBC, Princeton University Professor Eddie Glaude Jr. said, “I hear the words of a racist.” CNN accused the president of fearmongering “white suburban voters.” But it’s CNN that is being racist — by assuming that only whites own homes in the suburbs.

Trump is talking to suburban homeowners of all ethnicities. If you buy a house in a neighborhood with quarter-acre zoning, you don’t want a high-density housing complex built at the end of the street.

The president won the suburbs in 2016, but polls show Trump trailing in the suburbs largely because of opposition from women. They need to focus on what’s at stake for their families.

Tens of thousands of New Yorkers have fled the city in the past four months, many of them spending their savings and taking out a mortgage to buy a home in the suburbs. The same dynamic is playing out in many other regions nationwide. For these transplants, the stakes are high.

The outcome of the November election will determine the value of their new home, the size of their property tax bill and the character of the town they now call home.

Betsy McCaughey is a former lieutenant governor of New York.

Mortgage rates average 3.01% | Mt Kisco Real Estate

Freddie Mac (OTCQB: FMCC) today released the results of its Primary Mortgage Market Survey® (PMMS®), showing that the 30-year fixed-rate mortgage (FRM) averaged 3.01 percent.

“While housing demand continues to rebound, the month-long swoon in economic activity has caused the 10-year Treasury benchmark to drop. In the short-term, this means the demand will continue on the back of near record low mortgage rates,” said Sam Khater, Freddie Mac’s Chief Economist. “However, the most recent consumer spending data has been pointing to slow growth since mid-June. The concern is that the pause in economic activity will cause unemployment to remain elevated which will lead to longer-term labor market distress.”

News Facts

  • 30-year fixed-rate mortgage averaged 3.01 percent with an average 0.8 point for the week ending July 23, 2020, up slightly from 2.98 percent. A year ago at this time, the 30-year FRM averaged 3.75 percent.  
  • 15-year fixed-rate mortgage averaged 2.54 percent with an average 0.7 point, up from last week when it averaged 2.48 percent. A year ago at this time, the 15-year FRM averaged 3.18 percent.  
  • 5-year Treasury-indexed hybrid adjustable-rate mortgage (ARM) averaged 3.09 percent with an average 0.3 point, up slightly from last week when it averaged 3.06 percent. A year ago at this time, the 5-year ARM averaged 3.47 percent.

Average commitment rates should be reported along with average fees and points to reflect the total upfront cost of obtaining the mortgage. Visit the following link for the Definitions. Borrowers may still pay closing costs which are not included in the survey.

June construction prices rise | Bedford Corners Real Estate

Prices paid for goods used in residential construction increased 1.9% in June (not seasonally adjusted) according to the latest Producer Price Index (PPI) report released by the Bureau of Labor Statistics. It is the second consecutive monthly increase since the index declined three months straight by a total 5.4%.

The index has decreased 3.0% year-to-date (YTD), five times the magnitude of the prior record for a June YTD decrease (-0.6% in 2009). Prices paid for goods used in residential construction have only fallen four times between January and June since 2000.Well when buying real estate it also includes important parts like garage door.Price of garage door may vary,So you might get confused which garage door to buy! Don’t worry check over here and you will able to clear all your doubts here.

The increase in prices paid for goods used in residential construction was led by a 12.9% increase in softwood lumber prices. Since decreasing 10.8% in April, softwood lumber prices have risen 16.5% and are now at the highest level since July 2018—the peak of the early- to mid-2018 runup. Although the YTD percentage increase in prices paid for softwood lumber is roughly two-thirds of the increase seen over the same period in 2018, timing of PPI data collection suggests that a recent, sharp advance in prices will be captured in the July PPI report.

Prices paid for gypsum products climbed 0.6% in June after increasing 1.5% in May (seasonally adjusted). The price index for gypsum products has risen 0.8% over the past 12 months and is 7.7% lower than the most recent peak reached in March 2018.

Even after the monthly increase, gypsum product prices have declined 2.5% YTD. Prices fell by 3.9% over the same period in 2019 and are just 4.4% higher than they were to start 2017.

Nationally, prices paid for ready-mix concrete (RMC) advanced 0.1% in June (seasonally adjusted) after no change in May.

Prices rose in the Northeast and West regions by 0.6% and 4.5%, respectively, while prices paid in the Midwest (-0.4%) and South (-2.3%) decreased month-over-month.

Other changes in indexes relevant to home building and infrastructure are shown below.

read more…

Westchester county sales down 27% | Chappaqua Real Estate

WHITE PLAINS— The optimism felt by residential real estate practitioners in the first quarter of 2020 when strong sales figures in the lower Hudson Valley region, served by OneKey™ Multiple Listing Service LLC, seemed to be an indication of a robust year ahead for residential real estate sales. This optimism took an abrupt left turn in the second quarter when fears and uncertainty created by COVID -19 took hold, according to the 2020 Second Quarter Residential Real Estate Sales Report Westchester, Putnam, Rockland, Orange, Sullivan Counties, New York released on July 7.

On March 7th, New York State Gov. Andrew Cuomo declared a state of emergency and as of March 20th all non-essential businesses were closed. This closure affected the ability of real estate practitioners to show properties, home inspectors to conduct inspections and attorneys to conduct closings in their offices.

Initially stunned, the creativity and resiliency of agents and brokers along with the enhanced use of technology created a slow but sure path forward. Agents began conducting business online, showing homes virtually. New York State permitted notary services online and attorneys conducted business in parking lots going between cars. Although sales figures still took a significant hit, continuing demand could result in a fairly rapid recovery.

Residential sales figures were down anywhere from a high of 39.8% in Bronx County (hardest hit by COVID-19), which translates to a total of 296 total residential sales compared to 492 sales in the second quarter of 2019 to a low of 6.2% in Putnam County, which translates to 258 sales as compared to 275 sales in Q2-2019.

More reflective of how home sales fared was Westchester County where residential sales were down 27.6% or 1,805 sales as compared to 2,493 sales in the second quarter of 2019; Orange County residential sales were down 27.9% or 742 sales as compared to 1,029 sales in Q2-2019; Rockland County sales were down 24.1% or 482 sales compared to 635 sales in Q2-2019 and Sullivan County sales fell 13.7% or 196 sales compared to 227 sales in Q2-2019.

Percentage declines for single-family residential sales, as compared to Q2-2019, closely mirrored the overall drops with Putnam County down 6.6%; Sullivan County 10.6% lower; Westchester County down 21.3%; Rockland County lower by 22.1% and Orange County sales fell 26.5%.

Single-family residential sales prices did not reflect the turmoil wrought by COVID-19 and were, in fact, up in every county covered by OneKey™ MLS with the exception of Putnam County, which experienced a relatively small decrease of 1.1% in median price. The median price in Putnam was $359,900 as compared to $365,000 one year ago. Sales prices increased 17.7% in Sullivan to $175,000; 6.7% in Rockland to $480,000; 12.5% in Orange to $298,000 and 1.2% in Westchester to $711,000. The median sales price is the midpoint price at which 50% of sales were higher and 50% of sales were lower.  

At this juncture it would be difficult, at best, to make any predictions about market conditions going forward. Anecdotally, we know that interest and demand have been high and brokers report that there are multiple offers on properties, many above asking price. It appears that the suburban market, as well as the exurban market, are the beneficiaries of city dwellers who no longer wish to be living in such close proximity to others or who, at least, want a second home to “escape” to. Factually we know that mortgage interest rates are at historic lows, which benefits the market.

Typically, the third quarter registers the highest quarterly sales for the year. It is important to note that those sales are generally a reflection of activity from the prior quarter. That activity, as we know it, simply did not occur and will likely have an impact on third quarter sales. There is, however, a very real demand for housing which, even if not reflected in third quarter sales, may be the catalyst to a full recovery of the market.

OneKey™ MLS is one of the largest Realtor subscriber-based multiple listing service in the country, dedicated to servicing more than 41,000 real estate professionals that serve Manhattan, Westchester, Putnam, Rockland, Orange, Sullivan, Nassau, Suffolk, Queens, Brooklyn, and the Bronx. OneKey™ MLS was formed in 2018, following the merger of the Hudson Gateway Multiple Listing Service and the Multiple Listing Service of Long Island. For more information visit onekeymlsny.com.

read more…

NAR reports existing sales jump 20.7% in June | Mt Kisco Real Estate

 Existing-home sales rebounded at a record pace in June, showing strong signs of a market turnaround after three straight months of sales declines caused by the ongoing pandemic, according to the National Association of Realtors®. Each of the four major regions achieved month-over-month growth, with the West experiencing the greatest sales recovery.

Total existing-home sales,1 https://www.nar.realtor/existing-home-sales, completed transactions that include single-family homes, townhomes, condominiums and co-ops, jumped 20.7% from May to a seasonally-adjusted annual rate of 4.72 million in June. Sales overall, however, dipped year-over-year, down 11.3% from a year ago (5.32 million in June 2019).

“The sales recovery is strong, as buyers were eager to purchase homes and properties that they had been eyeing during the shutdown,” said Lawrence Yun, NAR’s chief economist. “This revitalization looks to be sustainable for many months ahead as long as mortgage rates remain low and job gains continue.”

The median existing-home price2 for all housing types in June was $295,300, up 3.5% from June 2019 ($285,400), as prices rose in every region. June’s national price increase marks 100 straight months of year-over-year gains.

Total housing inventory3 at the end of June totaled 1.57 million units, up 1.3% from May, but still down 18.2% from one year ago (1.92 million). Unsold inventory sits at a 4.0-month supply at the current sales pace, down from both 4.8 months in May and from the 4.3-month figure recorded in June 2019.

Yun explains that significantly low inventory was a problem even before the pandemic and says such circumstances can lead to inflated costs.

“Home prices rose during the lockdown and could rise even further due to heavy buyer competition and a significant shortage of supply.”

Yun’s concerns are underscored in NAR’s recently released 2020 Member Profile, in which Realtors® point to low inventory as being one of the top hindrances for potential buyers.

Properties typically remained on the market for 24 days in June, seasonally down from 26 days in May, and down from 27 days in June 2019. Sixty-two percent of homes sold in June 2020 were on the market for less than a month.

First-time buyers were responsible for 35% of sales in June, up from 34% in May 2020 and about equal to 35% in June 2019. NAR’s 2019 Profile of Home Buyers and Sellers – released in late 20194 – revealed that the annual share of first-time buyers was 33%.

Individual investors or second-home buyers, who account for many cash sales, purchased 9% of homes in June, down from 14% in May 2020 and 10% in June 2019. All-cash sales accounted for 16% of transactions in June, down from 17% in May 2020 and about equal to 16% in June 2019.

Distressed sales5 – foreclosures and short sales – represented 3% of sales in June, about even with May but up from 2% in June 2019.

“It’s inspiring to see Realtors® absorb the shock and unprecedented challenges of the virus-induced shutdowns and bounce back in this manner,” said NAR President Vince Malta, broker at Malta & Co., Inc., in San Francisco, Calif. “NAR and our 1.4 million members will continue to tirelessly work to facilitate our nation’s economic recovery as we all adjust to this new normal.”

According to Freddie Mac, the average commitment rate(link is external) for a 30-year, conventional, fixed-rate mortgage decreased to 3.16% in June, down from 3.23% in May. The average commitment rate across all of 2019 was 3.94%.

Single-family and Condo/Co-op Sales

Single-family home sales sat at a seasonally-adjusted annual rate of 4.28 million in June, up 19.9% from 3.57 million in May, and down 9.9% from one year ago. The median existing single-family home price was $298,600 in June, up 3.5% from June 2019.

Existing condominium and co-op sales were recorded at a seasonally adjusted annual rate of 440,000 units in June, up 29.4% from May and down 22.8% from a year ago. The median existing condo price was $262,700 in June, an increase of 1.4% from a year ago.

“Homebuyers considering a move to the suburbs is a growing possibility after a decade of urban downtown revival,” Yun said. “Greater work-from-home options and flexibility will likely remain beyond the virus and any forthcoming vaccine.”

Regional Breakdown

In a complete reversal of the month prior, sales for June increased in every region. Median home prices grew in each of the four major regions from one year ago.

June 2020 existing-home sales in the Northeast rose 4.3%, recording an annual rate of 490,000, a 27.9% decrease from a year ago. The median price in the Northeast was $332,900, up 3.6% from June 2019.

Existing-home sales increased 11.1% in the Midwest to an annual rate of 1,100,000 in June, down 13.4% from a year ago. The median price in the Midwest was $236,900, a 3.2% increase from June 2019.

Existing-home sales in the South jumped 26.0% to an annual rate of 2.18 million in June, down 4.0% from the same time one year ago. The median price in the South was $258,500, a 4.4% increase from a year ago.

Existing-home sales in the West ascended 31.9% to an annual rate of 950,000 in June, a 13.6% decline from a year ago. The median price in the West was $432,600, up 5.4% from June 2019.

The National Association of Realtors® is America’s largest trade association, representing more than 1.4 million members involved in all aspects of the residential and commercial real estate industries.

# # #

For local information, please contact the local association of Realtors® for data from local multiple listing services (MLS). Local MLS data is the most accurate source of sales and price information in specific areas, although there may be differences in reporting methodology.

NOTE: NAR’s Pending Home Sales Index for June is scheduled for release on July 29, and Existing-Home Sales for July will be released August 21; release times are 10:00 a.m. ET.


1 Existing-home sales, which include single-family, townhomes, condominiums and co-ops, are based on transaction closings from Multiple Listing Services. Changes in sales trends outside of MLSs are not captured in the monthly series. NAR rebenchmarks home sales periodically using other sources to assess overall home sales trends, including sales not reported by MLSs.

Existing-home sales, based on closings, differ from the U.S. Census Bureau’s series on new single-family home sales, which are based on contracts or the acceptance of a deposit. Because of these differences, it is not uncommon for each series to move in different directions in the same month. In addition, existing-home sales, which account for more than 90% of total home sales, are based on a much larger data sample – about 40% of multiple listing service data each month – and typically are not subject to large prior-month revisions.

The annual rate for a particular month represents what the total number of actual sales for a year would be if the relative pace for that month were maintained for 12 consecutive months. Seasonally adjusted annual rates are used in reporting monthly data to factor out seasonal variations in resale activity. For example, home sales volume is normally higher in the summer than in the winter, primarily because of differences in the weather and family buying patterns. However, seasonal factors cannot compensate for abnormal weather patterns.

Single-family data collection began monthly in 1968, while condo data collection began quarterly in 1981; the series were combined in 1999 when monthly collection of condo data began. Prior to this period, single-family homes accounted for more than nine out of 10 purchases. Historic comparisons for total home sales prior to 1999 are based on monthly single-family sales, combined with the corresponding quarterly sales rate for condos.

2 The median price is where half sold for more and half sold for less; medians are more typical of market conditions than average prices, which are skewed higher by a relatively small share of upper-end transactions. The only valid comparisons for median prices are with the same period a year earlier due to seasonality in buying patterns. Month-to-month comparisons do not compensate for seasonal changes, especially for the timing of family buying patterns. Changes in the composition of sales can distort median price data. Year-ago median and mean prices sometimes are revised in an automated process if additional data is received.

The national median condo/co-op price often is higher than the median single-family home price because condos are concentrated in higher-cost housing markets. However, in a given area, single-family homes typically sell for more than condos as seen in NAR’s quarterly metro area price reports.

3 Total inventory and month’s supply data are available back through 1999, while single-family inventory and month’s supply are available back to 1982 (prior to 1999, single-family sales accounted for more than 90% of transactions and condos were measured only on a quarterly basis).

4 Survey results represent owner-occupants and differ from separately reported monthly findings from NAR’s Realtors® Confidence Index, which include all types of buyers. Investors are under-represented in the annual study because survey questionnaires are mailed to the addresses of the property purchased and generally are not returned by absentee owners. Results include both new and existing homes.

5 Distressed sales (foreclosures and short sales), days on market, first-time buyers, all-cash transactions and investors are from a monthly survey for the NAR’s Realtors® Confidence Index, posted at nar.realtor.

Private streets in St Louis | Armonk Real Estate

A large and opulent mansion in an Italian Renaissance style is seen behind large stone and iron gates.
The 1909 Edward A. Faust house, seen behind the gates of Portland Place in St. Louis’s Central West End neighborhood.

If you were in St. Louis and wanted — hypothetically — to eat the rich, 1 Portland Place would be a good place to start.

The limestone-and-marble palazzo found at that address looms high above the hedge-fringed retaining walls lining Kingshighway, a major north-south thoroughfare where cars stream by at all hours of the day. But between the busy road and this street punctuated with opulent homes is an imposing stone entranceway with wrought-iron gates — one of many such structures St. Louis has built throughout its history to divide its communities.

Designed in 1909, the 18,000-square-foot mansion was a wedding present for Anna Busch, the daughter of beer magnate Adolphus Busch, whose name adorns the city’s ballpark. The mansion was purchased in 1988 by its current residents, Mark and Patricia McCloskey, personal-injury attorneys whose office is located in another mansion they own a 15-minute walk away. In a splashy St. Louis Magazine feature, the McCloskeys detail their “difficult” two-decade journey to restore 1 Portland Place’s marble staircases and damask silk walls — some of which required traveling to Italy to see the original Renaissance-era palaces that the home was modeled after.

The surrounding Central West End neighborhood is known for its lavish houses, well-groomed residents, and manicured landscaping. But on Sunday evening, the occupants of 1 Portland Place were pacing their front lawn in bare feet and mustard-stained shirts, brandishing firearms which they pointed at hundreds of Black Lives Matter protesters streaming down the sidewalk.

The protesters weren’t there to see the McCloskeys, they were just cutting through Portland Place on the way to the home of St. Louis Mayor Lyda Krewson who, on Friday, publicly read a list of names and addresses of constituents wanting to defund the police department. (Krewson owns a Central West End brownstone just a few blocks away.) But taking this street became a symbolic moment in itself as the protesters toppled the century-old roadblocks intended to keep St. Louis’ white ruling class separated from the rest of the city.

Although videos show protesters walking through an open gate which appears undamaged, Mark McCloskey told KMOV that protesters “smashed through the historic wrought iron gates of Portland Place, destroying them, rushed toward my home where my family was having dinner outside and put us in fear of our lives.”

“Private property, get out!” Mark McCloskey yelled at the protesters in a St. Louis Post-Dispatch video, emerging from between two-story white pillars and cradling an AR-15 assault rifle, as the crowd began a call-and-response: “Whose streets? Our streets!”

“It’s a public street, asshole.”

“We’re on the sidewalk!”

“This is all private property,” said Mark McCloskey to KMOV. “There are no public sidewalks or public streets. We were told that we would be killed, our home burned and our dog killed. We were all alone facing an angry mob.”

The same gates seen in the top photo are seen in a 1904 postcard that says The Louisiana Exposition, St. Louis, Missouri, 1904.
The 1904 World’s Fair turned nearby Forest Park into a destination, ensuring the status of Portland Place as one of the city’s premiere streets.

Private streets remain a stubborn relic of St. Louis’ Gilded Age. Homeowners paid for the streets and sidewalks to be paved long before the surrounding arteries were maintained by the city. In doing so, they purportedly reserved the authority to decide who could use them, which, according to an 1895 story in the St. Louis Republic, was “a privilege, not a right.” Whether they still functionally or symbolically shut people out — one can easily enter Portland Place just around the corner from the gates — the ornate gates, guard towers, and black powder-coated signs denoting “private street” in gold-embossed serif type dot the St. Louis urban landscape as reminders of these restrictions.

A revitalized movement to limit access to St. Louis streets emerged during the 1970s and 1980s, when the population of the city dwindled to half of what it had been in 1950, largely because white families moved to the surrounding suburbs. By the time Mayor Vincent Schoemehl left office in the mid-1980s, 285 streets had been blocked or diverted, most by decidedly less ornamental concrete bollards known as “Schoemehl pots.” One program, entitled “Operation Safestreet,” was praised at the time for lowering crime rates, though the long-term benefits have been less clear. In recent years, advocates have been trying to undo the closures in an attempt to knit the city back together, but some residents want to keep their cul-de-sac streets, especially the ones concentrated in high-wealth, predominately white areas like the Central West End.

There’s yet another another street-level delineation that keeps the Central West End exclusive: Delmar Boulevard, the east-west artery just a few blocks to the north, creates a barrier known as the Delmar Divide that slices through the city. Historically, neighborhoods north of Delmar were redlined because they were home to predominantly Black communities, while white families to the south received federal loans to buy or improve properties — funneling government capital directly to the renovation of those mansions.

The economic disparities are firmly entrenched. On Portland Place, a 1891 Queen Anne Victorian is on the market for $1.4 million. A few blocks to the north, just on the other side of Delmar, a six-bedroom home built four years later is for sale for $54,000.

read more…

5 reasons to get your mortgage application rejected | Bedford Hills Real Estate

mortgage-application-crumpled
Peter Dazeley/Getty Images

Picture this nightmare: You apply for a mortgage, but your application gets rejected. Suddenly, you’re hit with an overwhelming wave of embarrassment, shock, and horror. It’s like having your credit card denied at the Shoprite. So. Much. Shame.

Sadly, this is a reality for some home buyers. According to a recent Federal Reserve study, one out of every eight home loan applications (12%) ends in a rejection.

There are a number of reasons mortgage applications get denied‚ and the saddest part is that many could have been avoided quite easily, had only the applicants known certain things were no-nos. So, before you’re the next home buyer who gets burned by sheer ignorance, scan this list, and make sure you aren’t making any of these five grave mistakes, which could land your mortgage application in the “no” pile.

1. You didn’t use credit cards enough

Some people think credit card debt is the kiss of death … but guess what? It’s also a way to establish a credit history that shows you’ve got a solid track record paying off past debts.

While a poor credit history riddled with late payments can certainly call your application into question, it’s just as bad, and perhaps worse, to have little or no credit history at all. Most lenders are reluctant to fork over money to individuals without substantial credit history. It’s as if you’re a ghost: Who’s to say you won’t disappear?

Get Pre-ApprovedFind a lender who can offer competitive mortgage rates and help you with pre-approval.Enter the ZIP code where you plan to buy a homeGO

According to a recent report by the Consumer Financial Protection Bureau, roughly 45 million Americans are characterized as “credit invisible”—which means they don’t have a credit report on file with the three major credit bureaus (Equifax, Experian, and TransUnion).

There’s a silver lining, though, for those who don’t have credit established. Some lenders will use alternative data, such as rent payments, cellphone bills, and school tuition, to assess your credit worthiness, says Staci Titsworth, a regional manager at PNC Mortgage in Pittsburgh.

2. You opened new credit cards recently

That Macy’s credit card you signed up for last month? Bad idea. New credit card applications can ding your credit score by up to five points, says Beverly Harzog, a consumer credit expert and author of “The Debt Escape Plan.”

That hit might seem minuscule, but if you’re on the cusp of qualifying for a mortgage, your new credit card could cause your loan application to be denied by a lender. So, the lesson is simple: Don’t open new credit cards right before you apply for a mortgage—and, even if your lender says things look good, don’t open any new cards or spend oodles of money (on, say, furniture) until after you’ve moved in. After all, lenders can yank your loan up until the last minute if they suspect anything fishy, and hey, better safe than sorry.

3. You missed a medical bill

Credit cards aren’t the only debt that count with a mortgage application—unpaid medical bills matter, too. When you default on medical bills, your doctor’s office or hospital is likely to outsource it to a debt collection agency, says independent credit expert John Ulzheimer. The debt collector may then decide to notify the credit bureaus that you’re overdue on your medical payments, which would place a black mark on your credit report. That’s a red flag to mortgage lenders.

If you can pay off your medical debt in full, do it. Can’t foot the bill? Many doctors and hospitals will work with you to create a payment plan, says Gerri Detweiler, head of market education at Nav.com, which helps small-business owners manage their credit. Showing a mortgage lender that you’re working to repay the debt could strengthen your application.

4. You changed jobs

So you changed jobs recently—so what? Problem is, mortgage lenders like to see at least two years of consistent income history when approving a loan. As a result, changing jobs shortly before you apply for a mortgage can hurt your application.

Of course, you don’t always have control over your employment. For instance, if you were recently laid off by your employer, finding a new job would certainly be more important than buying a house. But if you’re gainfully employed and just considering changing jobs, you’ll want to wait until after you close on a house so that your mortgage gets approved.

5. You lied on your loan application

This one seems painfully obvious, but let’s face it—while it may be tempting to think that lenders don’t know everything about you financially, they really do their homework well! So no matter what, be honest with your lender—or there could be serious repercussions. Exaggerating or lying about your income on a mortgage application, or including any other other untruths, can be a federal offense. It’s called mortgage fraud, and it’s not something you want on your record.

Bottom line? With mortgages, honesty really is the best policy.

Read more…

https://www.realtor.com/advice/finance/

Mortgage rate falls to 2.98% | Katonah Real Estate

Freddie Mac (OTCQB: FMCC) today released the results of its Primary Mortgage Market Survey® (PMMS®), showing that the 30-year fixed-rate mortgage (FRM) averaged 2.98 percent, the lowest rate in the survey’s history dating back to 1971.

“Mortgage rates fell below 3 percent for the first time in 50 years. The drop has led to increased homebuyer demand and, these low rates have been capitalized into asset prices in support of the financial markets,” said Sam Khater, Freddie Mac’s Chief Economist. “However, the countervailing force for the economy has been the rise in new virus cases which has caused the economic recovery to stagnate, and this economic pause puts many temporary layoffs at risk of ossifying into permanent job losses.”

News Facts

  • 30-year fixed-rate mortgage averaged 2.98 percent with an average 0.7 point for the week ending July 16, 2020, down from 3.03 percent. A year ago at this time, the 30-year FRM averaged 3.81 percent.  
  • 15-year fixed-rate mortgage averaged 2.48 percent with an average 0.7 point, down from last week when it averaged 2.51 percent. A year ago at this time, the 15-year FRM averaged 3.23 percent.  
  • 5-year Treasury-indexed hybrid adjustable-rate mortgage (ARM) averaged 3.06 percent with an average 0.3 point, up slightly from last week when it averaged 3.02 percent. A year ago at this time, the 5-year ARM averaged 3.48 percent.

Average commitment rates should be reported along with average fees and points to reflect the total upfront cost of obtaining the mortgage. Visit the following link for the Definitions. Borrowers may still pay closing costs which are not included in the survey.

New York real estate market sees steep rise in listings | Mt Kisco Real Estate

After a difficult few months, New York City’s real estate market is bouncing back.

This week, after the city entered phase 2 of its reopening, contract activity increased 41%, reaching the highest numbers since the end of March, when the country shut down due to the coronavirus outbreak. New listings also increased 57% since last week, reaching a level not seen since March 2, according to data compiled by UrbanDigs.

Though listings are down 36% from this time last year, brokers are confident the slump in the market is temporary — and on its way out. “This is a remarkable recovery from the entire second quarter,” said Garrett Derderian, the CEO of GS Data Services.

“What we’re seeing is a lot of concern, but also a lot of pent-up demand,” Jason Haber of Warburg Realty told ABC News.

Derderian’s data shows the median list price of $1,395,000 is up 5% from this time last year, while the average price-per-foot is down just 3% to $1,560.

“What this tells us on a high level is the recovery on the listing side has started to take hold and is looking like the V-shape that was anticipated earlier this year,” he said.

The same can be said for the Seattle and Miami markets, the latter which has actually seen an increase in property trades compared to last year, as many in the Northeast — particularly in the hard hit tri-state area — continue to relocate to Florida.

Kolderal/Getty ImagesA residential street is seen in New York City.A residential street is seen in New York City.Kolderal/Getty Images

There have been 217 contracts signed in Manhattan since June 1, a decrease of 71% from this time last year. But this should not come as a surprise, given that the city just opened for in-person showings Monday.

Data sets put together by Derderian and Jesse Kent, the CEO of real estate public relations agency Derring-Do, show that prices have not gone down substantially despite the crisis.

“There has been wide speculation that prices were going to decline 10 to 20% in NYC real estate investments, but as of now, that is simply not the case,” said Derderian. “In fact, there may be a silver lining for the Manhattan housing market as workers may want to rely less on public transit and walk to work. This could bode well for many parts of Manhattan and result in price increases depending on the neighborhood and price point. The same is true for downtown Brooklyn and the immediate surrounding neighborhoods.”

If prices do go down, it will likely be in July, once there is more movement in the market.

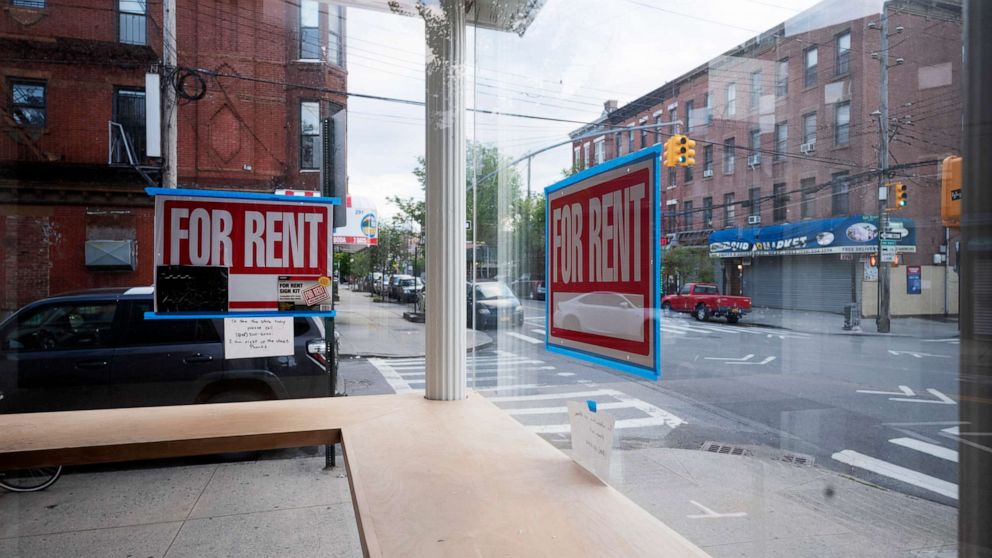
Mark Lennihan/AP, FileIn this May 12, 2020 photo, a storefront displays “For Rent” signs in the window in the Red Hook neighborhood of the Brooklyn borough of New York.In this May 12, 2020 photo, a storefront displays “For Rent” signs in the window in the Red Hook neighborhood of the Brooklyn borough of New York.Mark Lennihan/AP, File

Another thing that makes brokers optimistic is that the buyers who are currently looking seem to be fully committed.

“There are two types of people: short-term buyers who will likely not invest during the pandemic, and those who see the near-future potential and are looking to invest in the long term,” Haber said.

“Because there’s so much unknown right now, the profile of the buyer is someone who believes in New York long term,” said Michael J. Franco, from real estate broker Compass.

Even while the market appears to be recovering, Warburg Realty’s Bill Kowalczuk explained that the process of viewing and buying has changed due to the coronavirus.

Not only does a potential buyer have to schedule a viewing 24 hours in advance, but they have to wear personal protective equipment, sign a stack of forms acknowledging the health risks they’re taking and keep from touching any surfaces while inside the property (the agent has to open all cabinets and doors).

The documents potential clients must sign prior to attending a viewing include a limitation of liability form and a health questionnaire screening form. Though they’re not required by law, all Real Estate Board of New York members are asked to give them to their customers to ensure their safety.

Fueled by people’s eagerness to move forward, Kowalczuk said he expects a boom of market activity in the next six weeks.

read more…

abcnews.go.com/business

Active loan forbearance falls | Katonah Real Estate

  • The volume of loans in active forbearance, in which borrowers are allowed to delay their monthly payments, fell by 435,000 from the previous week, according to mortgage data firm Black Knight.
  • That is the largest one-week drop yet.
  • Roughly 4.14 million loans were in forbearance, representing 7.8% of all active mortgages, down from 8.6% the prior week. That’s the lowest amount since April 28.
A man walks past the U.S. Capitol building in Washington, June 25, 2020.

A man walks past the U.S. Capitol building in Washington, June 25, 2020.Al Drago | Reuters

The number of homeowners in government and private sector mortgage bailout plans declined for the second straight week, as borrowers who got in earliest saw their plans expire.

More borrowers, however, are getting extensions of those initial three-month plans, proving the pain in the market is not over yet.

As of Tuesday, the volume of loans in active forbearance, in which borrowers are allowed to delay their monthly payments, fell by 435,000 from the previous week, according to Black Knight, a mortgage data and technology firm. That is the largest one-week drop yet.

Roughly 4.14 million loans were in forbearance, representing 7.8% of all active mortgages, down from 8.6% the prior week. That’s the lowest amount since April 28. These loans together represent just under $900 billion in unpaid principal.WATCH NOWVIDEO03:31Covid-19 mortgage bailouts drop by 435,000 but extensions increase

By category, about 6% of all mortgages backed by Fannie Mae and Freddie Mac and 11.6% of all FHA/VA loans are in forbearance plans. Just over 8.2% of loans in private label securities or banks’ portfolios are also in forbearance. The largest drop in forbearances was in Fannie and Freddie mortgages, down by 200,000 during the week

“The reduction of roughly 435,000 was driven at least in part by the fact that more than half of all active forbearance plans entering the month were set to expire at the end of June,” said Andy Walden, an economist with Black Knight. “While the majority of those have been extended, this week’s data suggests a significant share were not.”

More than 26% of loans in forbearance were extensions, according to a count by the Mortgage Bankers Association for the week ending June 28. That share has increased steadily for the past three weeks. 

The bulk of the loans in forbearance are government backed and part of the mortgage bailout program in the CARES Act, which President Donald Trump signed into law in March. It allows borrowers to miss monthly payments for at least three months and potentially up to a year. Those payments can be remitted either in repayment plans, loan modifications, or when the home is sold or the mortgage refinanced. For loans not backed by the government, most banks and private lenders have set up similar plans.

While the drop in active mortgage forbearances is encouraging, recent spikes in coronavirus cases in various states, in addition to the expiration of expanded unemployment benefits at the end of this month, present significant risk to the recovery in the mortgage market.

read more

https://www.cnbc.com/2020/07/10/coronavirus-mortgage-bailout-sees-biggest-one-week-decline-yet.html