Californians are bracing for power outages throughout the state as utilities consider sweeping blackouts amid returning high winds.
Pacific Gas & Electric Co. announced Monday it could shut off power to 605,000 customers Tuesday and Wednesday in its latest bid to reduce the wildfire risk. That means well over 1 million people could lose power.
The counties are Alameda, Alpine, Amador, Butte, Calaveras, Contra Costa, El Dorado, Humboldt, Kern, Lake, Marin, Mendocino, Napa, Nevada, Placer, Plumas, San Mateo, Santa Clara, Santa Cruz, Shasta, Sierra, Siskiyou, Solano, Sonoma, Tehama, Trinity, Tuolumne, Yolo and Yuba.
Some shutoffs took place Tuesday morning.
That blackout would cover more than two dozen Northern California counties and would come just days after a much larger power shut-off that covered nearly 1 million customers over the weekend. That outage is believed to have affected more than 2 million residents in the Bay Area and other northern regions.
To the south, a forecast of more Santa Ana winds prompted Southern California Edison to say it could shut off power to more than 350,000 customers. Those shut-offs include Los Angeles, Ventura, Santa Barbara, San Bernardino and Riverside counties.
The blackouts are a new and controversial tactic designed to prevent wind-driven brush fires caused by downed utility lines. Officials think the tactic is effective. But two major fires this month — the Kincade fire in Sonoma County and the Saddleridge fire in L.A. — may have been caused by downed power lines.
With the Kincade fire spreading, Santa Rosa residents were forced to evacuate in darkness early Sunday amid PG&E power outages, using flashlights and cellphones as light sources.
Elsewhere, businesses have closed, and plans have been canceled. Food has spoiled in refrigerators.
PG&E on Monday revealed it had failed to notify about 23,000 of its customers of precautionary power shutdowns earlier this month and also disclosed that its equipment malfunctioned near two fires that broke out in Contra Costa County on Sunday afternoon.
The utility identified the incidents in filings to the California Public Utilities Commission the same day the CPUC announced it would investigate how PG&E and other utilities handled shut-offs this year amid competing demands. Critics want PG&E to stop causing more wildfires, but the utility also has come under fire for the widespread blackouts, often without adequate notice to the public and vulnerable populations.
The utility de-energized lines to 729,000 of its customers between Oct. 9 and 12, but notifications were not sent to about 23,000 customers, including 500 with medical conditions, PG&E stated in a CPUC filing.
The utility failed to notify some people because, among other reasons, there was no contact information on file with the company or the customers were overlooked because of the shifting grid patterns that the utility was establishing, according to PG&E officials who declined to comment beyond what was stated in the report.
The company said it tried to reach customers who required power for medical equipment — known as medical baseline customers — through any means necessary, including phone calls, text messages, emails or knocks on the door.
“Of the 30,026 medical baseline customers impacted, PG&E verified 29,144 received notice prior to de-energization,” the report stated. “A total of 28,138 confirmed receipt of a notification, which included 5,080 door knocks. The medical baseline customers that did not confirm receipt of an automatic notification prior to de-energization had received multiple contact attempts.”
PG&E, which filed for bankruptcy this year, faces liabilities for causing several California wildfires, and it has recently faced accusations it is triggering power shutdowns mainly to avoid further financial exposure.
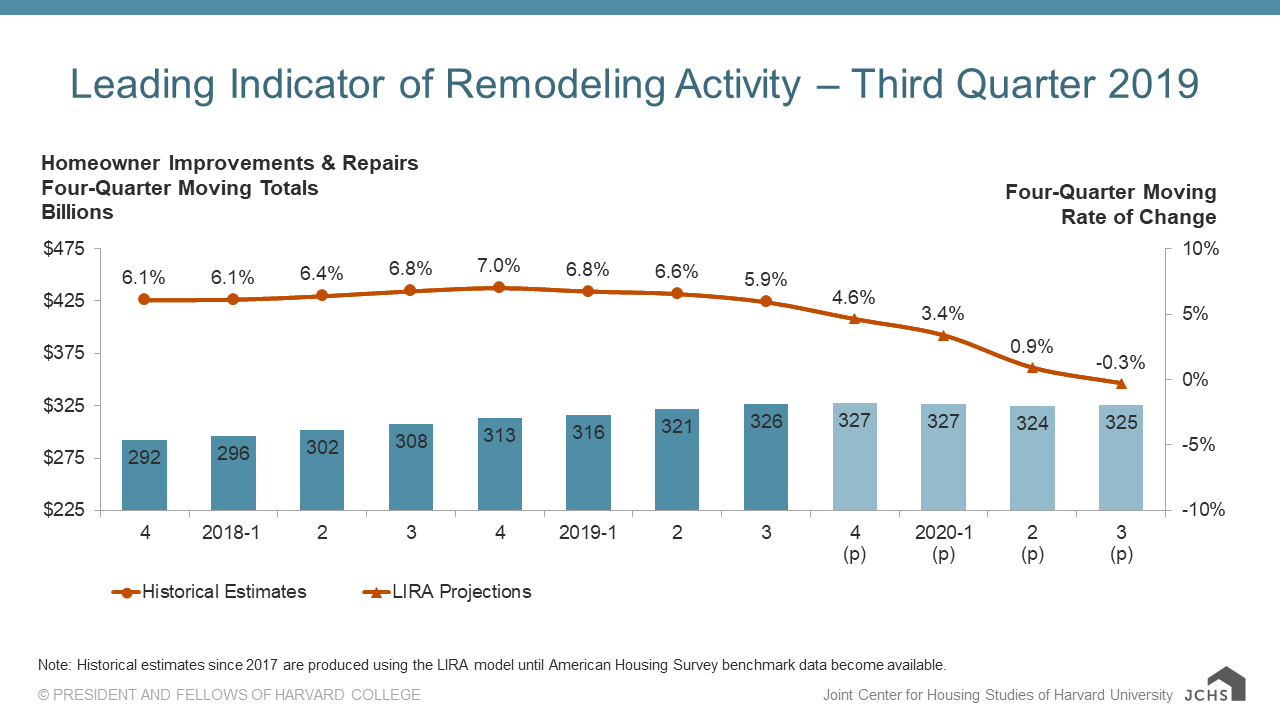
Home renovation spending reached a record high this summer, according to Harvard University’s Joint Center for Housing Studies. Although they expected those numbers to continue to soar through the end of 2019, the JCHS now says it expects a complete stall come 2020.
(Image courtesy of Harvard University’s Joint Center for Housing Studies. Click to enlarge.)
The Leading Indicator of Remodeling Activity released by the Remodeling Futures Program at JCHS said that annual gains in homeowner spending for improvements and repairs will dissipate by the second half of 2020. Know How To Rebuild Your Home After A Flood?
To that point, the LIRA states that the annual home improvement and maintenance expenditures will post a modest decline of 0.3% through the third quarter of 2020.
“Continued weakness in existing home sales and new construction will lead to sluggish remodeling activity next year,” said Chris Herbert, managing director of the JCHS. “Slowdowns in other key indicators of improvement spending—project permitting, sales of building materials, and home prices—also suggest the remodeling market may be reaching a turning point.”
Back in July, JCHS said that it expected remodeling spending to total a record $331 billion for all of 2019.
Now, the furthest projection in the index (the end of Q2 2020) suggests that spending over the prior 12 months will probably total $323 billion.
“At $325 billion, owner improvement and repair spending in the coming year is expected to essentially remain flat compared to market spending of $326 billion over the past four quarters,” says Abbe Will, associate project director in the Remodeling Futures Program at the Center. “However, today’s low mortgage interest rates may help counter some of these headwinds, which could buoy home improvement expenditure over the coming year.”
Buoyed by a strong economy and continued low mortgage rates, the New York State housing market showed an upward climb in sales and listings in September, according to the housing market report released today by the New York State Association of REALTORS®.
Closed sales in New York totaled 11,467 units in the month of September, a 1.6-percent increase from this time last year. New listings and pending sales rose substantially in September – up 7.5-percent to 18,161 homes and 7.6-percent to 11,182 respectively.
For the third quarter, closed sales were down marginally, 0.8-percent to 38,722 homes but both new listings and pending sales trended upward. There were 56,361 new listings this quarter, a 1.2-percent increase, while pending sales rose 4.9-percent to 37,766 homes.
Interest rates remained low, down 0.1-percent to 3.61 percent on a 30-year fixed mortgage, according to Freddie Mac. This is the fourth consecutive month that interest rates were below 4.0-percent.
Median sales prices once again climbed in September, up 5.7-percent to $280,000. Quarterly prices surged upwards as well, rising 5.5-percent to $290,000. Inventory levels were down for September, 2.9-percent to 71,737 homes for sale.
Credit scores. It seems like we’re talking about them more than ever. Where to get them, how to track them, and the best ways to improve them.
But why is your credit score so important to so many lenders? What does it tell them about you and how does it help them make decisions about what kind of loan you may be approved for?
Or if you’ll receive one at all?
We’re here to demystify “creditworthiness” in the eyes of some lenders and break down different credit scores, so you can feel more prepared — and less confused, and perhaps a little less frustrated — when you apply for a loan.
Credit scores tell most lenders how likely you are to repay them
Think of your credit score as a financial report card. When lenders pull your credit report, one of the things they look at is your credit score — your “grades,” so to speak — and, based on how high or low your number is, they can estimate how much risk you present as a borrower.
Instead of As, Bs, Cs, and so on, your three-digit credit score is grouped into the following categories (also known as a credit score scale): poor, fair, good, very good, and excellent. While these categories differ slightly between the two main credit calculators (FICO® credit score and VantageScore®)1, they generally fall into the following ranges:
Where your credit score falls tells many lenders a lot about your financial history. And while it’s not the only factor that determines whether or not you’ll get a loan — and the loan terms you’ll receive — it can be an important one.
What credit report information do most lenders use to make their decisions?
When lenders pull your credit report from the 3 credit bureaus — Equifax®, Experian® and TransUnion® — they’ll be able to see much more than where you fall on the credit score scale.
Here’s some of what they’ll review:
If you pay your bills on time. Lenders want to know you pay your bills on time. They also want to know if you have any accounts in collection or if you’ve declared bankruptcy. There’s a reason payment history is a whopping 35% of your FICO score.2 The more responsible you are with the bills you already have, the more likely you are to be responsible with a new one.
How much credit you’re using. (Also known as credit utilization ratio.) Lenders also like to see that you haven’t used up all of your available credit so you have the least amount of debt possible. For example, if you have $5,000 worth of credit on your credit cards, it looks bad to lenders if you’re already using $4,000 of it. A good rule of thumb is to keep your credit utilization at 30% or less.3
Your debt-to-income ratio. Also known as your DTI, your debt-to-income ratio tells lenders you have enough income to pay your debts. This is why lenders request your income along with mortgage or rent, car payments, and other monthly bills. They want to see that even after paying all your bills, you’ll still have enough money to pay them as well. (The lower your DTI the better. You can calculate your own DTI here.)
How long you’ve had your accounts. That credit card you’ve had for years and years can be a good thing, especially if you’ve had a great payment history. The length of time you’ve had an account in good standing—as well as the diversity of your accounts (auto loan, mortgage, etc.) — looks good to lenders because it demonstrates that you have a history of responsible borrowing with different creditors.
The bottom line? Lenders want to be confident you’ll pay them back.
The financial industry’s credit model can sometimes feel like a harsh way of deciding who’s worthy enough for a loan, especially if your credit score could use improvement. It’s important to remember that lenders simply want to rest assured that you’ll pay them back, and your credit score, as well as your credit report, helps them do that.
It’s also important to remember there are lenders that look at more than your credit score. You just have to take time to find one that will review your individual situation to help you find the right solution.
Look your best to lenders by keeping an eye on your credit.
No matter what type of credit score you have, it’s important to keep track of your credit report so you can not only be approved for loans, but get the very best rates for repayment. As mandated by the federal government, every U.S. citizen is entitled to one free credit report from each of the 3 credit bureaus each year.4 It’s a great way to prevent unwelcome surprises and work your way to excellent credit.
Freddie Mac today released the results of its Primary Mortgage Market Survey showing that the 30-year fixed-rate mortgage (FRM) averaged 3.75 percent, the highest it’s been in 12 weeks.
“The outlook for a favorable resolution to the trade dispute between the U.S. and China is still unclear, introducing some volatility into financial markets and the benchmark 10-year Treasury yield,” said Sam Khater, Freddie Mac’s Chief Economist. “Mortgage rates are following suit at near historic lows, while mortgage applications to purchase a home remain higher year over year.”
News Facts
30-year fixed-rate mortgage averaged 3.75 percent with an average 0.5 point for the week ending October 24, 2019, up from last week when it averaged 3.69 percent. A year ago at this time, the 30-year FRM averaged 4.86 percent.
15-year fixed-rate mortgage averaged 3.18 percent with an average 0.5 point, up from last week when it averaged 3.15 percent. A year ago at this time, the 15-year FRM averaged 4.29 percent.
5-year Treasury-indexed hybrid adjustable-rate mortgage (ARM) averaged 3.4 percent with an average 0.3 point, up from last week when it averaged 3.15 percent. A year ago at this time, the 5-year ARM averaged 4.14 percent.
Average commitment rates should be reported along with average fees and points to reflect the total upfront cost of obtaining the mortgage. Visit the following link for the Definitions. Borrowers may still pay closing costs which are not included in the survey.
The National Association of Home Builders’ (NAHB) Remodeling Market Index (RMI) posted a reading of 55 in the third quarter of 2019, unchanged from last quarter (Figure 1). Since the second quarter of 2013, the RMI has been above its breakeven point of 50, which indicates that more remodelers report market activity is higher than report it is lower, compared to the prior quarter.
The overall RMI is an average of two sub-indices, one measuring current remodeling activity and another measuring future indicators. The current market conditions index edged down one point to 54 from the previous quarter (Figure 2). Among its three major components, major additions and alterations dropped one point to 52, minor additions and alterations decreased by two points to 53 and the home maintenance and repair component rose one point to 57.
The future market indicators gained two points from the previous quarter to 57 (Figure 3). Calls for bids increased by one to 55, amount of work committed for the next three months gained two points to 54, the backlog of remodeling jobs increased one point to 59 and appointments for proposals jumped by five points to 60.
Demand for remodeling is solid and is supported by a healthy labor market and low interest rates. It is important to note that remodelers still face challenges, such as high costs and a lack of skilled labor.
US homebuilder confidence rises to 20 month high with lower interest rates
The nation’s low-interest-rate environment and strong job market propelled homebuilder confidence to 71 points in October, the National Association of Home Builders and Wells Fargo said in this month’s Housing Market Index.
According to the index, October’s level now marks the highest reading since February of last year.
In October, the index measuring current sales conditions rose to 78 points, while buyer traffic increased to 54 points and sales expectations over the next six months jumped to 76.
“The second half of 2019 has seen steady gains in single-family construction, and this is mirrored by the gradual uptick in builder sentiment over the past few months,” NAHB Chief Economist Robert Dietz said. “However, builders continue to remain cautious due to ongoing supply-side constraints and concerns about a slowing economy.”
Despite these concerns, the three-month moving averages for regional HMI scores show the Northeast grew to 60 points, the South rose to 73 points, the West climbed to 78 points and the Midwest inched forward to 58 points.
NOTE: The NAHB/Wells Fargo Housing Market Index gauges builder opinions of single-family home sales and expectations, asking for a rating of good, fair or poor. Builders are also asked to rate prospective buyer traffic from very low to very high. The scores are used to calculate a seasonally adjusted index with a rating of 50 or over indicating positive sentiment.
The Town Board on October 15 held its first work session on the the Town’s 10 year Capital Plan which runs from 2020 through 2029; we also met with Planning Board Chair Deirdre Courtney-Batson to discuss the size, composition and number of subcommittees to develop a new Town Comprehensive Plan; 321 Bedford Road and 74 Main Street (Bedford Hills Community House); making headway in discussions with the NYC Department of Environmental Protection for Phase II for sewers; making headway for the possible acquisition of 56 acres which includes the Buxton Gorge for passive recreational use (trails).
NEW POSTS
Highlights of the October 15Town Board Meeting Work Session on 2020 Capital Plan At this first work session on the Capital Plan, Comptroller Abraham Zambrano provided a high level view of any proposed changes in the existing Capital Plan (including any project expansion), any new projects and any projects which may be deferred. We anticipate increasing the scope of renovations to the Bedford Hills Community House and carry out the work in 2020 rather than spreading it out over several years (neither a “gut” renovation nor additions are being considered). The architectural firm selected (see below) will incorporate recommendations and plans which are provided through the energy audit now under way, including the feasibility and cost effectiveness of geothermal/heat pumps. Approval of Geothermal Feasibility Study Other project changes include carrying out in 2020 and 2021 HVAC system replacements reaching the end of their useful lives (here, too, geothermal/heat pumps are under consideration); commuter lot improvements such (lighting, landscaping, etc.); roof and gas boiler replacement for the Recreation & Parks Department maintenance building; security systems for the Town House and 425 Cherry Street; IT upgrade/replacements; improvements to the commuter lots (lighting/landscaping); rooftop solar installations; hamlet center improvements (Bedford Hills and Katonah in 2020 following the completion of the sewer system); Todd’s Pond engineering study; further funding for tree maintenance and plantings; and an increase in funding for the work of the Cemetery Advisory Committee with work on our historic Town cemeteries . Some changes would be deferral until 2022 of a municipal parking lot in Bedford Village (Bedford Presbyterian Church, owner of the land which the Town would purchase for the vacant lot is not inclined to proceed at the time with sale of the property). We also are deferring improvements to the Crusher Road highway facility. The Board scheduled another work session on November 7 at which we’ll hone in further on the schedule, debt service which would result from the bond issuance. In this connection later in the meeting, the Board appointed Douglas Goodfriend of Orrick, as bond counsel, who would prepare bond resolutions first quarter of 2020 to implement the first two years of the Capital Plan. Please see Comptroller Abraham Zambrano’s Summary Memo
Honoring Assistant Chief James Fayette Lawrenceof the Katonah Fire Department Deputy Chief Dean W. Pappas was on hand to participate in paying tribute to Katonah Fire Department Assistant Chief James Fayette Lawrence. Sixty years ago, on October 6, 1959, he gave his life in the performance of his firematic duties: and today, remains the only Katonah Firefighter to have died in the line of duty. Chief Lawrence was responding to a bush fire at the Ramsey Hunt Estate on Mount Holly Road and, while fighting the fire with other Katonah Volunteer Firefighters, became entangled in a fallen 4,600 volt high tension line. His fellow firefighters pulled him off the line with pike poles and attempted to revive him.Despite over 45 minutes of heroic effort, Chief Lawrence died at the age ofthirty nine. Chief Lawrence’s sacrifice was yet another indication of his community commitment and dedication as a lifelong resident of the Hamlet of Katonah. The Town Board presented to Deputy Chief Pappas a proclamation honoring the memory of Chief Lawrence, a man who was driven purely by his love and devotion to everyone around him and whose kindness and bravery in the face of danger always made an impact on this community and will continue to inspire others.
Work Session on Preparing a New TownComprehensive Plan The Town Board’s meeting with Planning Board Chair Deirdre Courtney-Batson started with a work session to discuss the role of each subcommittee and skill sets and experience sought for individuals to be appointed. We moved to an Executive Session to discuss those interested in being appointed. I anticipate we’ll make appointments at the November 7 Town Board meeting. For further information on the subcommittees please see my previous discussion.
Update and Report of Cemetery Advisory Committee Cemetery Committee chair Jenny Weisburger presented a report to the Town Board on the work of the Committee and Friends of the Bedford Burying Grounds. Over several years the Committee and the Friends of the Burying Grounds have made significant strides in repairing gravestones and reconstructing walls. She explained another one of the Cemetery Committee project that is to explore the potential to provide new interment plots that are associated with the increasing trend of cremation. The Cemetery Committee discussed with consultants that the focus of expansion be on cremation burials as opposed to full, traditional burials. The proposed expansion of the cemetery would be low impact on Bedford’s historic cemeteries while benefiting Bedford residents who intend that their ashes be buried here.
Congratulations on Appointments to theComplete Count Committee The 2020 United States Census is of critical importance to the Town of Bedford; its data affects funds available for our schools, housing, seniors, low and moderate income populations, sales tax revenue, grant awards; business decisions; redistricting; emergency planning; fire departments; hospitals and much more. The Town Board of the Town of Bedford recognizes the critical importance of ensuring that the 2020 United States Census counts every single individual in the Town of Bedford. We congratulate the following appointees to the Census Committee: Jodi Kimmel (Chair)(Fox Lane Middle School)Joe Ruppenstein (Veterans Committee)Joanne Marcus (Senior Committee)Noya Guerrero (Community Center of Northern Westchester)Rev. Merle McJunkin (Antioch Baptist Church; Non-Resident associate member).
Proposal of FBS for Parking ViolationsManagement Services. The Town Board approved FBS Justice Solutions proposal to the Town Board for parking violations management services. FBS will provide the necessary handheld equipment and related software that will integrate parking enforcement and the Court’s need to manage such enforcement. Based on the Town’s current needs, it was recommended that the Town Board approved engaging FBS to provide services that will facilitate the management of the parking enforcement. The Board authorized proceeding with FBS’ option plan under which the Town purchases equipment. Proposal 2
Town Board Decision Not to Proceed with proposal of Homeland Towers for a cell tower at the Town property at 425 Cherry Street. At its meeting on October 7, after careful consideration of a number of issues, the Planning Board determined that it must recommend against the use of the Town property at 425 Cherry Street as the location to the Town Board a proposed Homeland Towers cell tower. In particular, the Planning Board found that, based on the visual analysis provided by the applicant, a 150’ tower at either of the two proposed locations at 425 Cherry, would have an unacceptable visual impact on the heart of the hamlet of Bedford Hills. The Board approved the Planning Board’s recommendation not to proceed with the Homeland Tower’s proposal.
Proposed Architect for Facility Assessment ofBedford Hills Community Center Deputy Supervisor Lee Roberts, Councilwoman MaryAnn Carr and I have been working with Recreation and Parks Superintendent Chris Soi, BuildingInspector Al Ciraco and Director of Energy and Sustainability Mark Thielking regarding improvements to the Bedford Hills Community House. Chris Soi requested the Town Board select an architectural firm to perform an assessment and study to establish a scope of work and project budget for the proposed capital improvements to the Bedford Hills Community House. Based on the pricing provided in the proposal of architects KG&D, the Board approved $14,500.00 to perform the study which would be funded from the existing Bedford Hills Community House Capital Project account. There will be a “gut” renovation, however, the scope of work will include among other components: interior development, renovations to multiple facilities and exterior restoration. The Board approved the implementation and completion of the study, and not at this time additional architectural services. This study is a critical step as the Town Board is considering Bedford Hills Community House capital improvements in formulating the 2020-2029 Capital Plan. The study will be completed in early/mid November. Letter of Intent KGD Proposal
EARLY VOTING STARTS OCTOBER 26 For the first time in history, New Yorkers have a choice: Vote Early October 26 through November 3at Mount Kisco Town HallORVote on Election Day, November 5at your regular polling place.It’s simple:Town of Bedford voters may vote earlyOctober 26 through November 3 atMount Kisco Town Hall, 104 Main Street
Bedford Public Works Dept. PAVING NOTICE UPDATE
Public Notice to all residents regarding Road Paving in Bedford NY for October 2019. The Town of Bedford plans on several days of road paving. Work will begin Monday, Oct. 7, 2019 and last through Friday, Oct. 18 (inclusive.) We will NOT be paving Saturday, Oct. 12, Sunday, Oct. 13, or Monday, Oct. 14 (Columbus Day). Roads to be paved at this time include:CHURCH STREETSUNSET DRIVE (Bedford Hills off of Main St.)SEMINARY ROADDAVID’S WAYDAVIDS HILL ROAD (The paved hill) Commuters could experience temporary disruptions to traffic and access as paving operations commence. Residents are asked to refrain from parking on these streets as paving proceeds. The precise scheduling of work depends upon weather conditions and the proper operation of paving equipment. Therefore your patience and understanding are appreciated. Keep in mind that it is possible that rain events or paving equipment issues may push back the paving schedule a day or two. Paving will be preceded.by road milling on Cherry Street and Sunset Drive as well as the milling of some key cuts to the intersections and to some driveways where key cuts are considered beneficial. If you have any further questions regarding this matter, please feel free to contact Bedford Public Works Department at 914-666-7669.
COMMUNITY EVENTS CALENDARWEEK OF 10.18-10.26Click here
OTHER NEW POSTS
HELP WANTED – Part-time Interns! The Supervisor’s office is seeking a few high school studentsto intern a few hours a week through the fall. Community service hours will be honored while learning about local government. Take photos, get web skills, learn about your town! This is a fun position that will give you a broad range of experiences.Please send an email to pcohen@bedfordny.gov
Attention Residents ofBedford Central School District I first wish to thank members of the community for contacting me and meeting with me to discuss their concerns about possible school closures. We are extremely concerned about the impacts, and will be actively engaged in the discussions. Part of what I intend to do is to help get the word out of forums and meetings which BCSD is holding regarding its facilities plan. Please try to attend and participate. It is critical to the education of our children and our community generally. From the BCSD flyer on community forums for long-range facilities plan: “Bedford Central School District invites all members of the community to attend one of our open community forums about the district’s developing Long-Range Facilities Plan.” These forums encourage Bedford citizens to share their thoughts, hopes, and ideas for the future.”
HOURSSat/Sun: 12 PM through 5 PMMon/Wed/Fri: 8 AM through 4 PMTue/Thu: 12 PM through 8 PM
You also may call Town Clerk Boo Fumagalli at 914-864-3868 or e-mail her at lfumagalli@bedfordny.gov
The 2020 Census – JOBS! DID YOU KNOW? There are jobs available right now for the 2020 Census. 2020 census.gov/jobs or call 1-855-JOB-2020 The U.S. Census Bureau is recruiting thousands of people across the country – especially field jobs ascertaining addresses and census takers. Hours are flexible and the pay rate is quite competitive at $21.00 per hour for a census takerin Westchester County And as a resident getting paid for your work, if you are assigned to Bedford, you will be helping your town get a complete count.
REMINDER
It’s Leaf Blowing Season –Change Over in Rules Affecting Hamlet Zones
Saturday October 19The Annual 5th GradePancake Breakfast 7:30am-11:30am
Bedford HillsElementary School123 Babbitt Road Bedford Hills All are welcome. Proceeds to fund the5th Grade Class Trip.
ART STROLL – OCTOBER 19 FROM 5PM -8 PM
OCTOBER 20 FREE RABIES VACCINES FOR WESTCHESTER PETS Westchester County residents can bring their dogs, cats and ferrets in for free rabies vaccinations on Sunday, October 20 from 11:30 a.m. to 3:30 p.m. at the Humane Society of Westchester, 70 Portman Road in New Rochelle. Walk-ins are welcome; no appointments are needed. Call 914-632-2925 for more information. Cats and ferrets must be in carriers and dogs must be on a leash. Aggressive dogs must be muzzled. No examinations will be given and all pets must be supervised by an adult. “Vaccinating your pet against rabies will protect your pet and your family in case your pet has contact with a rabid or potentially rabid animal,” said Westchester County Health Commissioner, Sherlita Amler, MD. Under New York State law, dogs and cats must receive their first rabies vaccine no later than four months after birth. A second rabies shot must be given within one year of the first vaccine, with additional booster shots given every one or three years after that, depending on the vaccine used. Owners who fail to get their pets vaccinated and keep the vaccinations up-to-date may be fined up to $2,000. Rabies is a fatal disease that spreads through the bite or saliva of infected animals. Those animals most commonly infected are raccoons, skunks, bats and foxes. However, domestic animals such as cats and dogs are also at risk because they can easily contract rabies from wild or stray animals. BOOSTER INFO: A pet that is up-to-date with its rabies vaccinations would only need a booster dose of vaccine within five days of the pet’s exposure to a known or suspect rabid animal. Animals not up-to-date with rabies vaccinations would be quarantined or euthanized following contact with a rabid or suspect-rabid animal. SIGNS OF RABIES: A change in an animal’s behavior is often the first sign of rabies. A rabid animal may become either abnormally aggressive or unusually tame. It may lose fear of people and become docile, or become excited and irritable. Infected animals sometimes stagger, spit and froth at the mouth. Adults should encourage children to avoid touching unfamiliar animals, and to immediately tell an adult if they have been bitten or scratched by an animal. All animal bites or contacts with animals suspected of having rabies must be reported to the Westchester County Health Department at (914) 813-5000. After hours, callers should follow instructions in the recorded message for reporting public health emergencies 24 hours a day. To learn more about rabies and its prevention, visit the Health Department’s website at www.westchestergov.com/health, like us on Facebook at facebook.com/wchealthdept or follow us on Twitter @wchealthdept.
SAVE THE DATES!
The Bedford Hills Neighborhood Associationinvites you to The 1st Annual
Bedford Village: Update on Proposal for a New Firehouse/ Emergency Services Department Bedford Village Fire Commissioner Heather Feldman has provided me the following update… As was shared last week, we will use this space to address FAQs as they arise. Please email any questions to: NFC@bedfordfire.com and note we may edit the question for space and clarity. Q. Some communities (Katonah, Pound Ridge, Bedford Hills) split their emergency services into two departments – Fire and Emergency Medical. Why do we not have the same two-pronged structure in Bedford?A. Since our founding in 1923, the Bedford Fire Department has provided both fire and emergency medical response from a single site, and a dedicated ambulance to cover medical calls since the 1950’s. We have always believed that the community is best served from a single location so to fully leverage financial and operational efficiencies. If we were to split out our EMS agency, the Bedford Village community would then have to manage and maintain two separate properties and two buildings, engage two separate corps, identify two separate administrative bodies, and fund two separate department budgets. Moreover, having both fire and EMS volunteers integrated into a single department allows for greater professional familiarity among the corps, resulting in a more coordinated crisis response. Simply put, the BVFD model minimizes costs and maximizes service. Q. I’ve heard that an exercise room for the first responders is being considered for the new building. Can you explain the rationale behind that decision? It seems very indulgent!A. New York State requires Fire Districts to provide their first responders access to physical fitness facilities. These guidelines allow our volunteer firefighters and EMTs to attain the strength, agility, and stamina needed to handle the myriad crises that they confront each day. The vast majority of modern firehouses have in-house fitness equipment. Having this resource on site helps keep our volunteers at the firehouse, reducing emergency response times. Additionally, there is an economic advantage to providing this important professional development resource — currently, the BVFD spends approximately $15,000 of taxpayer funds per year to cover the costs of gym memberships of our volunteer corps. Putting an exercise room in a 75-year facility will save money over the long term.
*Each week, we will look forward to addressing a question about the revised project that has emerged.Please email your questions to: NFC@bedfordfire.com and please note we may edit the question for space and clarity.
Sharing the Road for Motorist & Cyclists There is nothing better than getting out to enjoy a ride on a clear, crisp autumn morning. But there needs to be a partnership of shared responsibility of both the cyclist and motorist to keep everyone safe. Responsibility of the cyclist: Wear a helmet.Be visible. Reflectors, lights, and reflective clothing help motorists see you. Follow traffic laws. Cyclists must follow the same traffic laws as motorists. Be predictable. Give motorists a sense of your direction and provide signals to show motorists your intentions to turn. Share the road. Try to stay as far to the right side of the roadway as safety allows. Do not impede traffic. Cyclists may ride a maximum of two abreast as long as normal traffic flow is not impeded.Be alert and try to anticipate potential conflicts before they occur. Responsibility of the motorist: Be Patient. Only pass a cyclist when there is adequate site distance to do so without impacting oncoming traffic.Share the road. When passing a cyclist, be sure to provide a minimum of three feet of buffer between you and the rider.Right hand turn awareness. Avoid cutting off a cyclist by making a right hand turn in front of them.Lookout for cyclists. When entering a roadway, don’t just check for cars, keep an eye out for cyclists too. Working together will keep everyone safe and we can all enjoy the beautiful roads of Bedford.
Autism Registry formsAn Autism registry has been implemented on the Bedford Police Department website. The Bedford Central School District has been given access to the forms to distribute to students and parents. You can also download the forms here.
UPDATE for AT&T Cell Service CustomersOther Internet Service Issues?My thanks for the post on the Katonah Parents Facebook group alerting me to the AT&T cell service outage (the mention of my name on KPFG triggered an e-mail notification to me – it worked!). And thanks as well to those who e-mailed us with the specifics. We were in touch with AT&T Wireless on Wednesday and Thursday who contacted their field team. Yesterday, I was put in contact with an AT&T representative higher up in the food chain. I don’t know whether she was responsible for the service restoration or whether it was in the works anyway. In any case I now have a person I can go to other than those lower down who we went to earlier this week when you folks alerted us to the problems. So please do let us know if you have any continuing or future service problems and we’ll do our best to get it taken care of. Thanks for your patience. And going forward, for anyone having service issues, here are some numbers: Customer Service for Verizon /Fios: 1 800 922 0204 Customer Service for Optimum/ Altice: 718 860 3513 Customer Service for AT&T (cell phone service): 800 288 2020 We’ll try to help after you’ve exhausted your options with customer service support. Please feel free to contact Phyllis Cohen at pcohen@bedfordny.gov or me and provide the following: NameAddressAccount numberPhone number(s)E-mail addressDescription of the issue (dates of intermittent or lack of service, etc.)
PRIOR POSTS OFCONTINUED RELEVANCE (cont).
The I-684$13 Million Paving Project Front row (l to r:) Lee Roberts, Kate Galligan, Kitley Covill, Chris Burdick, Shelley Mayer, Andrea Stewart Cousins, Marie Therese Dominquez, Peter Harkham, MaryAnn Carr. Back row: Don Scott, David Buchwald, Lance MacMillan.\
On Thursday, September 12, I joined State Senator Shelley Mayer, State Senate Majority Leader Andrea Stewart-Cousins, State Senator Peter Harckham and Assemblyman David Buchwald in a press conference celebrating the I-684 paving project at long last coming to fruition. We were honored to be joined by New York State Department of Transportation Commissioner Marie Therese Dominguez. READ MORE
Agreement with NYS Department of Environmental Conservation for $1 Million Grant for Sewer ProjectREAD MORE
Adoption of New Local LawRegulating Sale of Vape Products The Town Board held a public hearing to implement a settlement of litigation against the Town which resulted in an injunction against the Town barring enforcement of our existing vape law. READ MORE
Reminder – No Knock Registry Law We are receiving reports of unscrupulous, deceptive and fraudulent tactics of door to door salesman. Please be reminded that the Town Board amended its solicitation law to provide a No Knock Registry. It prohibits such solicitation to the homes of residents who complete a request to be listed on a “no knock registry”. The law does not infringe upon political, educational or religious activities. READ MORE
New Collective Bargaining Agreementwith our Office Workers The negotiating teams of the Town of Bedford and the Teamsters 456 – White Collar Unit, which represents the Town’s office workers, met several times starting on January 25, 2019 to negotiate a new Collective Bargaining Agreement (CBA) for the period January 1, 2019 through December 31, 2022. READ MORE
SENIOR NEWS
Become of member of your Bedford Playhouse. Discounted membership for ages 62+ Sign up here
Living Green
Leaf Discount ProgramExtended untilJanuary 2, 2020READ MORE
Thanks to a grant from New York State Energy Research & Development, homeowners in the towns of Bedford, Lewisboro and Pound Ridge now have a unique opportunity to determine whether heat pumps might provide a more comfortable home while saving on energy bills. Heat pumps draw from either the ambient air (air source pumps) or the earth (geothermal pumps). Geothermal provides a constant temperature of about 54 degrees allowing for heating in the winter and cooling in the summer. The program is spearheaded by Energize NY, in partnership with Sustainable Westchester, Abundant Efficiency and NYSERDA, provides homeowners in the three towns the opportunity to learn whether these new renewable energy choices are right for you. Energize has launched an ambitious community outreach program to introduce homeowners both to the technology and reputable, certified heating and cooling and energy efficiency experts who offer the latest clean energy technologies including air source and geothermal heat pumps and energy efficiency improvements. The contractors are Bruni & Campisi (914-269-6760), Healthy Home Energy & Consulting, Inc. (9144-242-9733) and Dandelion Energy (833-436-4255) On Thursday, June 26, the Heat Smart team was on hand for the community to explain the program (together with service Tacos). Like to know more? Please click on this link https://www.heatsmartny.com/westchester or call 914-302-7300 x1 There is no cost or obligation to learn whether Heat Smart is right for you. Our thanks to Lauren Brois, Bedford 2020, the contractors and the Heat Smart campaign team for an excellent presentation.
Beaver Dam Yard Waste and Compost Facility The Town of Bedford Beaver Dam Compost Facility processes recyclable wood waste and leaves from the Town and provides beneficial reuse of the waste as compost and mulch. The facility provides an extremely cost effective method for this recycling as well as an environmental benefit of local recycling with minimal transportation requirements. It is open for residents to dispose of recyclable wood waste (logs and branches up to 6” diameter, brush, and leaves), as well as pick up wood mulch and leaf compost. This service is free to Town of Bedford residents between 7:30 AM and 3:00 PM Monday to Friday, excluding Town holidays. With Spring clean-up and planting season here, you may find these services helpful. I encourage you to review the updated information by clicking on Beaver Dam Compost Facility on the Town’s website.
“The master’s tools will never dismantle the master’s house,” penned poet and activist Audre Lorde. Pulled from a 1984 essay, the quote summarizes her larger argument that mainstream academic frameworks are incapable of permitting the disruption of their own status quo. “They may allow us temporarily to beat him at his own game, but they will never enable us to bring about genuine change,” wrote Lorde.
Over the last few months, several Democratic presidential hopefuls—namely Sen. Kamala Harris (Calif.), Sen. Elizabeth Warren (Mass.), and South Bend, Ind. Mayor Pete Buttigieg—have released housing proposals that utilize a curious vector to implement their respective remedies for historical discrimination: redlining maps.
Redlining was the practice of outlining areas with sizable Black populations in red ink on maps as a warning to mortgage lenders, effectively isolating Black people in areas that would suffer lower levels of investment than their white counterparts. The Democratic candidates hope that the contours of these old maps—once used by the government-sponsored Home Owners’ Loan Corporation (HOLC) from 1933 to 1977—offer the blueprint for closing the racial homeownership gap and increasing prosperity among largely Black and Brown Americans who were robbed of wealth for generations under redlining’s legal discriminatory policy.
Redlining was the practice of outlining areas with sizable Black populations in red ink on maps as a warning to mortgage lenders, effectively isolating Black people in areas that would suffer lower levels of investment than their white counterparts.
In each plan, redlining maps are used to determine eligibility for beneficiaries, to differing degrees:
Harris’s plan would invest $100 billion in assistance for down payments and closing costs, to be made available to those who have lived in government or rental housing for 10 or more preceding years in a formerly redlined area that is low-to-moderate income today. Grantees must also earn less than a maximum annual family income.
Warren’s plan would offer down payment assistance to first-time homebuyers in formerly redlined areas or low-income areas that experienced other forms of legal segregation, qualifying them for a grant applicable to a home anywhere in the country. The proposal is billed as a “first step towards closing the racial wealth gap,” and would be paid for by an estate tax.
Mayor Buttigieg’s plan proposes the Community Homestead Act, which would purchase abandoned properties in select cities and allow residents to acquire them. Eligible grantees include residents who earned less than the area median income over the last five years and either have resided in the area for at least three years, or have resided in any historically redlined or racially segregated area for at least three years.
However, based on our analysis of who lives in these formerly redlined districts today, Lorde’s quote should be considered when it comes to these proposed remedies.
The University of Richmond’s Mapping Inequality project has digitized scans of the HOLC redlining maps held in the National Archives. Examination of the maps, numbering over 200, reveals that approximately 11 million Americans (10,852,727) live in once-redlined areas, according to the latest population data from the Census Bureau’s American Community Survey (2017). This population is majority-minority but not majority-Black, and, contrary to conventional perceptions, Black residents also do not form a plurality in these areas overall. The Black population share is approximately 28%, ranking third among the racial groups who live in formerly redlined areas, behind white and Latino or Hispanic residents.
While still a tremendously large population, the approximately 3 million Black residents in redlined areas account for just 8% of all non-Latino or Hispanic Black Americans. Given the demographic shifts that have occurred since the federal government started using color-coded maps to assess mortgage risk, and the relatively small share of the Black population currently living in these areas, proposals that center on these past tools to redress discrimination probably won’t “dismantle the master’s house.”
THE PAST STILL HAUNTS US
Together with racially restrictive housing covenants that prohibited Black Americans from buying certain properties, redlining prevented generations of families from gaining equity in homeownership or making improvements to homes already owned. These unjust practices form part of a long history of discrimination, which has contributed to the disparities in homeownership and wealth still observed between the Black and white populations of the country today.
Redlined neighborhoods are generally located near the center of urban areas, where Black people were concentrated when the government generated the maps used today for the Harris, Warren, and Buttigieg proposals. But since then, transformational demographic shifts have spread different populations throughout metropolitan areas and increased the size of those areas overall. To assess the relative residual social patterns across redlined communities today, we compare the aggregate of the census block groups that fall within the redlined areas of each city to the remaining non-redlined areas in the same cities, and measure ways the two areas differ.
These localized comparisons show that in cities with a history of redlining, the redlined areas today generally remain more segregated and more economically disadvantaged, with higher Black and minority shares of population than the remainder of the city. Additionally, they have lower median household income, lower home values, older housing stock, and rents which are lower in absolute terms (but often higher as a percentage of income). Similar studies have confirmed these trends for other social characteristics, as well as a clear correlation showing more positive current-day outcomes for areas that were “greenlined.”
The selected characteristics in the group of the ten most populous redlined areas diverge less sharply than in the remaining smaller areas, suggesting that for smaller areas, the residual effects of redlining are perhaps felt more clearly.
This top-heavy slant of the population distribution poses an issue for policymakers who wish to use HOLC maps to address the legacy of past discrimination, as it is not the case that half of the homeownership and wealth gaps can be attributed to disparities among Black and white residents of those ten cities alone. Furthermore, Black-majority suburbs are on the rise, which are heavily underrepresented in HOLC maps due to their focus on urban centers.
WHO NOW LIVES IN ONCE-REDLINED AREAS?
In some places, redlined areas track with conventional perceptions. For example, in Birmingham, Ala., the redlined portion has a much higher concentration of Black residents than the rest of the city, as well as lower incomes and property values. Formerly redlined Birmingham is majority-Black, and a large share of the Black citizens of Birmingham reside in formerly redlined areas.
The racial history of Birmingham is one of sustained aggression against the Black population. The persistence of demographic patterns in formerly redlined Birmingham is a testament to informal and formal enforcement of spatial placement by local, state and private forces. In cities throughout the South with a similar demographic makeup and history of racial violence, policies of targeted assistance in redlined areas could prove useful in closing the local racial homeownership and wealth disparities. However, at the regional and city level across the country, we find wide variations in the demographic makeup of who lives in formerly redlined areas (both in absolute numbers and relative to the cities in which they are found).
Some redlined areas have a lower Black share of population than the rest of the city
Theoretically, if the effects of redlining had faded completely over time, demographics and socio-economic outcomes between redlined areas and the surrounding city would be indistinguishable. Of course, this is not the case, but the degree to which the Black versus non-Black population of a given redlined area matches the area around it varies greatly across cities. Of the 174 principal cities in the comparison, 114 showed a statistically significantly higher concentration of Black population in the redlined areas than the rest of the city. In 26 more, the concentration was higher but not statistically significant.
Six of the 34 cities which inverted this trend (a redlined area with a lower Black share of the population than the rest of the city) are among those 10 large cities which are home to half the redlined population: Detroit, Baltimore, Milwaukee, Boston, Los Angeles, and Philadelphia. Each of the six have sizeable Black populations, and Black people form the largest racial group in Detroit, Baltimore, and Philadelphia. And despite a demographic shift, the redlined portions of these cities still exhibit negative economic outcomes.
Clearly, these areas have suffered from a legacy of divestment, and deserve attention from policymakers. But a strategy to close the racial wealth gap that focuses mainly on these now-diversified locations risks overlooking Black neighborhoods elsewhere.
Some redlined areas, especially in the West, have a small Black population relative to white or Latino or Hispanic residents
Los Angeles is home to the third-most populous formerly redlined area, encircling over 620,000 people. Today, 70% of this group is Latino or Hispanic, 12% is white, and 6% is Black.
In 1930, nine years before the HOLC map was produced, census data showed that the whole city’s population was 88% white, 8% Mexican (the closest proxy to the Latino or Hispanic population from the time), and 2% Black. Even so, language from the original HOLC map makes explicit reference to Black neighborhoods. An excerpt from a map encompassing today’s central Los Angeles neighborhood of Jefferson Park derisively writes:
This is the “melting pot” area of Los Angeles, and has long been thoroughly blighted. The Negro concentration is largely in the eastern two thirds of the area. Original construction was evidently of fair quality but lack of proper maintenance is notable. Population is uniformly of poor quality and many improvements are in a state of dilapidation. This area is a fit location for a slum clearance project. The area is accorded a “low red” grade.
While redlined areas in Los Angeles largely did and still do encompass far more Latino or Hispanic residents than Black residents, property appraisals and neighborhood assessments were constantly undertaken from a distinctly anti-Black point of view. However, the demographic reality of redlined Los Angeles today means that policies implemented here to close the Black homeownership gap would miss the target population. Of course, the country experiences a Latino or Hispanic homeownership gap as well, which merits intentional consideration from policymakers. But Latino or Hispanic Americans should not be merely an incidental benefactor of policy directed at addressing historic discrimination against Black people.
Some redlined areas are too small to be a useful target for policy
Dallas is a city with a long history of intense discrimination. Today, Dallas remains segregated along lines of race and income, but the HOLC map is surprisingly small. In the 80 years since the map was drawn, the city has grown five-fold. Today, the city of Dallas hosts over 1.3 million residents (including roughly 300,000 Black residents) but has a redlined population of just over 28,000. Policies to address redlining specifically would have little effect on racial homeownership and wealth disparities in Dallas.
Washington, D.C. is noticeably absent from discussions of redlining. The reason is simple, and reveals one of the most intractable problems with using these maps to guide policy implementation: We simply do not have any record of a redlining map drawn for 1930s Washington. While it is difficult to imagine the District—long known as “Chocolate City”—being spared from a nationwide effort targeting Black residents, it is not hard to find examples of place-based discrimination that happened in the nation’s capital in the 20th century and continue today. Discriminatory lending at the local level does not require a federally commissioned map, but it helps.
If the 2020 presidential candidates and other federal policymakers wish to close the homeownership and wealth gaps, efforts cannot be considered complete without including the city of Washington. Without a map to guide them, a new system must be devised for implementing policy there. And if that can be accomplished for Washington, then it can be accomplished nationwide.
Other places which display this pattern: all but some 200 cities nationwide, including nearly every suburb and rural area.
ONCE-REDLINED AREAS ARE NO LONGER A PROXY FOR BLACK AMERICA
Redlining was a federally created—but locally implemented—form of discrimination. As such, redlined areas, and the cities in which they are located, vary widely in size, demographics, and location. Moreover, the racial makeup of the population in redlined areas has grown and evolved dramatically over the last eight decades, and the effects of the practice have spread beyond the confines of the original maps.
The practice of redlining was explicit in its targeting of Black Americans. While Latino or Hispanic residents, low-income white residents, noncitizens, communists, and other populations the federal government deemed “risky” were often included in redlining, they were not targeted in the same manner as Black residents. Today, neighborhoods that fall within once-redlined areas are more likely to have a higher concentration of Black residents, as well as lower incomes, lower home values, and other negative economic characteristics relative to the rest of their cities.
However, proposals that base their remedies primarily on formerly redlined areas paradoxically do not redress the main racial group that was explicitly targeted, exclude important Black neighborhoods and communities, and would skew impact toward a handful of large cities. Place-based discrimination—the practice of divesting in neighborhoods wholesale on the basis of race—has had adverse effects on both people and place. Policymakers should be intentional in ensuring that their proposed solutions can address both.
Consequently, redlining—the master’s tool—will prove to be insufficient in dismantling the legacy of racial inequities in homeownership and wealth in the United States.
METHODS
We define formerly redlined areas as those geographies marked “Hazardous” or “Fourth Grade” and thus outlined in red via the University of Richmond’s Mapping Inequality project. We define cities as census “Places” and choose principal cities as our unit of comparison, rather than metropolitan areas, to better account for the general centrality of redlined areas around urban cores. Principal cities are defined by the U.S. Census Bureau. Population totals and characteristics are tabulated by aggregating all census block groups whose population-weighted centroids fall within any redlined area (including those areas outside of contemporary principal city limits), estimating aggregated medians and margins of error by linear interpolation. Block groups are the smallest geography for which the American Community Survey provides estimates for the latest dissemination period (2017). However, not all socio-economic characteristics which are available in the ACS at the census tract level are available for block groups. Block groups offer a finer approximation of the irregular geographies of redlined areas, at the expense of accessing fewer ACS estimates. As this analysis is based largely on demographic totals, which are available at the block group level, we choose to make the best possible geographic approximation instead of a broader socio-economic snapshot. Because we examine whether the complicated boundaries of these geographies should be followed closely today, we therefore deem it necessary to estimate the most accurate interpretation of those boundaries possible. At time of writing, 2010 population totals for census blocks are available (and would provide a finer resolution of irregular redlining geographies than block groups), but these figures are nine years old and do not include any socio-economic characteristics. After the 2020 census, block level population data will allow for finer demographic analysis of redlined areas using up-to-date figures. All margins of error and significance tests are calculated at a 90% confidence interval.
Last month, the California Association of Realtorspredicted a slow down for the state’s housing market in 2020.
According to a recent report by CoreLogic, cooling home sales are already here. In fact, August marked the fewest home sales for that month in four years.
“California home sales edged moderately lower in August, marking the twelfth month out of the last 13 in which sales were lower than a year earlier as some would-be buyers remained priced out and others stayed on the sideline, hesitant to buy near a potential price peak,” the report stated.
CoreLogic estimated that during August about 42,440 new and existing houses and condos sold in California. That number is down 0.2% from the previous month and down 2.8% from August 2018. While the number of sales declined, so did the median home price in comparison to its June 2019 peak of $509,000.
According to CoreLogic, the median price paid for all new and existing houses and condos sold statewide this August was $499,000. While this price is down 0.2% from $500,000 in July 2019, it is up 1% from the previous August, when median prices sat at $494,000.
The report stated that home sale activity normally edges higher between July and August. As stated earlier, this August was the twelfth month out of the last 13 in which sales were lower than a year earlier. The only annual gain was seen in July this year, and CoreLogic is attributing that gain to lower mortgage rates.
“The significant drop in mortgage rates in recent months has helped stoke sales by enabling many buyers to purchase homes with at least modestly lower payments than they would have faced last year,” the report stated. “While California’s median sale price was up 1% year over year this August, the state’s ‘typical mortgage payment’ – the monthly principal and interest payment on the median-priced home – fell almost 11% because of a roughly 1 percentage point decline in mortgage rates over that 12-month period.”