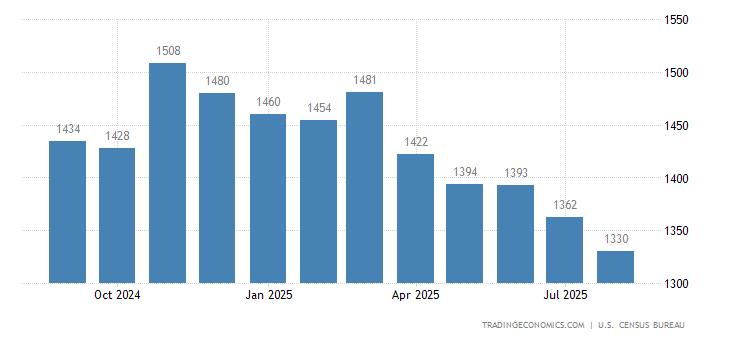
Privately-owned housing units authorized by building permits grew 5.9 percent in October to seasonally adjusted annual rate of 1,297K. This is the strongest number since January. Single-family authorizations in October were at a rate of 839K; this is 1.9 percent above the revised September figure of 823K. Authorizations of units in buildings with five units or more were at a rate of 416K in October, 13.4 percent above September figure of 367K. Building Permits in the United States averaged 1356.10 Thousand from 1960 until 2017, reaching an all time high of 2419 Thousand in December of 1972 and a record low of 513 Thousand in March of 2009.

| Calendar | GMT | Actual | Previous | Consensus | TEForecast | |
|---|---|---|---|---|---|---|
| 2017-10-18 | 12:30 PM | Building Permits | 1215K | 1272K | 1245K | 1190K |
| 2017-11-17 | 01:30 PM | Building Permits MoM | 5.9% | -3.7% | 2.0% | 2% |
| 2017-11-17 | 01:30 PM | Building Permits | 1297K | 1225K | 1240K | 1245K |
| 2017-12-19 | 01:30 PM | Building Permits MoM | 5.9% | |||
| 2017-12-19 | 01:30 PM | Building Permits | 1297K |
Building Permits refer to the approvals given by a local jurisdictions before the construction of a new or existing building can legally occur. Not all areas of the United States require a permit for construction. This page provides the latest reported value for – United States Building Permits – plus previous releases, historical high and low, short-term forecast and long-term prediction, economic calendar, survey consensus and news. United States Building Permits – actual data, historical chart and calendar of releases – was last updated on November of 2017
read more…
https://tradingeconomics.com/united-states/building-permits
